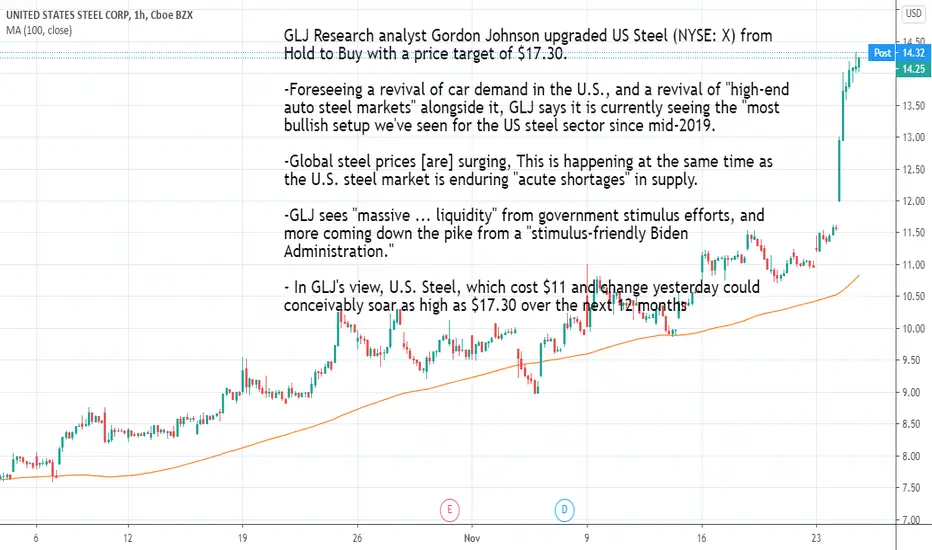
GLJ Research Upgrades US Steel (X) to BuyGLJ Research analyst Gordon Johnson upgraded US Steel (NYSE: X) from Hold to Buy with a price target of $17.30.
-Foreseeing a revival of car demand in the U.S., and a revival of "high-end auto steel markets" alongside it, GLJ says it is currently seeing the "most bullish setup we've seen for the US steel sector since mid-2019.
-Global steel prices surging, This is happening at the same time as the U.S. steel market is enduring "acute shortages" in supply.
-GLJ sees "massive ... liquidity" from government stimulus efforts, and more coming down the pike from a "stimulus-friendly Biden Administration."
- In GLJ's view, U.S. Steel, which cost $11 and change yesterday could conceivably soar as high as $17.30 over the next 12 months
www.fool.com
www.streetinsider.com
Stockmarkets
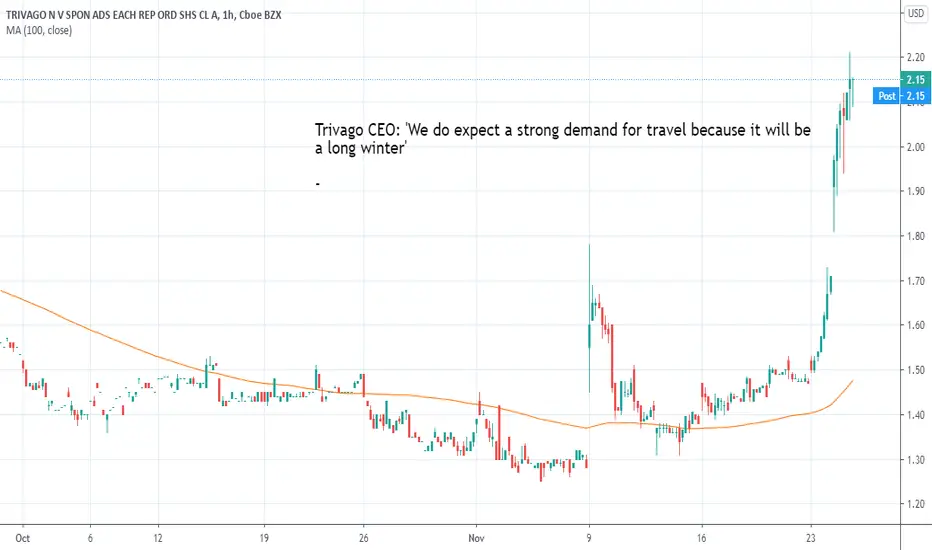
Trivago CEO: 'We do expect a strong demand for travelTrivago CEO: 'We do expect a strong demand for travel because it will be a long winter'
finance.yahoo.com
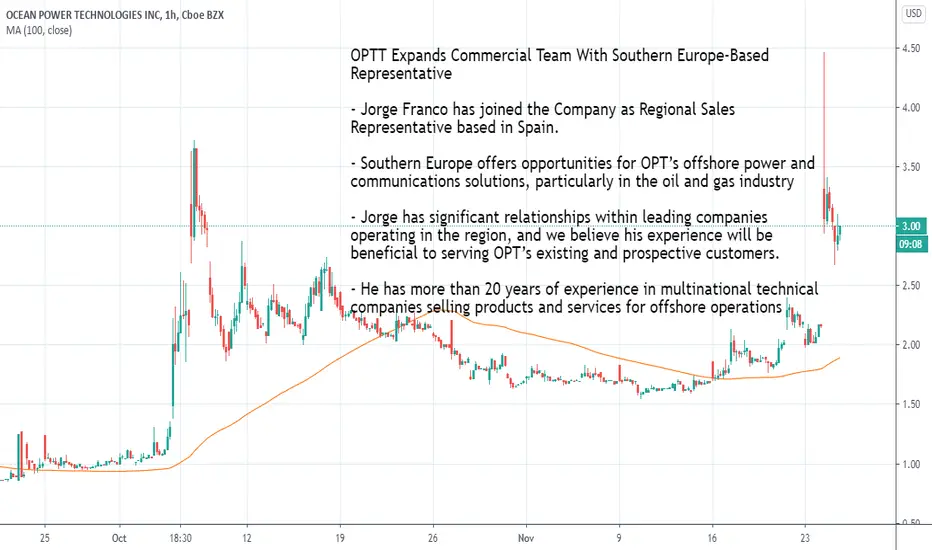
OPTT Expands Commercial Team With Southern Europe-Based RepOPTT Expands Commercial Team With Southern Europe-Based Representative
- Jorge Franco has joined the Company as Regional Sales Representative based in Spain.
- Southern Europe offers opportunities for OPT’s offshore power and communications solutions, particularly in the oil and gas industry
- Jorge has significant relationships within leading companies operating in the region, and we believe his experience will be beneficial to serving OPT’s existing and prospective customers.
- He has more than 20 years of experience in multinational technical companies selling products and services for offshore operations
finance.yahoo.com
RKT-This Is The Moment To Buy. With the support level at 20 and head and shoulders bottom, I think we will see the range of 28-30 next month. The 0.702 retracement level is very important.

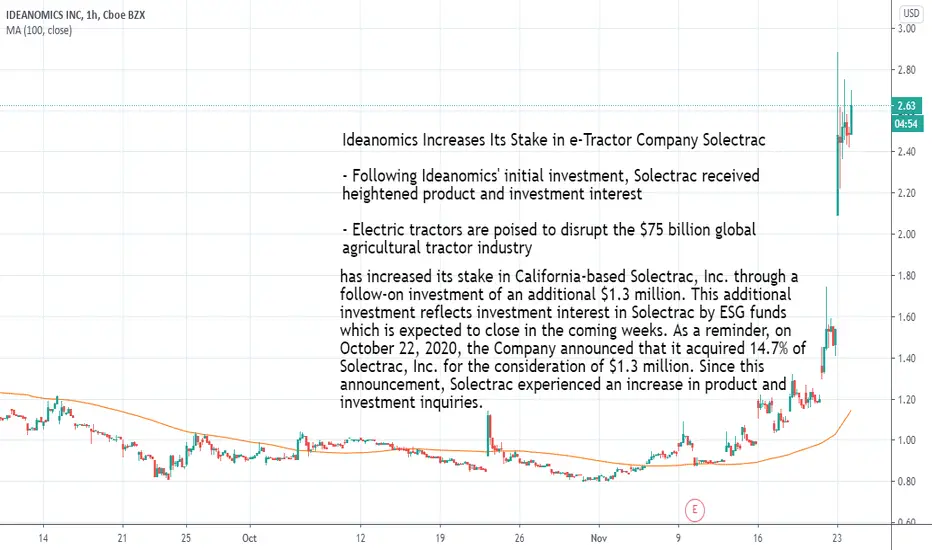
Ideanomics Increases Its Stake in e-Tractor Company Solectrac- Electric tractors are poised to disrupt the $75 billion global agricultural tractor industry
NEW YORK, Nov. 23, 2020 /PRNewswire/ -- Ideanomics (NASDAQ: IDEX) ("Ideanomics" or the "Company") announces that it has increased its stake in California-based Solectrac, Inc. through a follow-on investment of an additional $1.3 million. This additional investment reflects investment interest in Solectrac by ESG funds which is expected to close in the coming weeks. As a reminder, on October 22, 2020, the Company announced that it acquired 14.7% of Solectrac, Inc. for the consideration of $1.3 million. Since this announcement, Solectrac experienced an increase in product and investment inquiries.
This recent investment increases Ideanomics ownership to 24%, which will reduce to approximately 22% post-money once the additional third-party investment is finalized. The new investment by Ideanomics allows Ideanomics to increase its share of ownership sufficiently to recognize its stake in Solectrac under the equity method for US GAAP accounting purposes.
We believe Solectrac has enormous potential and, given the uptick in both product inquiries and investment interest they are seeing, we exercised our rights to increase our stake so we can help Solectrac scale to meet anticipated market demand ," said Alf Poor, CEO of Ideanomics.
Solectrac develops, assembles and distributes 100% battery-powered electric tractors—an alternative to diesel tractors—for agriculture and utility operations.
finance.yahoo.com
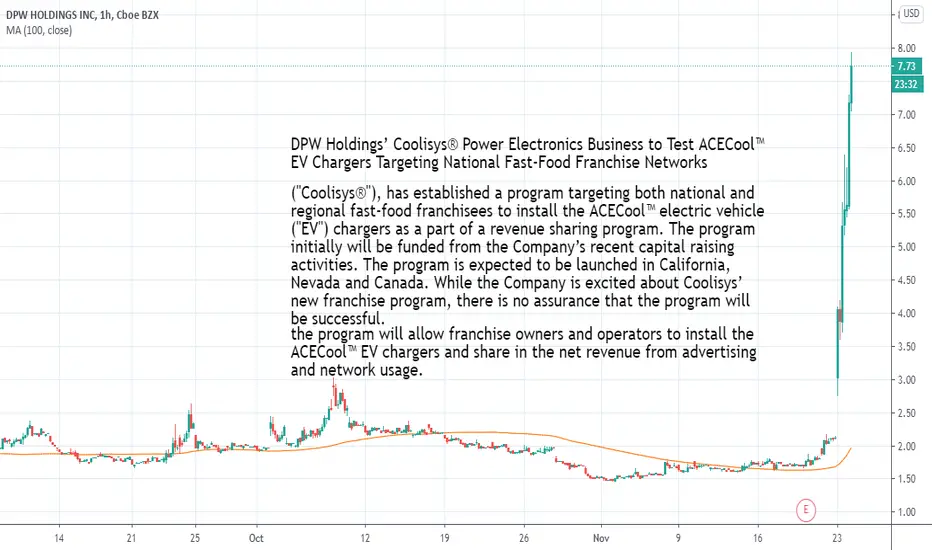
DPW Shares rises on Plan to Put EV Chargers at Fast-Food OutletsDPW Holdings’ Coolisys® Power Electronics Business to Test ACECool™ EV Chargers Targeting National Fast-Food Franchise Networks
("Coolisys®"), has established a program targeting both national and regional fast-food franchisees to install the ACECool™ electric vehicle ("EV") chargers as a part of a revenue sharing program. The program initially will be funded from the Company’s recent capital raising activities. The program is expected to be launched in California, Nevada and Canada. While the Company is excited about Coolisys’ new franchise program, there is no assurance that the program will be successful.
the program will allow franchise owners and operators to install the ACECool™ EV chargers and share in the net revenue from advertising and network usage.
Coolisys expects to launch its program with a national fast-food network franchisee that forms a part of a network with over 1,000 locations. Coolisys expects to announce other network partners in the first quarter of 2021.
Global EV sales rose a dramatic 65% from 2017 to 2018, for a total of 2.1 million vehicles, with sales figures steady through 2019.
EV demand is again expected to rise according to a study by Bloomberg New Energy Finance, which sees improved batteries, more readily available charging infrastructure, new markets and price parity with internal combustion engine vehicles as the major growth drivers.
finance.yahoo.com
Arrival to list on NASDAQ through merger with CIIG Merger Corp.-Arrival, the company creating electric vehicles (“EVs”) with its game-changing technologies, has entered into a definitive business combination agreement with CIIG Merger Corp. (NASDAQ: CIIC); and the newly combined company will be listed on the NASDAQ under the new ticker symbol “ARVL”
-The transaction values the combined company at an enterprise value of US $5.4 billion and is expected to provide approximately US $660 million in gross cash proceeds to the Company.
-As part of the transaction, CIIG raised a US $400 million fully committed common stock PIPE that was anchored by Fidelity Management & Research Company LLC, Wellington Management, BNP Paribas Asset Management Energy Transition Fund, and funds and accounts managed by BlackRock
-Arrival is producing EVs competitive in price with fossil fuel alternatives and substantially lower than comparable EVs
-Arrival has developed a new method of designing and producing zero-emission vehicles using its proprietary hardware, software and robotics technologies and low cost Microfactories
-Arrival has signed contracts with total order value up to US $1.2 billion and its first products are planned for production in Q4 2021
-Arrival has previously received investment from strategic partners Hyundai, Kia, UPS, Winter Capital, and funds and accounts managed by BlackRock
-The combined company will add Peter Cuneo, CIIG’s Chairman and CEO, as Non-Executive Chairman to its post-closing Board of Directors
www.globenewswire.com

$AMGN - NR Picks Nov 22Amgen se dedica a descubrir, desarrollar, fabricar y ofrecer terapias humanas en todo el mundo. Se centra en las áreas de inflamación, oncología / hematología, salud ósea, enfermedades cardiovasculares, nefrología y neurociencia.
La compañía tuvo una reacción positiva a inicios de mes cuando presentó una actualización de su fármaco para la psoriasis, durante el mes el precio de la acción fue cayendo hasta estar cerca a los niveles pre-reacción.
Este retroceso se ve como una oportunidad para Amgen , recordemos que esta compañía es una de las mas importantes del sector. Creemos que el interés de los inversores durante el mes ha cambiado a compañías que están brindando actualizaciones sobre el desarrollo de la vacuna contra el COVID-19.

Butterfly Network to merge with SPAC Longview in $1.5 billionButterfly Network, a global leader in democratizing medical imaging, to be listed on NYSE through a merger with Longview Acquisition Corp.
Butterfly iQ is the only ultrasound transducer that can perform "whole-body imaging" with a single handheld probe using semiconductor technology. Connected to a mobile phone or tablet, it is powered by Butterfly's proprietary Ultrasound-on-Chip™ technology and harnesses the advantages of AI to deliver advanced imaging that we believe is easy-to-use, improves patient outcomes and lowers cost of care.
- The Pro Forma enterprise value of the merger is $1.5 billion, with the combined company expected to have an estimated $584 million in cash after closing.
- 100% of the equity of existing Butterfly Network investors, including Baillie Gifford, The Bill and Melinda Gates Foundation and Fosun Industrial Co., Limited, will convert into shares of the combined company. There will be no selling stockholders in the transaction.
- The business combination is expected to be completed by the end of the first quarter of 2021, and the combined company will be listed on the NYSE under ticker symbol "BFLY."
finance.yahoo.com

Luminar has struck a deal with Mobileye, an Intel company!Luminar Technologies, Inc. (“Luminar”), the global leader in automotive lidar hardware and software technology, which is currently in the process of becoming a public company through its expected merger with Gores Metropoulos, Inc. (Nasdaq: GMHI, GMHIU, GMHIW), a special purpose acquisition company, has struck a deal with Mobileye, an Intel company, to supply Luminar lidar for the company’s Autonomous Vehicle (AV) Series solution in its next phase of driverless car development and testing.
As part of the agreement, Mobileye will collaborate with Luminar to use its lidar for the first generation of its level 4 Mobility-as-a-Service (MaaS) pilot and driverless fleet in key markets around the world
Luminar’s technology will be used to enable Mobileye’s TRUE REDUNDANCY™ solution which is uniquely comprised of multiple self-contained sensor systems to enable uncompromised safety and validation for level 4 driving. By processing completely independent streams of data from 360-surround view cameras, lidar, and radar, the solution ensures significantly greater perception accuracy and eliminates the impact of disruptions to an individual sensor.
Austin Russell, Founder and CEO of Luminar Technologies said that“Mobileye disrupted the auto industry to become the undisputed king of ADAS, and with the right partner is uniquely positioned to enable autonomy at an unprecedented scale.” “After collaborating with Mobileye for over a year, we’re excited to formalize this deal and work towards a shared vision of making autonomy safe and ubiquitous.”
Luminar has secured a total of 50 commercial partners across passenger vehicle, trucking, and robo-taxi verticals, representing approximately 75% of major players in the targeted customer ecosystem. Luminar’s accelerating commercial traction has resulted in opportunities to convert 12 of its OEM programs and engagements from development stage into production.
Key 2020 achievements across its three key verticals include:
Passenger Vehicle – Luminar has secured the industry’s first series production deal for consumer vehicles starting in 2022. Luminar remains on schedule with the first Iris sensors now running live on vehicles. Luminar is partnered with seven of the top 10 largest automakers at various development stages, with timelines to series production landing between 2022-2025.
Trucking – Luminar is partnered with the largest global truck OEM to commercialize Level 4 autonomous trucks for long-haul highway use cases; Luminar is now also powering all other major autonomous trucking programs globally.
Mobility-as-a-service – Luminar is now working with a number of major next-generation autonomous robo-taxi programs, with particular focus on those closer to series production, including Mobileye’s internal Mobility-as-a-Service program.
www.businesswire.com

S&P500(SPY) overbought in channel. Expect Correction. Sell!
Hello, Traders!
S&P500 is trading in a rising channel
Hovering below the resistance
I expect a correction to the support
Therefore I am currently bearish
Sell!
Like, comment and subscribe to boost your trading!
See other ideas below too!

3 Reasons Why You Should TradeNow before I started, you may have thought my top reasons were probably things like:
You can trade anywhere, you can do it anytime, and you will have a lot of free time and money.
Yes, all of these are good reasons, but I wanted to give you my top three reasons why I think that you should trade.
Reason Number Three: Trading Can Make You Money & Money Buys Happiness
I’m a firm believer that money CAN buy happiness.
Now, I know that this is controversial because people say,
“Money can’t buy you happiness.”
Based on my experience, they are wrong.
I will prove it to you.
If you’re an avid reader of this blog, a subscriber to my YouTube channel, or are a member of Rockwell Trading, you know I’m always about the facts.
I have multiple trading accounts, and recently I was trading a small account live on my YouTube channel using a trading strategy called The Wheel.
Many of you are already trading this strategy as well.
On this account up to this point, I have made $3,204, in a month.
Even though this isn’t my main account, and is one of my smaller ones, $3,200 is not too bad.
Let me prove to you how money can buy happiness.
Let me ask you, do know somebody who is in a tough spot right now with everything that we have going on in the world?
Do you know someone who got laid off and couldn’t pay their rent?
Someone who got sick and couldn’t afford to buy the needed medication?
What about somebody whose car broke down, and didn’t have money to fix it making transportation difficult?
So so let me ask you this. What if you could have given them $3,204?
Do you think that this could have changed that person’s life?
Making $3,000 for me is nice, but it doesn’t change my life.
But maybe you know somebody whose life we can change with this.
Very recently, I decided to give away that month’s worth of profits to a few people in need.
I had our members and viewers nominate someone they knew, who was currently having a tough time.
We received so many applications, and I reviewed the (heart-wrenching) submissions.
I picked the two candidates who I felt could use it the most, and I split the profits from this trading account and sent them a check.
It helped them out a great deal, and it meant the world to them.
So for me, this was very solid proof that money CAN buy happiness, and can change your life for the better.
I believe we have a responsibility to make more money to help not just ourselves, but others.
Money buys happiness and this is why I will keep doing it.
I’m doing this information out there because I want you to succeed.
I want you to make money to give back.
There are so many people in need that you could help.
Here is an example of one of the nominations for the recipient of the trading profits we gave away.
This nominee is a single mother of four children.
Her son had a needed surgery a while back and she got stuck with a $9,000 bill.
She’s getting garnished for this by taking $150 from each of her paychecks.
She’s a nursing assistant and doesn’t receive all that much.
She wasn’t one of the recipients that I chose as the final two, but I decided to send her the money that she needed anyway.
Now doesn’t have to worry about her paychecks getting garnished for a whole year.
Here is an email that I received over the weekend, and it’s from a man named Robert, and it read,
“Markus, thank you for being you, brother! Could go into a long story about how ironic it is that I’ve been a Rockwell member for almost four years and finally started applying your trading rules in August of 2020, and had one of my best months ever."
"But that’s not what this is all about. I would like to donate an additional $300 to whoever you decide to give the money to. I feel very blessed and just want to pay it forward. Let me know the best method to get the money to you."
"Thanks for your persistence and all you do.”
Why I’m showing you this e-mail? This is exactly what happens when we start making money together.
I know that people are probably telling you,
“You can’t make money with trading.”
Well, you know what? Prove them wrong. You can make money with trading.
Is it easy? No, because you need three things:
You need the right strategy, the right tools, and the right mindset.
Together we can make a difference
Money buys happiness.
I believe we have a moral obligation to make as much money as we possibly can to be like Robert.
I know that many of you are already donating.
I mean, you have told me in these emails and I’m so, so proud of you for what you’re doing already.
Together we can make a difference.
This is what this blog is all about, and this is what this message is all about.

Sell Microsoft 1/11/2020Microsoft share could not reach the previous high at 232
With lower volumes on the upside and higher volumes on the decline
So it can sell
Targeted 172
Stop Losses 225.5

Sell APPLE 2/11/2020Apple share could not reach the previous high at 137.7 With lower volumes on the upside and higher volumes on the decline So it can sell Targeted 92.18 Stop Losses 126.12

The inescapable Financial Collapse; A 4-Dimensional analysisThis is the SP500 / Gold / the US Dollar / a G10 Composite Currency Index / Time / Price, all of it, all at once! - Lets call it: Universal Value. - Shall we...
This is a 2-Dimensional projection (being on a flat computer screen, after all :-) of a 3-Dimensional "Slice" of a 4-Dimensional space. - So try to visualize it. (Not as difficult as it first may seem.)
Envision a box with only 4 sides - i.e.: a tunnel - which constitutes the entire Universe, in which everything exists, and the only option for interaction with said universe is to twist the walls freely, into any desired configuration, along the tunnel's principal axis - in this case the horizontal, Time axis.
This is a broad-strokes, yet, reasonably accurate depiction of the concept of: Value. - In this case, projected onto the SP500 Index.
"How does one escape such a tunnel where one's options are duly limited (mathematically and physically) to only twist the walls of such a tunnel?" - You ask...
It is literarily impossible, so good luck with that!
Thus, cheer on, trade the hell out of it and take every last fool for everything they got! (Then run. :-)
... and just in case: There is no "Plan B"!
Here is a likely better - not "shifted" - view, ...
... of the "financial Universe" projected onto the SP500.

NETFLIX price action for Short term !5 month of uncertainty and Neutral trend for NFLX , But a good positions for short term trading , Buy from the Bottom of the channel and sell from the Top .
Fundamentals : The corona virus has increased again and possibility of cities Lockdown can be positive for Stay-at-home Stocks .
Price Action : Price placed at Bottom of the Channel also the 200 Day moving average is close to the price , So this Level can Be the Good support
P.s : Due to divergence, buying Netflix is Not a Good idea for the long term .


Possible 100% Return on FNKOFNKO is significantly undervalued with a strong possibility of a 100% return.

SPX500 Price ForecastAlternative view on SPX500. One more wave up
Share thoughts in the comments
Like and follow for more content
Good Lock

Still aiming at 3000! 🎯Due to the bullish action, we had to update our chart. We put a bullish alternative on the chart. At the moment, the bears are still in charge of the chart, and we see them aiming at the 3000 point mark. However, our alternative scenario depicted by alt. and the dashed arrows must be taken into account with a high percentage of 42%. Price action is in a crucial area right now. If the bulls manage to break above the Resistance at 3550, the SP500 could be on the breakout to 3800 and higher. Our primary expectation under the mentioned 3550 remains a further decline to about 3000. For further confirmation, we need some bearish action and prices to drop at least under the 3460 mark.

Trading After The Presidential ElectionThe aftermath of the election
The presidential election is over, so it is safe to start trading again?
First of all, as of writing this, we actually don’t know yet who has won the Presidential Election.
As of this morning, Biden leads Trump in the Electoral College 264–214, and we are waiting for an update to see who won Nevada.
If Biden wins Nevada, this will give him 270 electoral votes exactly enough to win the presidency.
The Trump campaign has also filed lawsuits against the states of Pennsylvania, Michigan, Nevada, and Georgia as the race to 270 looks to be nearing its end.
As of now, it is still a close race. We won’t have any updates until later today, as Nevada basically said yesterday:
“You know what, we’ll keep counting, but stop bothering us, we’ll let you know tomorrow around noon. Until then we will not publish any more results.”
we will see what is happening there soon.
Looking back to last week, the markets were a little bit worried about a so-called “blue wave.” This means the Democrats would control both the House of Representatives, and The Senate.
What it comes down to is, how is power being distributed? As of right now, it seems that the Senate COULD remain Republican.
However, we’re not quite sure yet. It is very close, but it doesn’t seem that we have this “blue wave” that the markets were fearing.
As for The House of Representatives, it seems that it likely to remain Democratic.
So we still don’t know for sure who will control The House, The Senate, or win the Presidency. It’s still a close race.
There’s still a lot of “would of, could of” and speculation as far as what will happen if Trump stays in office, or if Biden takes over.
How is the election affecting the markets & traders?
Yesterday morning, the day after the election, the markets were rallying big before pulling back a little bit.
The DJI was up more than 900 points as it continued to shoot up that morning, before pulling back before the close.
The S&P 500 was up 2.37% and its the same picture here, jumping up before retracing
The NASDAQ was the leader of that day towards the close. Up 4.2% and as high as 5% earlier in the day.
What is causing this?
As I mentioned, looking at the election results so far, there doesn’t seem to be a “blue wave” coming.
This means that there is a division of the powers and not everything in the hand of one party. This is what traders and the markets are looking for right now.
A division of the powers could mean fewer regulations on ‘Big Tech’. This is why yesterday, the day after the election we saw big jumps in companies AAPL , AMZN , GOOG , etc.
AMZN was up 6% near the close. AAPL was up over 5% and finished up over 4%. NFLX closed up almost 2%, FB closed up almost 8%, and GOOG and MSFT both closed up almost 6%.
This is why The NASDAQ was leading the way higher, when before it was lagging behind The S&P 500 and The DJI .
News from the election that is affecting the markets
In California, voters pushed for Prop. 22. This will allow UBER and LYFT to keep classifying their drivers as independent contractors instead of employees.
This was a big win for both companies resulting in both companies being up almost 12% and 13%.
Another thing on trader’s minds is the stimulus deal (or lack of one).
Recently, Senate majority leader Mitch McConnell said that a stimulus package should be passed by the end of the year.
This is what market participants were waiting for, as new cases for the Coronavirus continue to rise.
We are up to almost 95,000 new cases of Covid-19 a day, and Dr. Fauci has said that we are positioned really badly as we head into Flu season.
It’s important to keep in mind that uncertainty could creep back into the markets as the Trump Campaign is calling for lawsuits, and as new Covid-19 cases continue to rise.
Is it safe to trade after the presidential election?
The key question is, “How do we trade this?”
Before the election, I said that we should all sit on our hands. For those of you trading The Wheel Strategy, we had an opportunity, on election day, to close out a TQQQ 100 put that I sold.
This is the ONLY position that I had going into the election. I sold this put last Thursday and I was able to buy it back on election day, for a nice profit of about $250, after only being in the position for 5 days.
Now, the next morning when I saw the markets were up, I thought that after the initial excitement we would fill the gap.
After we saw that we might not have any results from the election for a few days I thought we would hover where we opened at around $133 or maybe lower.
Instead, we went higher so here’s what I did. I sold a call with a strike price of 148. I sold this call for $2.45 which means I took in another $245 in premium.
My break-even price on this trade was around $132. At one point I was down $3,000 but I just kept selling more premium according to the rules of The Wheel Strategy.
Overall I’ve realized $2,300 by selling premium. If I would have closed out the trade right then, I would have closed it with a profit, but I didn’t plan to do that just yet.
Should TQQQ keep dropping, I will be able to buy back the call that I sold against my shares.
If my shares are “called away” I would lose $200 of the premium I earned, but would still be up over $2000 on this trade.
I checked this position yesterday and it started the day up $1,400, and this is the only position I am in. For now, I am not taking making any other trades. I may start trading again later this week, but for now, I’m just going to sit on my hands.
The markets are still rather flat, trending sideways, as market participants are waiting for the final results of the election to come in.
Trading After The Presidential Election Summary
Whether you like what’s happening with the election so far, or whether you will like the final results of the election or not, as traders it is our jobs to react to this and make the best out of it by adjusting our trading strategies.
With still a lot of uncertainty looming, I recommend sitting back and waiting to take any new positions until the air clears.
There is a saying among sailors: “You can’t change the wind, but you can adjust your sails.”

TSLA to the moon I don't want to explain too much, look at the chart, TSLA is accumulating enough to pop up 550 per share is possible

SPX500 - next movesImportant zone below, if it falls below it down we should visit bottom of parallel channel, alternative would be to go up to top of channel and then we should see what would happen. Covid cases may impose restrictions on global level thus if everyone expects a crash, we might actually not get to it due to contrarian ideology. Vaccine news are to be expected soon as well so currently I would increase cash positions until clearer time.
