This Stock Is About to 10x ----- DO NOT MISS THIS OPPORTUNITY $$MartyBoots here . I have been trading the markets for 13 years and want to share my ideas with you
Do NOT MISS THIS
Stockmarkets

Target 1.68From my analysis I see growth prospects up to area 1.68 before the end of the month. The rise in oil prices, economic activity and the climate of positivity that is developing may bode well for this trust. I have it in my portfolio as monthly cash flow


Is 27,000 going to be your number? There were mad moves on the DJI (Wall Street) north on Friday 5th May 2020. The bulls gored the bears big time.
But there's 'fundamental' stuff that's not right. The Bureau of Labour Statistics (easily findable via a search engine), said that their figures were not correct. They even said in their report that if unemployment was counted more correctly the percentage would have been 3% higher.
However, the bulls were in a frenzy. Greed and hope dominated. Reality meant nothing.
Then there are other problems coming up. If you don't believe that COVID-19 has died and you think that human beings are the main vehicle of transmission, then mass protests breaching social distancing and public gatherings are likely to bring a second wave of virus infections. Hello - what caused the bubble to pop in the first instance?
If you don't believe that there is cure or vaccine in sight for the next 6 months to fight this virus, then it means the virus is gonna exploit human interactions from mass protests across America and other parts of the world - without restraint.
If you believe that money printing is the economic fix for the myriad effects of COVID-19 on GDP (and that GDP is important), then for you the markets will charge north forever!
The choice is yours about what you believe. But what you believe could be the result of manipulation of minds by fake news. Some say there is no such thing as fake news.
Disclaimers : This is not advice or encouragement to trade securities. No predictions and no guarantees supplied or implied. Heavy losses can be expected. Any previous advantageous performance shown in other scenarios, is not indicative of future performance. If you make decisions based on opinion expressed here or on my profile and you lose your money, kindly sue yourself.

S&P 500 Elliot Wave Correction Hello all,
I do not typically do any analytical content out side of cryptocurrency, but with the state of the markets and everything happening I thought I would take a look. This analysis is just a simple thought process so do not trade based off this.
S&P 500 in Elliot Wave Correction. This seems to be a possibility. After the unfortunate spike in the confirmed cased of Covid19, the market took a hard hit, again. This new wave of cases is possibly linked to the increased crowds, parties, and gatherings for memorial day a couple weeks ago. If this is the case, I have reason to believe that it is just the beginning of the confirmed case increase. I say this because very recently there has been a large amount of protesting in the states, millions of people gathering together. I will not comment on that of course, but I will say that it is the perfect storm. It may have just helped spread the virus even more than ever before. It is unfortunate as these predictions on markets are not just about the value of something, but it is a reflection of how bad things are. So keep that in mind. I hope this was helpful.
Stay safe all, trade safe, and stay healthy.
Thanks for reading.
- Max K.

StockMarket Update : Something definitely feels wrong !!!Hope this idea will inspire some of you !
Don't forget to hit the like/follow button if you feel like this post deserves it ;)
That's the best way to support me and help pushing this content to other users.
Kindly,
Phil

DAX30 Key Levels D1, H4 and H1 + General thoughts for trading itThe stock market has been pumping and with things coming back to normal, we are going to likely be climbing back up to pre-covid19 levels, but nobody knows this for sure, so I find marking key levels of support and resistance helps me keep track of my bias so can take trades accordingly.
Once the levels are nailed down the execution becomes the next task....
Next Monday If we break daily resistance @ 12870 and find support to test weekly levels @ 12940 then then it will be safer to stick to buys to mid-13000s.
However, you can scalp sells with prices first reaction at these levels, for this i would recommend using the smaller time frames.
If you have traded DAX30 you will know it can move harshly compared to the smaller indexes.
If anyone has any advice on how they like to trade DAX30 let me know.
Push like or leave a comment if you agree with my key levels.
Thanks for viewing.
Daniel
UCFX

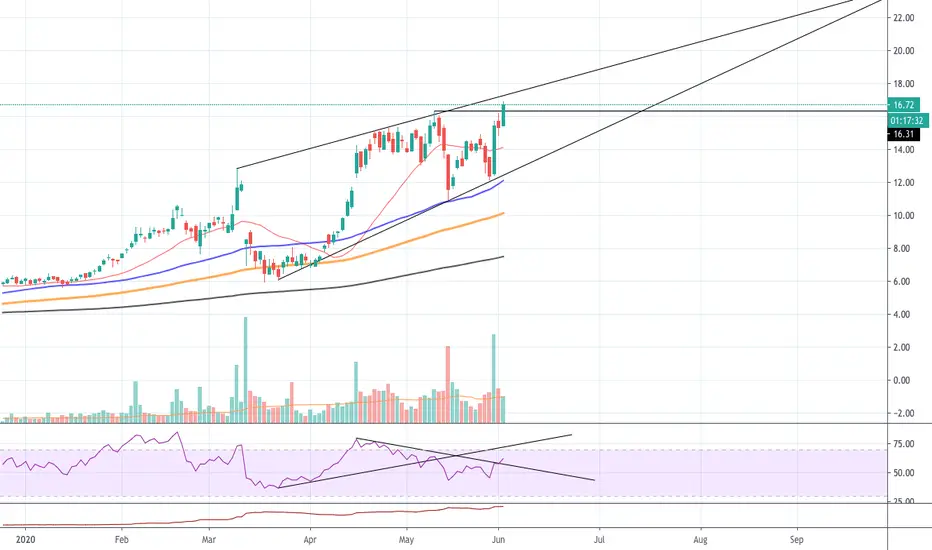
COMPUGEN $CGEN "BREAKINGOUT"It is breaking the buy point out today. The volume is about to exceed the average. watch for channel resistances.
12 months Consensus Price Target: $18.57
if you find my charts useful, please leave me "like" or "comment".
Please don't trade according to the ideas, rely on your own knowledge.
Thx
WARNING! Kill zone ahead - S&P 500This is not a prediction. I don't do predictions. The setup is only a probabilistic estimate based on a reckless disconnect between market sentiment and fundamental reality. It's probably the most reckless in history.
For every probability estimate in one direction - NOTE CAREFULLY - that there is a residual probability in the opposite direction. So if for example one thinks there is a 60% chance for the south, then there is a 40% chance for the north. I am not saying the S&P500 has a 60% chance of falling south from the kill zone shown. The best I could do is 51% - which means 49% chance (in my mind only) that it'll bust north.
I always make potential losses very prominent in my posts.
Disclaimers : This is not advice or encouragement to trade securities. No predictions and no guarantees supplied or implied. Heavy losses can be expected. Any previous advantageous performance shown in other scenarios, is not indicative of future performance. If you make decisions based on opinion expressed here or on my profile and you lose your money, kindly sue yourself.


Coca-Cola bullish potential!Hello fellow traders ! The chart speaks for itself, nice bullish candle trend break with the 50 day moving average as support. MFI was oversold and making its way up, stochastics gaining traction as well. Looking at the fib levels to have an exit plan. Just my opinion! Good luck ! ;)

Upwork Finances.Upwork is a company that mainly makes money as their hired consultants make money. So the more employers hire people through the service the more revenue they generate. This could be problematic long term as after they hire a "temporary employee" because thats whats assumed through the program if they decided to hire them long term after their term is over then Upwork gets nothing. AND they just lost future revenue. PLUS
Over the past few years they have been in the hole.
We have a history of net losses, anticipate increasing our operating expenses in the future, and may not achieve or sustain profitability.
Quote from their SEC filing 10-K
I will be looking for a SHORT when it seems they have peaked.
RED LINES=DAILY support/resistance
PURPLE LINES= Weekly support/resistance
A lot more pricing information at those higher price points. What could've dropped the price is that they've had an offering so that they can manage extending the life of the company. More offerings means a lower price.

Netflix rompiendo niveles. Buscando crear un nuevo máximoNetflix ha tenido un alza en los últimos días y semanas, llegando a máximos históricos de $433 por acción. Nivel que ha roto el día de ayer y esta convirtiendo ese nivel ahora en un soporte.
Expertos creen que en los próximos meses Netflix pueda llegar a $520 por acción o incluso más.


DJIA and Its Head and Shoulder May 13, 2020If you read my previous post on May 5, you would know that DJIA is completing its head and shoulder. There is a probability that it would go through the support level within 3 trading days.

TESLA INC. - Timeframe: 1H Technical analysisTRENDS
Court terme: STRONGLY BULLISH TECHNICAL INDICATORS: 50% BULLISH / 0% BEARISH / 50% NEUTRAL
MY OPINION: BULLISH ABOVE 800.51 USD
MY TARGETS
862.95 USD (+6.37%)
869.82 USD (+7.21%)
MY ANALYSIS
The bullish trend is currently very strong on TESLA INC.. As long as the price remains above the support at 800.51 USD, you could try to benefit from the boom. The first bullish objective is located at 862.95 USD. The bullish momentum would be boosted by a break in this resistance. Buyers would then use the next resistance located at 869.82 USD as an objective. Crossing it would then enable buyers to target 917.42 USD. Be careful, given the powerful bullish rally underway, excesses could lead to a possible correction in the short term. If this is the case, remember that trading against the trend may be riskier. It would seem more appropriate to wait for a signal indicating reversal of the trend.
FORCE : 7.7/10
Quotes:
The TESLA INC. rating is 811.29 USD. On the day, this instrument gained -0.99% and was traded between 785.00 USD and 824.00 USD over the period. The price is currently at +3.35% from its lowest and -1.54% from its highest.
Technical:
A technical analysis in 1H of this TESLA INC. chart shows a strongly bullish trend. 92.86% of the signals given by moving averages are bullish. The overall trend is supported by the strong bullish signals from short-term moving averages. The Indicators scanner detects a bullish signal on moving averages that could impact this trend.
Numerical data:
The following are the details of the technical indicators and moving averages that were collected to generate this technical analysis:
Technical indicators:
RSI (14): 58.02
MACD (12,26,9): 9.7500
Directional Movement: 2.62
AROON (14): 21.43
DEMA (21): 818.06
Parabolic SAR (0,02-0,02-0,2): 819.55
Elder Ray (13): 3.00
Super Trend (3,10): 781.02
Zig ZAG (10): 817.90
VORTEX (21): 1.0900
Stochastique (14,3,5): 81.60
TEMA (21): 821.64
Williams %R (14): -6.76
Chande Momentum Oscillator (20): 10.03
Repulse (5,40,3): 1.7600
ROCnROLL: 1
TRIX (15,9): 0.2100
Courbe Coppock: 5.70
Moving averages:
MA7: 775.62
MA20: 755.58
MA50: 633.22
MA100: 620.35
MAexp7: 812.49
MAexp20: 804.12
MAexp50: 787.18
MAexp100: 760.04
Price / MA7: +4.60%
Price / MA20: +7.37%
Price / MA50: +28.12%
Price / MA100: +30.78%
Price / MAexp7: -0.15%
Price / MAexp20: +0.89%
Price / MAexp50: +3.06%
Price / MAexp100: +6.74%


guns and butter, Do you remember ECON? $RGR has been doing pretty good the past few months just went over a monthly resistance. Looking to test $65 then $70.
ER is $70 I truthfully think this is an actionable trade.
redline is stoploss for bulls, and point of entry for bears IMO
MAKE THAT MONEY
$SPY $amd $NVDA $PENN $MVIS $QQQ $tqqq $AAPL $SHOP $TSLA $ROkU

At a Critical Area! $3,000 in our eyesight We are def. at a critical area. I'm still leaning slightly on the bullish side. 3k is a good possibility if we bounce and stay within the upward channel. If support doesn't hold and we drop. I see us then re-testing the $2600 area. Hoping for the best, GL to all with trading.

NASDAQ100Short position on NSDQ. Chart on daily. I follow the Fibonacci retracements and have a look on MACD.
Targets:
1. 8566
2. 8202
3. 7837
4. 7366
5. 6658

EGX30 - Egyptian Stock Market - weekly chartA negative Elliot wave scenario for EGX30 under 11000 may go down to 7800 as a first target then down to 6000 but above 11000 will cancel this scenario
Sell in May and go away