Stockmarkets


SPX SPY S&P500This is how I see the S&P500 playing out. Nice counter trend rally and looking to complete an AB=CD retrace.
Just a simple overview of how I see it playing out

AMD needs a pullbackAMD started downtrend from ATH 59 level and created a new bottom at 37.64 thereby completing ABCD pattern on 3/18/20. It has since started a new impulse trend respecting ABCD harmonic pattern with fib levels acting as resistances. On March 30th, AMD completed 0.5 fib retracement 48.02 to complete wave B without going through a single pullback, therefore, it had to retrace back to 0.38 and 0.23 fib levels to complete wave C. Wave CD is supposed to be completed at 127.2% or 51.16 but AMD pumped on low volume today( even AH) along with many other NASDAQ stocks. I was expecting AMD to retest the trendline before breaking out of triangle but this market is not following logic or common sense lol. If AMD breaks 51.16 level tomorrow, the next level of resistance is 0.78 fib level (54.47) but gapping up there without retesting the trend is makes it look very very overextended and short waiting to happen. IDK why the market is rallying when unemployment numbers are sky high and demand for consumer products falling ( especially electronics) but I am not bringing fundamentals into this analysis. Let's see where we open tomorrow- If we gap up, we have a level at 52.85 gap-fill above so maybe that is a good level to start a short position. If we open red, I will consider adding 4/24 puts at the break below 49.5. Good luck trading tomorrow!
Disclaimer: The above thoughts are my own and should not be considered as investment advice.

DOW - COMPLELTY OVERBOUGHT DONT BUY THIS!Hello guys,
Rich people pumped the stocks in order to sell their positions in higher prices, please dont buy at this levels or you will see a blood bath again in the next months.
I highly not recommend to buy at this positions.
Thanks!

S&P 500 further downside to the 1800 value area in late May 2020If today is the top of the corrective wave, then we can establish a Fibonacci extension from the all-time high, to the most recent major low and then to today's top. The 0.786 Fibonacci extension level is within the same value area as some important prior market swing lows.
A new Impulse Wave lower over a 49-day period towards the 2k value area is a very likely scenario.
May 26th, and a few trading days before and after, represent a likely stopping point for a move higher.
May 26th is 96 days (90-day cycle) from the all-time high.
May 26th is 49 days (Death Cycle) from today's minor swing high.


StockMarket Update : Looking for Indices Range BounderiesHope this idea will inspire some of you !
Don't forget to hit the like/follow button if you feel like this post deserves it ;)
That's the best way to support me and help pushing this content to other users.
Kindly,
Phil

How i know what stock have a good future in a crisis - TutorialHello,
Some people asked in Telegram / PM how i know what stock will go up and which one should them short or long.
I made a list about the different sectors of SPX 500 if its needed to go bear or bull on it.
After you choose the sector you need to check the ADX of the coorporation, it need to be strong and always remember to chose the strongest coorporations of the sector that you selected.
Here is the graphic:
imgur.com
You can see my last charts that i did green on almost all of them.
Hope you liked and helped to you!
Please follow me to keep doing daily analysis for free!
Thank you so much!
Regards,

ZOOM completly bullishI expect zoom keeping bullish as all signals show us an ascending channel with a really good improvement.

STRONG SELL TODAY S&P500 - -5% ++Hello,
I expect a really negative closing of S&P 500 this week as the details of covid19 are destroying lot of benefeits from big coorporations.

Dow Jones Reversal Pattern?We have yet to see TWO consecutive green days on the Dow for quite some time...will be finally get that? We have the monetary side with the Fed now buying up assets with unlimited funds. The fiscal side is next with a relief package to be passed in congress.
We had a record over 2000 point gain day today.
From here, we are approaching a very crucial zone. We are looking at the 21000 zone here as it is the last lower high swing. According to market theory, as long as we are under this lower high swing, we are in a down trend. Ideally, would like to see 21000 tested, a pullback, and then a break out. This would give us our first higher low swing to work with AND create the quintessential reversal patter, the head and shoulders.


SPX500 - O Crap! Are we in for the mother of all corrections?From a Elliott Wave Theory perspective it looks like the monthly S&P500 has completed 5 waves up - so the theory dictates we need to correct the 5 waves up with three waves down. The prior 4th wave low is usually the end of the retracement. However, retracements can go all the way back to the prior 2nd low !!!


Comex Gold - Selling The Tops at 1705 $-Case of Ending DiagonalDisclaimer
-----------------------------
All investments involve risk, and the past performance of a security, industry, sector, market, financial product, trading strategy, or individual’s trading does not guarantee future results or returns. Investors are fully responsible for any investment decisions they make. Such decisions should be based solely on an evaluation of their financial circumstances, investment objectives, risk tolerance, and liquidity needs.
-----------------------------------------------------------------------------------------------------------------------------------------------------------------------------
Happy to get the clue straight from the yellow metal & to see it unfolding as expected on 7th March 2020 video idea which was published on Indian Version - Nifty / Gold / USDINR - The important Juncture.
Video Idea (Click the Idea Below)
------------------------------
Long Term Outlook
-------------------------------
A possible case of Ending Diagonal which suggest that the rally which started from 1045$ to 1705$ has completed & we look for downside Targets - 1045$ / 900$ / 750$
Short Term Outlook
Wait for some bounce above 1500$ in the zone 1590 - 1625$ zone - If you see the commodity getting rejected in the suggested zone then putting stops above 1635$ could be an opportunity for selling the commodity for
Targets - 1500$ / 1445$
Thanks for watching the video & stay classy till next idea.

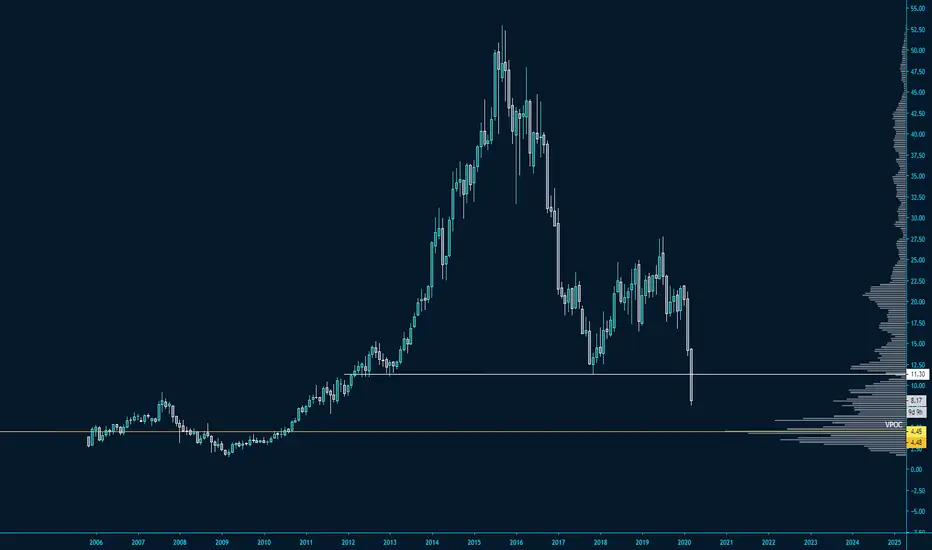
Oil prices testing an old supportThis is weekly chart of oil. The price is testing an old support (dating to 2009). If the support holds, we may expect a significant increase of price that may also lift the stock market. If not, further sell-off is likely.

SPY Market Bottom? BUYING OPPORTUNITY!Hey there,
please support this idea with your likes and follow me here on TV!
Just as a quick update on Stocks.
We are shortterm quite oversold on many indicators with longer term still more potential for further downside.
SPY and many other stocks like TSLA are today on 9 BUY of the TI Indicator sequential!
This is double 9 which means we already had a 9 and are now on a second.
Strong buy signal for short to intermediate term trades.
Cheers,
Konrad


S&P500 Support or Breaklower? Weekly ChartAnother crazy day on the stock market. Will we hold support as drawn, or are we going to break below?
Ichimoku Cloud looking bearish AF. Valid break out so far. This may only be the start of things to come
Be careful,
Mattchimoku
*Not trading advice*
