Stockmarkets

StockMarket Update : Still Waiting for the Range StructureHope this idea will inspire some of you !
Don't forget to hit the like/follow button if you feel like this post deserves it ;)
That's the best way to support me and help pushing this content to other users.
Kindly,
Phil

What does a market reaction to the Fed's decision say?Since yesterday, by and large, was the first full day of working out the Fed’s emergency decision to lower the rate by 0.5%, today some results can be summed up. And they are generally disappointing for optimists. In theory, stock markets should have perked up and provoked a sharp increase in stock indices. But this did not happen, that is, there was growth, but not at the scale that could be expected. In theory, the pressure on the dollar should have intensified. But yesterday, the Dollar Index rose. In theory, the Fear Index was to drop significantly. But according to the results of yesterday, the decrease was insignificant.
What are all these signals talking about? The magic of Central banks no longer works the way it used to. Lower rates no longer automatically resolve existing problems. And this is a very alarming signal for stock market buyers, gold sellers, and other optimists. It seems that the bubble is nevertheless broken and the air, despite all the efforts of its creators, is gradually coming out. In general, monetary policy has exhausted itself and this is an extremely alarming signal: if the situation worsens, it will not be possible to resolve the situation with the usual methods.
The consequences of the coronavirus have not even begun to appear, and Nasdaq is quoted 10% below the maximum and, it seems, can no longer grow with the certainty with which it was literally a couple of weeks ago.
So in everything that happens, we see the strongest confirmation of our basic investment ideas: sales on world stock markets, and especially on the US stock market; gold purchases and sales of risky assets (such as the Russian ruble).
But back to the events of yesterday, which was very full of news. The Bank of Canada lowered the rate immediately by 0.5%. The Canadian dollar obediently worked this out, losing about 100 points paired with the dollar. But in general, the reaction was relatively calm at such a massive reduction in rates.
US employment data from ADP turned out to be quite good: +183K with a forecast of +170K. What sets in a positive mood against the dollar ahead of Friday's official statistics. The ISM Index in the non-productive sphere also pleasantly surprised: 57.3 points with a forecast of 54.8 points. But the Eurozone indices traditionally fell short of expectations and for the most part, came out worse than forecasts.
Well, the results of super-Tuesday played into the hands of the dollar, on which Biden won quite unexpectedly, who is considered a more adequate option from the Democrats as opposed to the “left” Sanders.
In general, our desire to sell a pair of EURUSD intensified up to the recommendation to sell the pair from the current ones with the addition of any attempt to grow.
Oil stocks in the United States have grown quite slightly, but all the attention of oil market participants has been riveted to the OPEC meeting and OPEC+ decisions. It is very likely that today some specific information will appear that could provoke strong movements in the oil market. If OPEC+ decides on additional reductions (ideally about 1 million b/d), oil has a chance of growth. The main stumbling block is Russia and its unwillingness to scale up the reduction.

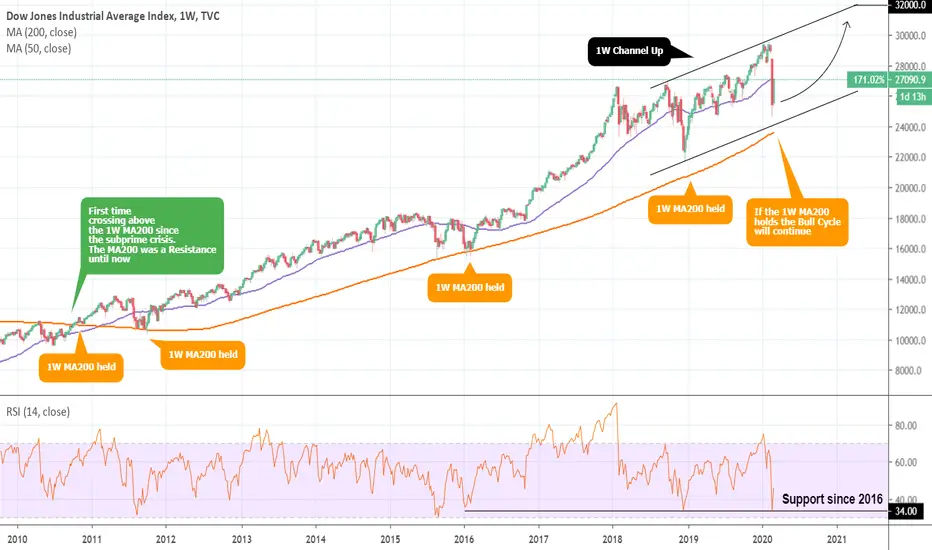
Dow Jones: The importance of the 1W MA200. Bull Cycle intact.This is a long term approach on DJI after the price hit the Higher Low trend line of the 1W Channel Up (RSI = 44.081, MACD = 142.400, ADX = 38.014) following the worst weekly sell-off since the Subprime Crisis. The 1W RSI also just hit the 34.000 level which is a Support since 2016 and last time it visited that level was on the previous Higher Low of the Channel Up in December 2018 (bottom of the U.S. - China trade war tensions).
On such a long term analysis, we want to emphasize the importance of a key marker that is behind this +10year Bull Cycle and how it is keeping the bullish sentiment on stocks alive.
That is the MA200 on the 1W chart. During the 2008 mortgage crisis, the 1W MA200 acted as a Resistance. It first broked convincingly in October 2010 and was immediately tested (and successfully held) as a Support. That was unofficially the start of the new Bull Cycle on Dow Jones, as since then the 1W MA200 has held as a Support on four occasions after sharp market sell-offs (Aug 2015 China's slowdown, Feb 2016 Oil decline, Dec 2018 trade war etc), keeping the multi year uptrend alive.
Last week the index came close again to the 1W MA200, which successfully held. As long as 1W candles close above this trend line, the multi year Bull Cycle will continue and every pull back is a long term buy opportunity. In fact based on the current 1W Channel Up, Dow's next Higher High target is 32,000.
** If you like our free content follow our profile (www.tradingview.com) to get more daily ideas. **
Comments and likes are greatly appreciated.
Great dip buy opportunity on CVNA for a potential 35%+ ReturnCVNA has been on a strong upward trend for the past couple months and presents a great dip buy opportunity for a possible 35%+ return.

Great Dip Buy Opportunity for a 45%+ Return on WynnWYNN has been on a steady horizontal trend for the past couple months. Reaching a strong support, WYNN shows a great dip buy opportunity for a potential 45% return

Great Dip Buy opportunity on FB for 15%+ ReturnFB is currently an undervalued stock with a great dip buy opportunity for a potential 15%+ return.

Great Buy with FISV for potential 10%+ ReturnFISV offers a great dip buy opportunity for a minimum 10% return. FISV has been on a strong upward trend for the past several years and will continue on this trend because of solid fundamentals.

StockMarket Update : Weekly Range Context Validated (brutaly)Hope this idea will inspire some of you !
Don't forget to hit the like/follow button if you feel like this post deserves it ;)
That's the best way to support me and help pushing this content to other users.
Kindly,
Phil

$NMC huge volume before earnings$NMC (NMC Health PLC ORD) huge increase on volume. Earnings report next week. Expecting big moves soon.

S&P 500 and Recession?Though it seems like we're currently in correction wave A and would like to stay neutral short to mid-term until confirmed wave 1 appears, the gap and bearish engulfing candle make it seem like the slide will continue earlier than expected within Q1 -- or maybe it will suddenly "recover" fast by next week, depends on the whales tbh, but lemme know your thoughts down the comments below.
Anyway just sharing an interesting pattern in S&P 500 coinciding with the major downturns in the market and recessions in the past, and might interest those who want to "time" the markets.
As mentioned in my trading blog, ceteris paribus, overall I'm bearish in the markets in the next decade or so considering the stagnant growth of world economies. The only thing that can push that up is if we're finally able to start mining in space and utilize AI technology while "smoothly" transitioning displaced human workers into more relevant roles.
Guideline:
SELL
- divergence in RSI and chart on -61.8 fib or higher (-61.8 becomes new 0 fib) and RSI above 70 for sell
- sell up to around 0 fib of prior period and RSI below 30 (then soft buy-soft sell) OR
- sell up to near -61.8 of current period (if there is prior bearish period & fib) or -100 of current period (if bearish reversal)
SOFT BUY
- RSI below 30
- price below -38.2 fib of prior period
- buy up to near -61.8 of current period
SOFT SELL
- 2nd RSI above 70
- price above -38.2 fib of current period (if prior fib is also bullish) or near -100 fib
- sell up to near 0 fib of current period
BUY
- divergence in RSI and chart on 0 (-61.8 fib or higher of prior bullish period) and RSI below 30 for buy
- buy up to around -100 fib of prior period and RSI above 70 (then soft sell-soft buyl) OR
- buy up to near -61.8 of current period (if there is prior bullish period & fib) or -100 of current period (if bullish reversal)
SOFT SELL
- RSI above 70
- price below -38.2 fib of current period
- sell up to near -61.8 of prior period
SOFT BUY
- 2nd RSI below 30
- price at 0 fib of current period
- sell above -38.2 fib of current period
Rules:
1. For reversals, plot fibonacci either from prior period -100 or -61.8 fib level (depending on where price is nearest) down to prior period 0 fibonacci level
2. If price continues to trend up or down, way past the -100 fibonacci level, plot that as new 0 fibonacci level and add a hype icon (champagne glass or caution)
3. RSI is set at 10-70-30 on the weekly chart only

Nasdaq/SP500 spread: one more the bubble signalWe have repeatedly written about various signals that testify in favor of the presence of a huge bubble in the US stock market: this is a rise in market prices, divorced from the economy, which manifests itself in the historical highs of the "favorite Buffett indicator", these are the values of the basic investment multiples in the zones exorbitant overvaluation, this is the dynamics of CAPE Schiller and much more.
Today we’ll talk about another interesting and significant metric. It's about the Nasdaq/SP500 spread. In fact, we are talking about the difference in the growth rate of the Nasdaq and SP500. Since these are indices of the same stock market (USA), in a theory they should change more or less synchronously. But the experience of the dot-com bubble has shown that there are times when one index begins to overtake another.
For example, in the case of the dotcom bubble, the spread between the indices was 200%, that is, the high-tech sector grew 2 times faster than the US stock market as a whole. How it all ended, we think everyone knows. Just in case, recall that the Nasdaq index then lost about 80%.
The dotcom bubble is considered a classic illustration of market insanity.
What is the situation now? Currently, the spread between the Nasdaq and the SP500 is 500%! That is, we have a situation that, in terms of the scale of madness, exceeds that which was on the eve of the collapse of the dot-com bubble 2.5 times!
The historical analogy is obvious: the current bubble has long been in the terminal stage and should burst. Whether this will happen here and now, or will it begin after some time - the question is still open. But the presence of the largest bubble in the history of the US stock market can be ascertained here and now.
Recall that we consider 2019 the last year of unjustified growth in the US stock market. Already in 2020, it will begin to adjust. The scale of correction is from 50% and higher. Considering that in recent years, shares of technology companies in the US stock market have grown on average 7-8 times (and some issuers have shown growth of 10 or even 20 times), the US stock market will no doubt become the object of massive sales. We recommend participating in this process, selling both the market as a whole (Nasdaq index) and the shares of individual issuers (Apple, Microsoft, Alphabet, Oracle, etc.).

S&P500 gets its pullback? Possible reversal trendlines - The SPX500 index has had a 9.7% sell off for the past week. Looking back at the chart's history (avoiding recessions) these sells offs usually range from 8% to 12% before they pullback or reverse trends back to bullish.
- - The purple trend lines show relevant prices where there could be a pull back or reversal within the sell of percent range that we've seen before and the green trend line is where im most expecting it to pullback.
- - - Should the price reach the lowest purple trend line, this would be 17% sell off. This would be a nearly identical trend seen recently between December 03, 2019 and December 25, 2019 where price dropped 17.5% before changing to the bullish trend.
IMPORTANT: There are small signs of Divergence between RSI and Price chart but ZERO signs of divergence on the Daily chart. Watch for what Time Frame has the clearer sign of Divergence to know the magnitude of the pullback.
Below is a ling of a my previous Idea on SPX500 showing the type of Clear Divergence.

SPX500 Short. RSI Divergence and RSI TrendlinesTake a lok at the divergence btween the RSI and Price charts with its recent highs. There's also the Trend lines on the RSI that are testing below the Resistance trend hopefully will be a long term hold as the SPX needs to take a damn break.
RSIRSIRSIRSIRSIRSIRSIRSIRSIRSISIRSIRSIRS

DOW -WaveTalks - Cracks 1900 points / Nifty - Ab tera kya hoga ?WaveTalks - DOW -Cracks 1900 points in 2 days / Nifty - Ab tera kya hoga ?
Welcome you all in the exciting update on WaveTalks !!!
As per the idea published on 12th Jan 2020 - Nifty : Stellium Effect (Stellium - Astro term)
Have Suggested Dow close to a primary top on 17th Jan 2020 & India Nifty made a top next week on 20th Jan 2020 - Looking for a fall close from 29500 which is psychological level update in later videos - just broke the channel convinced all bulls nothing is wrong & revisited - made new high above 29500 - Here's a catch !
Penultimate waves always have painful end. Time & again it has proved correctly - This time wasn't any surprise !
As usual Bulls convince themselves nothing is wrong & bears get excited but unfortunately market never listens anyone be it a bull or a bear - it just does what it likes the best!!! - Don't trade with emotions else you are calling for trouble.
Most Important clue suggested for proposed India Nifty Fall from channel top at 12350-12450 are mentioned below
DJIA - Dow Jones Industrial Average
Dollar Rupee - Expected move above 70.50 for 72.25 & above 72.50 for 74.50+
Nifty - Ab tera kya hoga ??? ( I still suggest don't be a bull neither a bear -never get excited in trades - control your emotions & trade what market tells you )
13th Jan 2020 - Dow Jones
25th Feb 2020 - Dow at 27081
10th Jan 2020 - Dollar Rupee Expected to fall on smooth talks post Geo-political tension between U.S. & Iran - meanwhile -both Global Markets & Indian markets rallied for new highs. India Nifty rallied from 11930 to 12375-12430- where caution was already suggested as channel top.
Nifty - Ab Tera Kya Hoga ???
Check the TradingView profile page for previous ideas at in.tradingview.com
Thanks for reading the update, your precious time & be careful in trading - don't listen anyone -neither bulls nor bears only practice hearing what price talks.

About inevitability of the bear market correctionThe bull market, which began to form in the US stock market since 2009, officially became the longest in history (lasting 126 months). Yes, on the way to this great growth, there were problems such as the 2011 flash crash of braking in 2015-2016 and a large decrease in 2018. But all these difficulties were successfully overcome and prices stubbornly continued to climb up.
Investors and traders are accustomed to such a state and rising prices in the market have become familiar to them, one might say, a natural state. But nothing lasts forever. Each time, history proves that growth always replaces decline. And the belief that “this time everything will be different” is refuted each time by reality.
One of the reasons for the rampant growth of the US stock market was the country's economic growth. The result of growth, in particular, was a decrease in unemployment to 1969. It would seem that this is an occasion for optimism and continued purchases in the stock market. But the situation is actually quite ambiguous.
The departure of the unemployment rate below naturally suggests that the economy has practically lost reserves for further growth and, all the more, its acceleration (companies simply have nowhere to take labor to expand their activities).
But even more interesting is the fact that low unemployment has historically meant low returns on the US stock market. For example, Mark Hulbert showed that on average over the past 100 years, the minimum yield on the US stock market was recorded during periods when the unemployment rate fell below 4.4%. At the same time, maximum profitability was during periods when unemployment exceeded 7%.
Why did this happen? One of the explanations for low unemployment leads to increased price competition among employers for labor, which leads to higher wages, which in turn spins the inflationary spiral, which forces the Fed to act and raise rates. An increase in the rate is a signal and a reason for the overheated stock market to decline. High unemployment, on the contrary, stimulates the Fed to lower rates and causes the stock market to grow.
Thus, purely statistically current conditions are ideal for inhibiting US stock market growth. At the same time, given that in recent years it has shown strong growth, reaching average values for the current unemployment rate will be possible only with an even stronger decline in stock prices.
Recall that we consider 2019 the last year of unjustified growth in the US stock market. Already in 2020, it will begin to adjust. The scale of correction is from 50% and higher. Given that in recent years, shares of technology companies in the US stock market have grown by an average of 7-8 times (and some issuers have shown growth of 10 or even 20 times), the US stock market will no doubt become the object of massive sales. We recommend participating in this process, selling both the market as a whole (Nasdaq index) and the shares of individual issuers (Apple, Microsoft, Alphabet, Oracle, etc.).

$MTSC (MTS Systems Corp) Support$MTSC (MTS Systems Corp) at support area with bullish divergence with MACD. Daily chart

What does science say about a future recession?This week we witnessed another inversion of the yield curve in the United States. This time, the yield on 10-year treasury bonds fell below the yield on 3-month bonds. The situation is not entirely normal from the point of view of common economic sense: long-term bonds should generate greater returns than short-term ones in order to take into account the risk premium and uncertainty, as well as the value of money over time.
Recall that the inversion of the revenue curve usually occurs on the eve of the recession. We also note that the inversion of the yield curve we observed back in 2019. That is, warning signals are more than enough. An important nuance is the presence of a time lag between the appearance of the signal (inversion of the yield curve) and its development (the beginning of a recession in the economy).
This time, the inversion of the yield curve is associated with fears due to the coronavirus epidemic.
But today we’ll talk not only about the predictive abilities of the inversion of the yield curve but also about the study of MIT scientists and economists who, based on the original econometric model, see the risk of a recession in the USA in the foreseeable future.
The model is based on four variables: industrial production, NFP, stock market price dynamics, and the yield curve. Analyzing the data for the last 100 years, scientists came to the conclusion that the index calculated on the basis of these indicators is a good indicator of the onset of a recession.
Each time the index value exceeded 70%, the likelihood of a recession over the next 6 months increased to 70%. So back in November 2019, the index value exceeded 76%. That is, in the near future, the US economy has significant chances to face serious difficulties. Even the probability of this event is calculated - more than 70%.
It is not necessary to speak purely formally about the recession in the United States here and now if only because in order to state the fact of its occurrence, it is necessary to reduce GDP for two consecutive quarters. But once again we note that a critical mass of problems has already been accumulated and the coronavirus epidemic is an ideal trigger for their materialization.
In total, there are more and more signals in favor of the worsening situation in the global economy in general and the USA in particular. This will inevitably lead to massive sales in the stock markets.
Recall that we consider 2019 the last year of unjustified growth in the US stock market. Already in 2020, it will begin to adjust. The scale of correction is from 50% and higher. Given that in recent years, shares of technology companies in the US stock market have grown by an average of 7-8 times (and some issuers have shown growth of 10 or even 20 times), the US stock market will no doubt become the object of massive sales. We recommend participating in this process, selling both the market as a whole (Nasdaq index) and the shares of individual issuers (Apple, Microsoft, Alphabet, Oracle, etc.).

The yen could not stand it, investors relaxed againYesterday was the day of reckoning for the Japanese yen. We already wrote this week about the failure in the country's economy, but we perceived the lack of reaction of the foreign exchange market as the general inability of the yen to fall due to increased demand for safe-haven assets (see the dynamics of gold prices).
As yesterday showed, we were wrong. The markets harbored a strong grudge against the yen, but they lacked reason. After another wave of optimism arose in connection with the improvement of the epidemiological situation and measures to stimulate the economy from China, the yen strongly recalled everything.
How deservedly the Japanese currency has suffered is a moot point, but the fact remains that the yen lost a lot yesterday. Although, again, in terms of facts, then 2,000 deaths (+136 new) and 75,000 (+1872 new) cases of infection are no reason for optimism to grow. But the yen was sold, and US stock indexes updated another historic high.
What is happening in the financial markets continues to be puzzling, because, looking at the dynamics of gold, there is a feeling that investors are worried about the coronavirus and its consequences, but an analysis of the yen and US stock index charts suggests that the epidemic is a definite plus for the world economies and a reason for purchases even in excess of overbought assets.
Meanwhile, inflation in the UK, USA, and Canada was above forecasts. This, by and large, was to be expected: it is impossible to inflate markets with money without consequences for years - sooner or later the time of reckoning will come. It is likely that we have the first signals.
Just in case, we note that central banks will be required to respond to rising inflation. They will do this by curtailing the operations of quantitative easing and other cash injections, for example, in the repo market, as well as by raising rates.
Rising rates will provoke a chain reaction in the economy and lead to the collapse of bubbles. If 3 years ago, the Fed clearly hoped to gradually blow out a bubble in the US stock market, now it has clearly given up on this hand. That is, the explosion will be very loud. However, so far the markets do not care about this, but now they do not care. I do not care that Apple will fail the first quarter in financial results, that Adida’s economic activity in China has fallen by 85%, that the head of the IMF calls coronavirus the main threat to the global economy, as well as hundreds and thousands of other facts.
Going against such a train is generally ungrateful. But to buy Nasdaq above 9700 with such a fundamental background, the hand categorically does not rise. Perhaps the only option to save the rest of common sense in trading and not to merge the deposit is intraday trading with hard stops.
So today we will sell oil, USDJPY and EURUSD pairs, buy GBPUSD with small stops, and also look for opportunities for buying gold.

$HPR Support$HPR (HighPoint resources Corporation) bouncing at support with a bullish engufling candle. MACD bullish cross and green bar on its histogram.

The Final Phase Of The Bull Market Begins (Fractal Update)My previous posts on this subject were much longer, but I'll keep this short and sweet. You can check out my other posts (linked below) for more in-depth analysis and my overall perspective.
I actually DID NOT want to see the stock market continue up here. It's just further confirmation that we're still following this fractal from 1929. I drew the yellow speculative line a while ago, showing that if we continue up from here, we can indeed reach as high as 40-50,000, even by Fall 2020, when we could also hit the long term channel resistance (red). It's interesting that this may easily coincide with the U.S. Presidential election.
This, I believe, is a seller's rally. I expect the DJI to eventually AT LEAST test the long term trendline (purple) and the 200 Month Moving Average (light blue). A catastrophic financial collapse could result in the loss of the long term trendline and a decline just as severe as the Great Depression. The technical setup is there for this to happen, but the question is: What are the underlying similarities and the warning signs that have led to such similar market behavior? Feel free to discuss.
Here's a closer view and comparison. You can see certain features marked for structural comparison:
Anyway, this is not financial advice. As always, my posts are speculative and based purely upon my own opinions and observations.
-Victor Cobra

Bond Market Records - An Alarm For Stock BuyersAccording to the Bank of America Global Research, a historic event took place last week - a weekly inflow of funds to the bond market amounted to $23.6 billion. There has never been more money to the bond market in a week. If the situation develops in a similar vein, then by the end of the year the bond market may add another $1 trillion to the existing $10 trillion.
What is this news talking about? That investors are starting a global repositioning of assets - from volatile and high-risk stocks to more stable bond markets. They can be understood - the global economy is in real danger, and at the time of crises, stock markets are the most affected, but it is bond markets that show the maximum yield.
We give data on the latest major crises.
- crisis of 1980-82 (global economic crisis): return on the stock market amounted to (-16.52%), on the bond market + 21.61%;
- the crisis of 2001-2002 (dot-com bubble): the yield on the stock market was (-38.87%), on the bond market + 15.82%;
- the crisis of 2007-2209 (global financial crisis): the yield on the stock market was (-50.95%), on the bond market + 6.08%.
These figures are not confidential and professional investors are well aware of the specifics of the behavior of stock and bond markets in times of crisis. That is, a sharp influx of funds into the bond market suggests that rats are increasingly starting to flee the ship. By ship, of course, we mean the stock market.
Despite the fact that the Central Banks continue to pump money (since September 2019, the Central Banks poured about $ 800 billion into financial markets), as well as the era of ultra-low interest rates, capital flows are increasingly reaching the stock market.
"The last fool" will buy the latest shares, while power in the stock market will pass to sellers. The insider information from Bank of America also speaks in favor of this: their private clients continue to "quietly" sell out shares and buy bonds. In 2019, there was an outflow of funds from Bank of America customers from the stock market (worth about $ 200 billion), and according to forecasts for 2020, the trend will intensify. At the same time, investments in bonds continue to show a steady increase since 2015.
Recall that we consider 2019 the last year of unjustified growth in the US stock market. Already in 2020, it will begin to adjust. The scale of correction is from 50% and higher. Given that in recent years, shares of technology companies in the US stock market have grown by an average of 7-8 times (and some issuers have shown growth of 10 or even 20 times), the US stock market will no doubt become the object of massive sales. We recommend participating in this process, selling both the market as a whole (Nasdaq index) and the shares of individual issuers (Apple, Microsoft, Alphabet, Oracle, etc.).

BP Plc (BP.) Close To Key Support Level
BP is steadily going down.
the market is coiling within a falling parallel channel and it looks like 440 level will be reached soon.
analyzing the structure on the left we can see how important this level is for the market participants.
for this reason, we can expect with you a bullish reaction from this level.
our initial target will be the resistance of the rising channel
and our second target will be extended to 486 level.
good luck!
please, support the idea with like! thank you!
