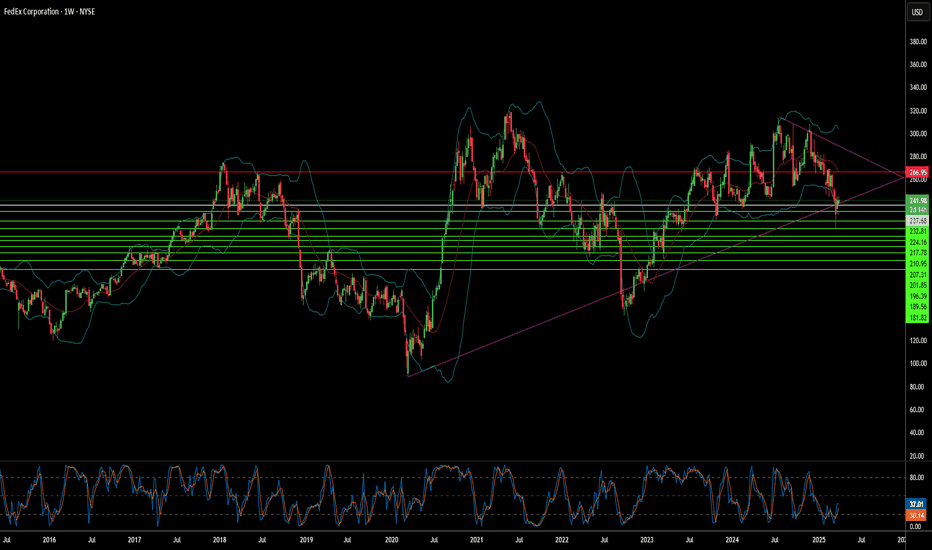
FedEx: Balancing Act or Precarious Gamble?Recent market activity highlights significant pressure on FedEx, as the logistics giant grapples with prevailing economic uncertainty. A notable drop in its stock price followed the company's decision to lower its revenue and profit outlook for fiscal year 2025. Management attributes this revision to weakening shipping demand, particularly in the crucial business-to-business sector, stemming from softness in the US industrial economy and persistent inflationary pressures. This development reflects broader economic concerns that are also impacting consumer spending and prompting caution across the corporate landscape.
In response to these domestic headwinds, FedEx has adopted a more conservative operational stance, evidenced by a reduced planned capital spending for the upcoming fiscal year. This move signals an emphasis on cost management and efficiency as the company navigates the current economic climate within its established markets. It suggests a strategic adjustment to align spending with the revised, more cautious revenue expectations.
However, this domestic caution contrasts sharply with FedEx's concurrent and ambitious expansion strategy in China. Despite geopolitical complexities, the company is making substantial investments to enlarge its footprint, building new operational centers, upgrading existing gateways, and increasing flight frequencies to enhance connectivity. This dual approach underscores the central challenge facing FedEx: balancing immediate economic pressures and operational adjustments at home while pursuing a long-term, high-stakes growth initiative in a critical international market, all within an uncertain global environment.
Stockprice
CAT, Formed EXPLOSIVE BULL-FLAG-BREAKOUT, Extension Prevails!Hello There!
Welcome to my new analysis about CAT Stock Price Action Analysis on the Weekly Timeframe Perspectives. The CAT Price Action recently showed up with a highly important dynamic and in this case a major formation has been formed that caught my attention. The CAT earnings through the recent quarters look pretty damn solid and the equity-to-debt ratio held stable through the recent quarters indicating a substantially fundamental base from where CAT has a strong potential to be backed from a financial market investors open-interest perspective. While other sector stocks showed up with pullbacks CAT moved on to form new highs. Such dynamics are pointing to a interesting stock price-action dynamic that should be considered in the schedule.
When looking at my chart now I have marked there this huge bull-flag-formation which CAT has built during the last times. Within this formation CAT moved on to form a new higher high exceeding the previous one into an all time high as well as several higher lows that supported the bull-flag-formation to be completed with the breakout above the upper boundary. CAT also bounced several times within the 65-EMA in blue and the 25-SMA in green building substantial support-structures in combination with the main ascending-trend-line. The wave-count within the bull-flag-formation has been completed appropriately and from there on the final breakout above the upper-boundary has been validated by the bullish volume.
The major formation that CAT recently completed here has now activated the upper target-zones as marked in the chart together with the major wave-C to emerge out of the breakout-origin. The fact that the waves A and B have already completed give the breakout and wave-C extension a fundamental base for the expansion to show up within the next times. The setup and indications that CAT provided here are delicate for an main positioning into the bullish direction and it has to be remarked that not every stock is showing such concrete factors into the appropriate direction this is why CAT is a main considerable stock-pick that we will keep following on the watchlist.
Within the near terms a final setup-determination above the upper-boundary of the formation as seen in my chart is likely and from there on the wave-C expansion-wave will determine to reach out the upper-target-zones. Once the zones have been reached further assumptions need to be made. Especially a continued healthy equity management of the company can support the bullish case massively.
In this manner, thank you everybody for watching the analysis, support from your side is greatly appreciated.
VP
What Makes Stock Prices Go Up & Down? What Makes Stock Prices Go Up & Down?
━━━━━━━━━━━━━
There are many factors that determine whether stock prices rise or fall. These include the media, the opinions of well-known investors, natural disasters, political and social unrest, risk, supply and demand, and the lack of or abundance of suitable alternatives. The compilation of these factors, plus all relevant information that has been disseminated, creates a certain type of sentiment (i.e. bullish and bearish) and a corresponding number of buyers and sellers. If there are more sellers than buyers, stock prices will tend to fall. Conversely, when there are more buyers than sellers, stock prices tend to rise.
━━━━━━━━━━━━━
In Regards to trading Tesla StockFirst off, please don't take anything I say seriously or as financial advice. As always, this is on opinion basis. That being said, let me collectively analyze my thoughts. Tesla's stock fluctuations are partly due to spread as well as analyst activity. However, over time, price correlations are stable. It obviously performed quite well as a long term hold stock. That being said, currently the most profitable way to make money with Tesla stock is likely day trading. The long term strategies barely have any growth potential in comparison to active day trading and buy and sell targets. This just proves it.


