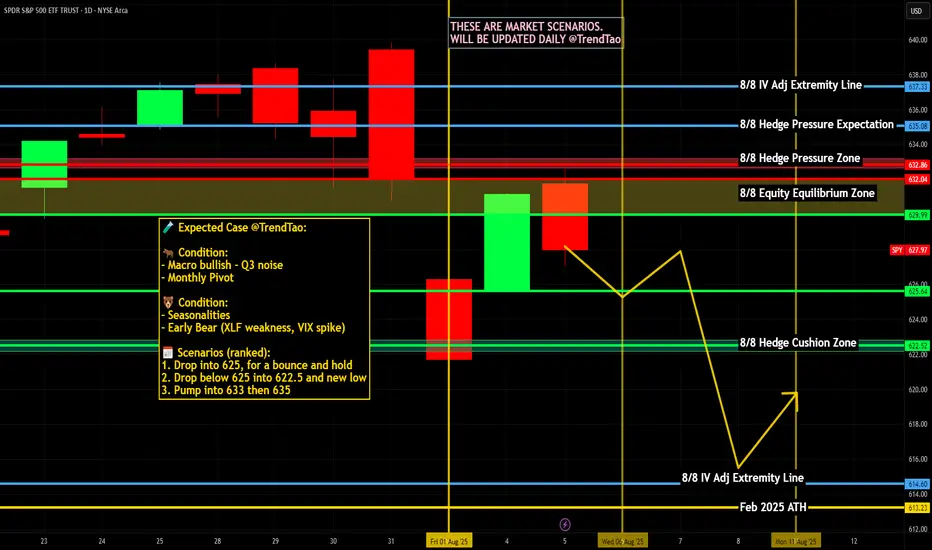
Nightly $SPY / $SPX Scenarios for August 7, 2025🔮 Nightly AMEX:SPY / SP:SPX Scenarios for August 7, 2025 🔮
🌍 Market‑Moving News 🌍
📦 Major Tariffs Implemented Today
Sweeping tariffs ranging from 10% to over 40% officially took effect today on imports from numerous countries, significantly escalating global trade tensions. Markets are closely tracking initial reactions across affected sectors, especially pharmaceuticals and semiconductors.
💻 Semiconductor Tariff Shakes Tech Sector
President Trump introduced a substantial 100% tariff on semiconductor imports, with notable exemptions for U.S. investors such as Apple, Nvidia, and AMD. Apple shares surged 5.1% amid investor optimism, while broader tech stocks saw mixed reactions.
🚀 Firefly Aerospace IPO Debut
Firefly Aerospace launched its IPO today, pricing shares at $45. The stock began trading on Nasdaq under ticker "FLY," attracting significant attention due to its positioning in the space and defense technology sector.
📊 Key Data Releases & Events 📊
📅 Thursday, August 7, 2025:
8:30 AM ET – Initial Jobless Claims (week ending Aug 2)
Forecast: 221,000
Previous: 218,000
8:30 AM ET – U.S. Productivity (Q2)
Forecast: 1.9%
Previous: –1.5%
8:30 AM ET – U.S. Unit Labor Costs (Q2)
Forecast: 1.3%
Previous: 6.6%
10:00 AM ET – Wholesale Inventories (June)
Forecast: N/A
Previous: –0.3%
10:00 AM ET – Speech by Atlanta Fed President Raphael Bostic
Topic: Monetary policy outlook; market-sensitive for potential Fed signals.
3:00 PM ET – Consumer Credit (June)
Forecast: N/A
Previous: $5.1B
⚠️ Disclaimer:
This content is for educational and informational use only and is not financial advice. Always consult a licensed financial advisor before making investment decisions.
📌 #trading #stockmarket #economy #tech #earnings #IPO #Fed #tariffs #semiconductors
Stocks
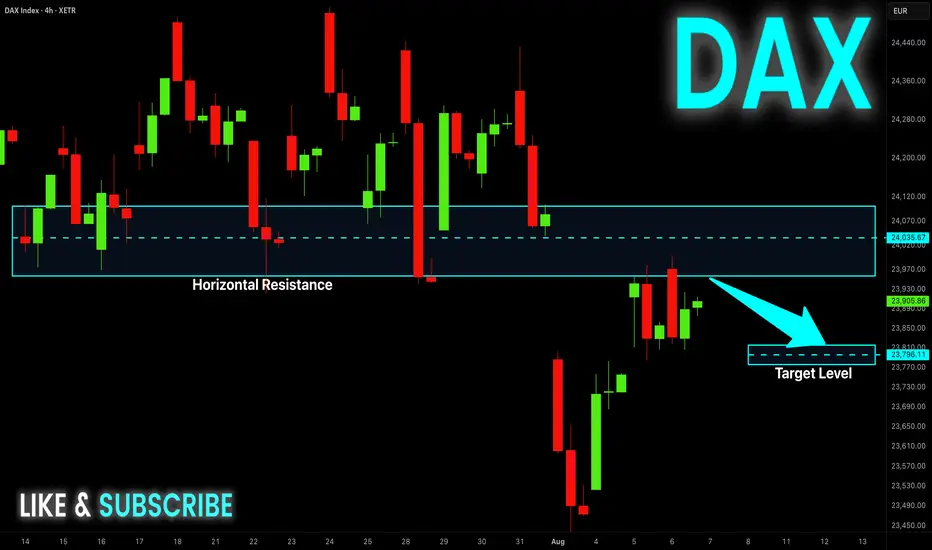
DAX Potential Short! Sell!
Hello,Traders!
DAX went up nicely
But is now about to hit
A horizontal resistance
Around 24,000 so after
The retest we will be
Expecting a local pullback
Sell!
Comment and subscribe to help us grow!
Check out other forecasts below too!
Disclosure: I am part of Trade Nation's Influencer program and receive a monthly fee for using their TradingView charts in my analysis.
S&P500: Stocks and Tariff, what is next?US indices were bullish so far despite the NEW HUGE tariffs. As the tariffs become in play by Aug 1st, we shall see its effect in Q3 results, Q2 earnings beats, but will Q3 do ?
Disclaimer: This content is NOT a financial advise, it is for educational purpose only.

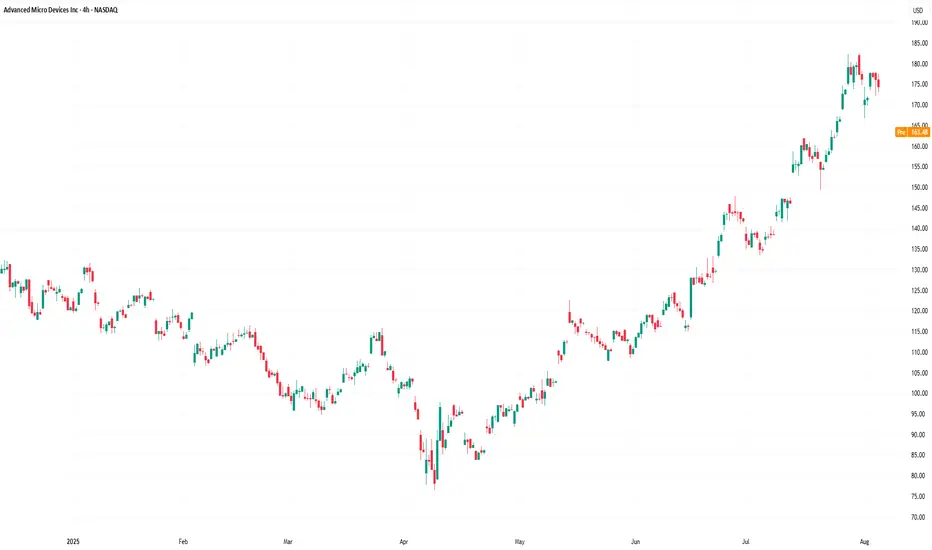
AMD Shares Decline Despite Strong Earnings ReportAMD Shares Decline Despite Strong Earnings Report
Yesterday, following the close of the stock market, Advanced Micro Devices released a strong quarterly earnings report:
→ Earnings per share came in at $0.48 (roughly in line with forecasts);
→ Revenue reached $7.68 billion (versus expectations of $7.41 billion).
At the same time, CEO Lisa Su stated: “We’re well positioned to deliver significant growth in the second half.”
However, despite the solid performance and optimistic outlook, AMD shares declined in after-hours trading, falling below $165.
The decline in AMD’s share price following a strong report may be attributed to excessively high expectations and the stock's overbought condition ahead of the announcement.
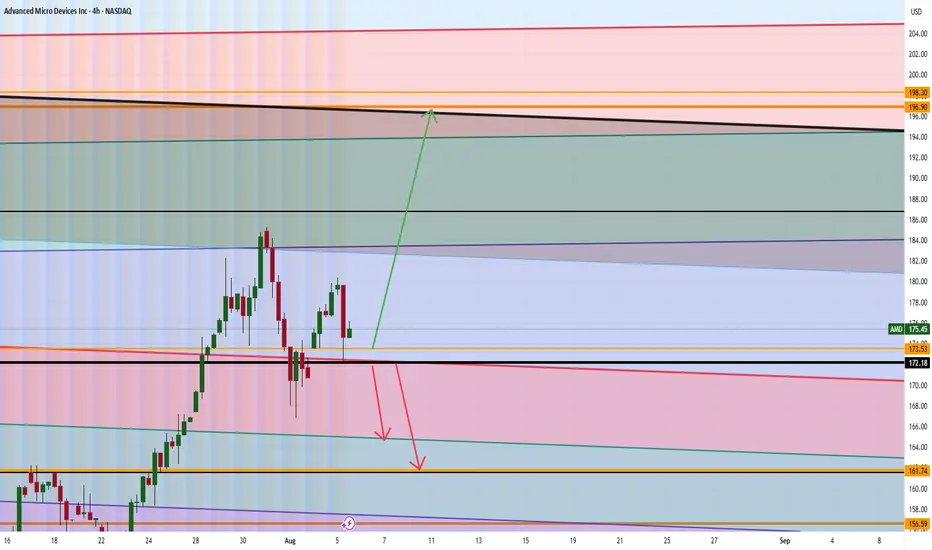
Technical Analysis of the AMD Stock Chart
Since April 2025, price fluctuations have formed an ascending channel (highlighted in blue). In July:
→ the price broke above the upper boundary of this channel, moving sharply higher (marked in purple);
→ the RSI indicator remained above the 50 level throughout.
We can assume that investors were following the meteoric rise of Nvidia (NVDA) shares and were betting that the ongoing AI boom would enable AMD to deliver extraordinary results. However, these hopes were not fully realised — the classic case of "buy the rumour, sell the fact".
As a result, AMD shares may open today with a bearish gap. From a technical standpoint, this suggests that the price is returning to the limits of the blue ascending channel, where the midline and lower boundary may act as support levels. The psychological support level at $150 also appears significant.
This move may be interpreted as a correction — and once the excessive optimism accumulated in July dissipates, bulls may attempt to resume the upward trend, supported by fundamentally strong data.
This article represents the opinion of the Companies operating under the FXOpen brand only. It is not to be construed as an offer, solicitation, or recommendation with respect to products and services provided by the Companies operating under the FXOpen brand, nor is it to be considered financial advice.
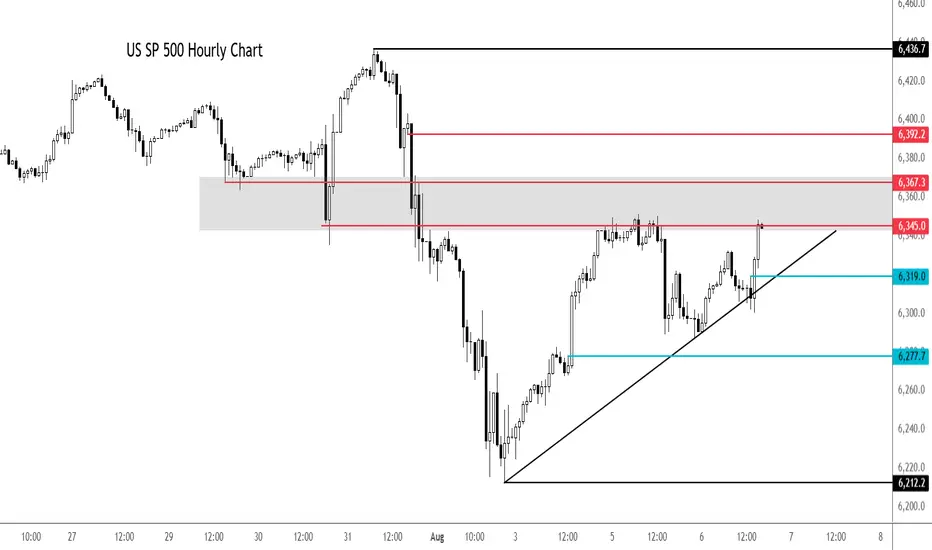
S&P 500 extends rally despite macro concernsThe 5% Apple rally aside, it is all about rate cut bets vs. strong earnings. So far, the latter has helped to keep US markets supported near all-time highs. But if macro concerns increase further, investors' perception about future earnings growth will weaken. And with that, we could see some cracks in expensive stocks.
Looking at the hourly chart of the SPX500, the US benchmark was testing a potential resistance zone in the shaded region between 6345 to 6367, an area which was previously support. Above this zone, 6392 is the next level of potential resistance and then the all-time high of 6436 comes into focus next.
earlier, the index bounced after a failed breakdown below the trend line shown on the chart. Another potential test of the trendline could see the index break lower. Short-term support is seen around 6319 then 6277.
By Fawad Razaqzada, market analyst with FOREX.com
Nightly $SPY / $SPX Scenarios for August 8, 2025🔮 Nightly AMEX:SPY / SP:SPX Scenarios for August 8, 2025 🔮
🌍 Market-Moving News 🌍
🧾 Tariff Shock → Day 2 Positioning
Markets are still digesting the new tariff regime (10%–41% on broad imports) and the proposed 100% levy on imported semiconductors with carve-outs for firms investing in U.S. production. Expect continued dispersion: U.S.-capex-heavy names bid; globally exposed hardware, autos, and consumer electronics face margin risk until rules are clarified.
💬 Policy Signaling Risk
Fed speakers are leaning cautious on growth and inflation pass-through from tariffs; Bostic flagged skepticism that tariff-driven price effects fade quickly. Translation: don’t count on a rapid dovish pivot because of tariffs alone.
⛽ Energy & Positioning Into the Weekend
Oil beta in focus: Baker Hughes U.S. rig count (1:00 pm ET) and CFTC COT (3:30 pm ET) hit this afternoon—both can nudge energy, USD, and risk appetite into the close.
📊 Key Data Releases & Events 📊
📅 Friday, August 8, 2025
10:20 AM ET – St. Louis Fed President Alberto Musalem (remarks)
Market angle: watch for any tariff-inflation commentary and guidance on the path/timing of cuts.
1:00 PM ET – Baker Hughes U.S. Rig Count
Reads on drilling activity; oil services beta and crude sentiment.
3:30 PM ET – CFTC Commitments of Traders (weekly)
Positioning update across futures/FX; risk heading into next week.
(No major Tier-1 U.S. macro prints scheduled today; next CPI is Tuesday, Aug 12.)
Bureau of Labor Statistics
⚠️ Disclaimer:
Educational info only, not financial advice. Do your own research.
📌 #trading #stockmarket #economy #Fed #tariffs #chips #energy #rigcount #COT
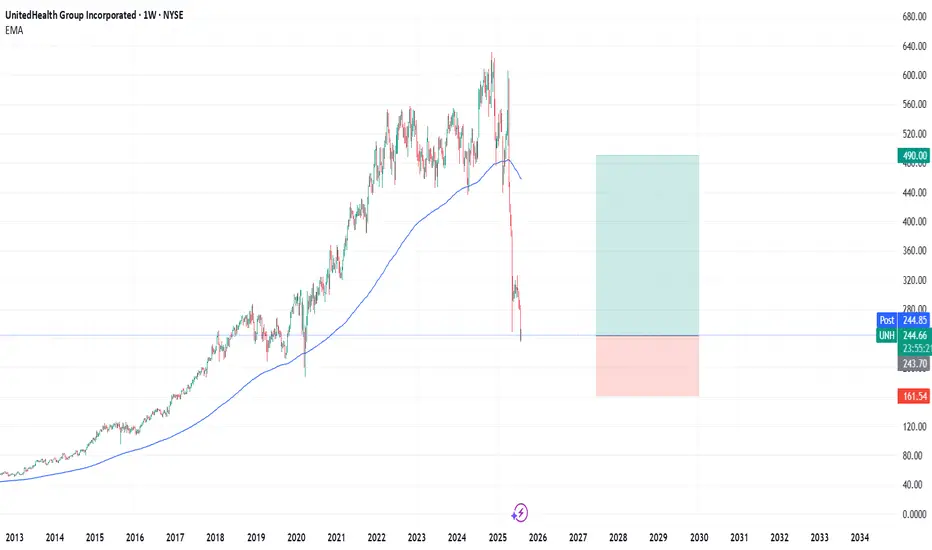
UNH : Stubborn is my First Name Hello friends,
While stubbornness and determination are very different concepts, "stubborn" is more meaningful for events whose outcome we cannot predict.
1- First of all, hedge amount for this trade should be allocated to very safe and more stable financial instruments, at least 6-7 times the position size of this trade.
2- This idea is a continuation of my opinion regarding UNH.
3- I defend the following general view:
This was a situation I carefully considered and formulated (holding UNH shares for the medium term).
Therefore, a price drop will not change my opinion in any way.
Increased costs are mentioned for some items, but their share of stock revenue is not stated.
4- Still valuable Risk/Reward Ratio
5 - Reasonable P/E Ratio and financials
Let's not forget item 1, because it will be necessary in three situations:
a- A major financial collapse in the stock
b- A global economic crisis.
c- Even if these are not the case, a gradual buyback (total x amount pos size) at 215 and 200
Parameters (for People who dont want to hold) :
Risk/Reward Ratio : 3.00
Stop-Loss : 161.54
Take-Profit Point : 490.00
Best Regards.
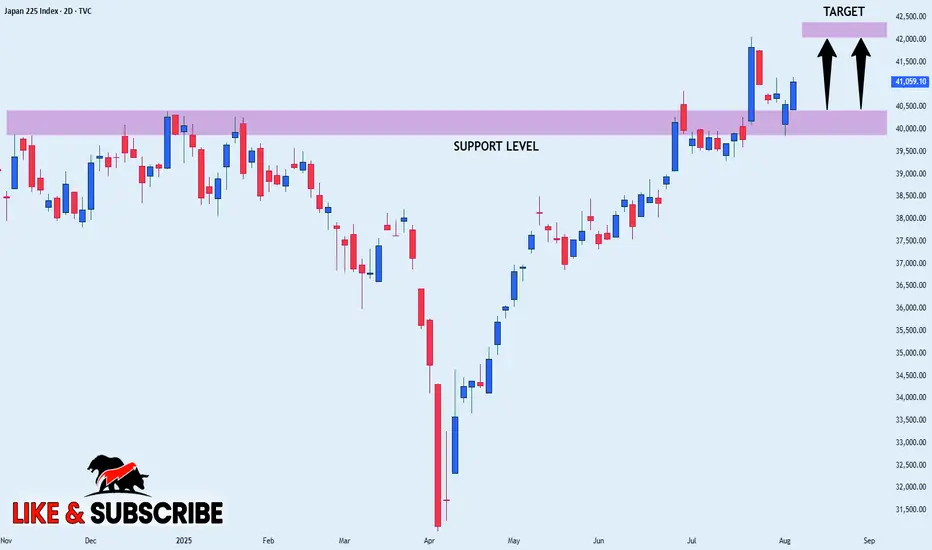
NIKKEI WILL KEEP GROWING|LONG|
✅NIKKEI is trading in an uptrend
And the index was making a bearish correction
But it has now retested a horizontal support level of 40,500
From where we are already seeing a bullish
Reaction and I am expecting the index to go further up
LONG🚀
✅Like and subscribe to never miss a new idea!✅
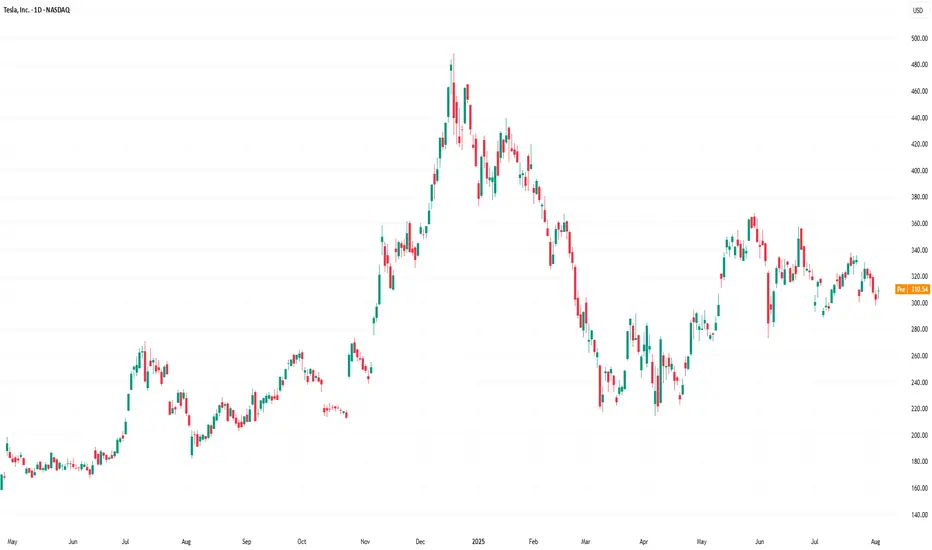
Tesla Breakout? For the majority of the calendar year TESLA has been in a range between $220 - $365 with a clear midpoint of $295.
From March to the beginning of May TESLA bounced between range low and the midpoint until finally breaking through into the upper half of the range where it has stayed ever since. However, there is a clear diagonal resistance level that is preventing higher highs.
So will TESLA breakout, or will it lose the midpoint? Structurally it is clear that the bulls have a set level they are happy to buy at (Midpoint) but the bears are getting more aggressive with their selling, hence the lower highs. This compression inevitably leads to an impulse move but the direction is not so clear.
Bullish scenario: A clean breakout with volume that makes a new higher high, signaling a shift in structure. A pullback and retest of the breakout would be an ideal opportunity to go long and aim for that range high before expecting resistance.
Bearish scenario: The lower highs keep printing until the midpoint is lost and price accepts below it, that would then signify to me the new trading range is between Range Low and Midpoint.
The fakeout scenario is a risk but with price so close to the midpoint already it follows the same invalidation criteria as the bullish scenario, the midpoint is vital to both sides.

3rd Wave About to Start in Ingersoll Rand (IR)Good looking Elliott Wave setup in NYSE:IR
Stock rose in clean 5 waves impulse wave followed by 3 waves down in ABC to almost exactly at 61.8% level around 75. If the wave C low 73.87 holds then we can expect another 5 wave rise in larger (3) or (C) on the upside. As per wave equality principle, we can expect it to be same in size as the previous 5-wave rise seen in the chart. That gives a potential target of 98.7 for current levels. 1.618 times of the move is at 114.04 which could be second (extended) target.
Note that invalidation level for this setup is wave C low at 73.87.

ADBE LONGThis trade has reached the yearly low of 335 showing that there will be strong level of support.
It is against the trend however there is a bat pattern on H4 and daily
There is a double bottom on M30 and H1 showing divergence.
Stop loss below 333

Nightly $SPY / $SPX Scenarios for August 6, 2025🔮 Nightly AMEX:SPY / SP:SPX Scenarios for August 6, 2025 🔮
🌍 Market‑Moving News 🌍
🪙 Citi Lifts Gold Price Forecast Amid Global Uncertainty
Citi raised its short-term gold outlook to $3,500/oz, citing surging safe-haven demand driven by trade instability, softening labor metrics, and heightened geopolitical risk. Risk premiums and volatility remain elevated.
📉 Equities Tumble as Risk Aversion Returns
U.S. stocks slipped on renewed caution—investors rotated into bonds and precious metals following weaker job indicators and escalating trade friction. The dollar and gold strengthened, while equity futures pulled back.
📊 Key Data Releases & Events 📊
📅 Wednesday, August 6:
No major U.S. economic data releases scheduled for today. Markets are closely monitoring corporate earnings reports and commentary from Fed officials, including San Francisco Fed President Mary Daly later in the day.
⚠️ Disclaimer:
This content is for educational and informational purposes only—it is not financial advice. Always consult a licensed financial advisor before making investment decisions.
📌 #trading #stockmarket #economy #trade #currency #gold #earnings
EURUSD - Major resistance ahead with the fair value gaps!The EUR/USD pair remains firmly within a prevailing downtrend, characterized by a consistent pattern of lower highs and lower lows. This bearish momentum has resulted in the formation of several significant Fair Value Gaps (FVGs) on the 4-hour chart, which now act as potential resistance zones on any pullbacks. These FVGs not only coincide with important technical structures, but also align with key Fibonacci retracement levels, adding confluence to their strength. In the analysis below, we’ll walk through these zones and discuss the most probable scenarios based on the current price action.
First resistance zone
The first major resistance lies within the 4-hour FVG in the 1.1600 to 1.1650 region. This zone coincides with the golden pocket, which is formed between the 0.618 and 0.65 Fibonacci retracement levels. This overlap strengthens the likelihood of price reacting bearishly here, should the market manage to retrace upwards into this area. Given the strong downward momentum, this level may be enough to trigger a continuation to the downside, making it a critical area to monitor for rejection signals.
Second resistance zone
The second key resistance is found in the upper 4-hour FVG, ranging from 1.1690 to 1.1750. This zone aligns closely with the 0.786 Fibonacci retracement level and marks a former support zone that has now been broken, indicating a potential structure break. Price returning to this level would be retesting the underside of broken market structure, which often acts as a powerful resistance area. Given this, a deeper pullback into this region may serve as a trap for late buyers and potentially offer a high-probability short setup.
Bullish bounce area
On the bullish side, the most relevant support is currently found within the 1-hour FVG that was formed last Friday, during the release of the U.S. unemployment rate data. This zone is positioned below current price levels and is likely to act as a strong short-term demand area. It is reasonable to anticipate a bullish reaction from this zone if the market retraces downward, making it a favorable area to seek long opportunities for a potential move into the higher resistance levels described above.
Final thoughts
While the broader trend remains bearish, short-term bullish bounces are likely within defined fair value gaps. Traders should keep a close eye on the 1-hour FVG for possible long entries, while watching the 4-hour FVGs, particularly those aligning with key Fibonacci levels, for signs of bearish continuation. If resistance holds firm, the EUR/USD could resume its downtrend, but any structural breaks or sustained closes above these levels would challenge that view. As always, price action around these zones should guide the final decision-making.
-------------------------
Disclosure: I am part of Trade Nation's Influencer program and receive a monthly fee for using their TradingView charts in my analysis.
Thanks for your support. If you enjoyed this analysis, make sure to follow me so you don't miss the next one. And if you found it helpful, feel free to drop a like 👍 and leave a comment 💬, I’d love to hear your thoughts!

AMD Analysis Are WE GOING TO $199? Good morning trading fam
Currently we a strong bull run for AMD on the Monthly time frame.
Currently if we can hold above 172 then we will see a nice run up to 196-199 territory or higher.
If we break below the 172 we can a quick short down to the orange level we marked out.
Happy Trading
Trade Smarter Live Better
Kris
OKLO — when nuclear momentum breaks resistanceSince late 2024, OKLO had been consolidating inside a clear rectangle between $17 and $59. The breakout from this long-term range triggered a new bullish impulse. The price has since returned to retest the breakout zone, now aligned with the 0.618 Fibonacci retracement at $51.94. The retest has completed, and the price is bouncing upward, confirming buyer interest.
Technically, the trend remains firmly bullish. The price closed above the prior range, EMAs are aligned below, and the volume spike during breakout supports genuine demand. The volume profile shows a clean path toward $100, indicating limited resistance ahead. The structure suggests a controlled rally rather than an exhausted move.
Fundamentally, OKLO is a next-generation SMR (Small Modular Reactor) company focused on delivering compact, efficient nuclear power solutions. Following its public debut via SPAC and recent capital injection, OKLO is transitioning from development to implementation. Institutional interest is holding strong, and the broader move toward decarbonization and energy independence places the company in a strategic position.
Target levels:
— First target: $100 — psychological and technical resistance
— Second target: $143 — projected from prior range breakout
OKLO isn’t just another clean energy ticker — it’s a quiet disruptor with nuclear potential. The chart broke out. The volume confirmed. Now it’s time to see if the market follows through.

Ashok Leyland looking attractive on charts. Ashok Leyland Ltd. engages in the manufacture and sale of commercial, defense vehicles, and power solutions.
Ashok Leyland’s Closing price is 121.97. Dividend Yield @CMP = 2.60%. The positive aspects of the company are Companies with decreasing Promoter pledge, Annual Net Profits improving for last 2 years, MFs increased their shareholding last quarter and FII / FPI or Institutions increasing their shareholding. The Negative aspects of the company are High Valuation (P.E. = 23.2), Companies with High Promoter Pledge, Declining Net Cash Flow : Companies not able to generate net cash, Companies with High Debt and Companies with growing costs YoY for long term projects.
Entry can be taken after closing above 123.5 Historical Resistance in the stock will be 126 and 131. PEAK Historic Resistance in the stock will be 142 and 150. Stop loss in the stock should be maintained at Closing below 114 and 100 depending upon your risk taking ability.
Disclaimer: The above information is provided for educational purpose, analysis and paper trading only. Please don't treat this as a buy or sell recommendation for the stock or index. The Techno-Funda analysis is based on data that is more than 3 months old. Supports and Resistances are determined by historic past peaks and Valley in the chart. Many other indicators and patterns like EMA, RSI, MACD, Volumes, Fibonacci, parallel channel etc. use historic data which is 3 months or older cyclical points. There is no guarantee they will work in future as markets are highly volatile and swings in prices are also due to macro and micro factors based on actions taken by the company as well as region and global events. Equity investment is subject to risks. I or my clients or family members might have positions in the stocks that we mention in our educational posts. We will not be responsible for any Profit or loss that may occur due to any financial decision taken based on any data provided in this message. Do consult your investment advisor before taking any financial decisions. Stop losses should be an important part of any investment in equity.

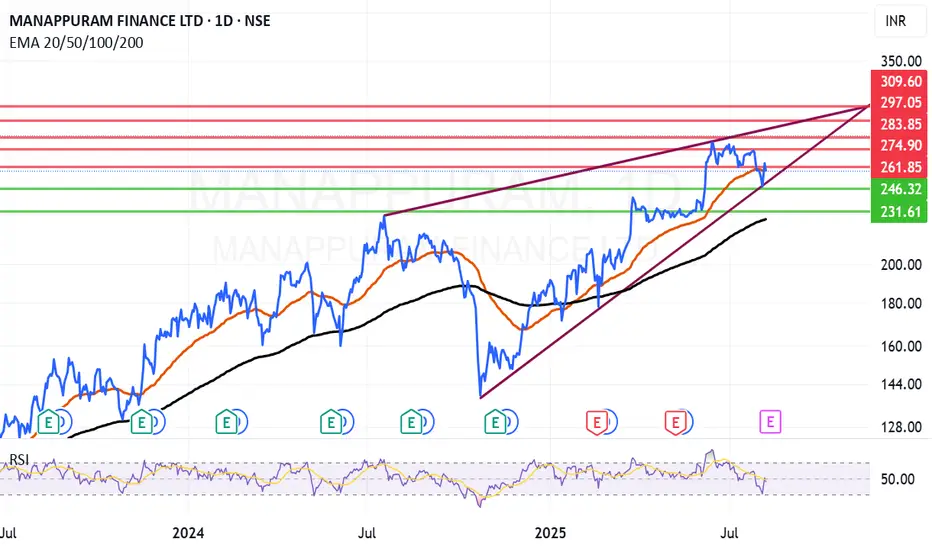
Manappuram can bounce again from Mother line? Manappuram Finance Ltd. is a non-banking financial company, which engages in the provision of financial services, including gold loans, foreign exchange services, and remittances. The firm offers cash loan against gold pledge and also offers customers money transfers and foreign exchange services. It operates through Gold Loan and Others and Microfinance segments.
Manappuram Finance Ltd. Closing price is 258.9. Dividend Yield @CMP = 1.41%. The positive aspects of the company are Stocks Outperforming their Industry Price Change in the Quarter, Companies with Zero Promoter Pledge, Dividend yield greater than sector dividend yield, Rising Net Cash Flow and Cash from Operating activity and FII / FPI or Institutions increasing their shareholding. The Negative aspects of the company are Increase in Provisions in Recent Results, Increasing Trend in Non-Core Income, Declining profits every quarter for the past 2 quarters and Insiders sold stocks.
Entry can be taken after closing above 262 Historical Resistance in the stock will be 274 and 283. PEAK Historic Resistance in the stock will be 297 and 309. Stop loss in the stock should be maintained at Closing below 246 or 231 depending upon your risk taking ability.
Disclaimer: The above information is provided for educational purpose, analysis and paper trading only. Please don't treat this as a buy or sell recommendation for the stock or index. The Techno-Funda analysis is based on data that is more than 3 months old. Supports and Resistances are determined by historic past peaks and Valley in the chart. Many other indicators and patterns like EMA, RSI, MACD, Volumes, Fibonacci, parallel channel etc. use historic data which is 3 months or older cyclical points. There is no guarantee they will work in future as markets are highly volatile and swings in prices are also due to macro and micro factors based on actions taken by the company as well as region and global events. Equity investment is subject to risks. I or my clients or family members might have positions in the stocks that we mention in our educational posts. We will not be responsible for any Profit or loss that may occur due to any financial decision taken based on any data provided in this message. Do consult your investment advisor before taking any financial decisions. Stop losses should be an important part of any investment in equity.
Cyclical Stocks vs Non-Cyclical Stocks: How Can You Trade Them?Cyclical Stocks vs Non-Cyclical Stocks: How Can You Trade Them?
Not every stock is created equal. One of the biggest distinctions is cyclical vs non-cyclical—those that grow or decline alongside economic conditions and those that are less sensitive. In this article, we explore the key differences between the two, how to analyse both, and how to trade them.
What Are Cyclical Stocks?
Cyclical stocks are those that rise and fall in line with the broader economy. They’re more sensitive to consumer spending and include those in the travel, automotive, construction, and luxury goods sectors.
Simply put, when consumers have more disposable income, they’re likely to buy new cars, travel abroad, or invest in home improvements. Demand boosts corporate earnings and pushes share prices higher. However, when consumers have less money or face economic uncertainty, they reduce and delay spending on these discretionary purchases, dampening company earnings and stock valuations.
Nike and Starbucks are good examples here—both are cyclical companies that see higher demand when consumers are in a stronger financial position and feel comfortable purchasing brand-name clothes or buying coffee on the go.
Cyclical stocks tend to be more volatile than non-cyclical ones. Their sensitivity to cyclical business conditions offers potential opportunities for traders to capitalise on a growth phase, but timing matters—getting caught in a temporary or prolonged downturn can lead to sharp drawdowns.
Cyclical Sectors
- Automotive
- Airlines & Travel
- Luxury Goods & Apparel
- Construction & Materials
- Banking & Financial Services
- Technology & Semiconductors
- Restaurants & Entertainment
- Retail (Discretionary Spending)
Is Tesla a Cyclical Stock?
Yes, Tesla is a cyclical stock. Demand for electric vehicles moves in line with economic conditions, consumer spending, and interest rates.
Is Amazon a Cyclical Stock?
Amazon is partly cyclical. Its retail business depends on consumer spending but its cloud computing division (AWS) sees constant demand and provides diversification.
What Are Non-Cyclical Stocks?
Non-cyclical stocks belong to companies that sell essential goods and services. Contrasting with cyclical stocks and their sensitivity to consumer spending, non-cyclical companies sell things people buy regardless of economic conditions. They’re often referred to as defensive stocks because they tend to hold up when the economy weakens.
Non-cyclical sectors include healthcare, utilities, and consumer staples. Supermarkets, pharmaceutical companies, and electricity providers see relatively steady demand because people still need food, medicine, and power whether the economy is growing or contracting.
For example, consumer non-cyclical stocks, like Procter & Gamble, which owns brands like Oral-B, Charmin, and Gillette, continue to generate revenue year-round because consumers still buy everyday household items. The same goes for Johnson & Johnson, which sells medical products that hospitals and pharmacies need.
Compared to cyclical stocks, non-cyclical stocks are usually less volatile because their earnings are more consistent. While their potential returns are relatively limited vs their more growth-oriented cyclical counterparts, non-cyclical stocks are believed to not dive as sharply during a downturn.
Non-Cyclical Sectors
- Consumer Staples (Everyday Goods)
- Healthcare & Pharmaceuticals
- Utilities (Electricity, Water, Gas)
- Telecommunications
- Grocery & Essential Retail
- Defence & Aerospace
How Traders Analyse Cyclical Stocks
In a market where going long or short volatile cyclical stocks is an option (such as with CFDs), many prefer to trade them over non-cyclical stocks. More broadly, traders analyse a few key indicators to determine whether cyclical stocks are in a growth phase.
Macroeconomic Indicators
When GDP expands, businesses and consumers spend more, and free-flowing spending boosts demand in cyclical sectors. Similarly, interest rates determine spending on more big-ticket purchases, like cars, homes, and luxury goods. Lower interest rates encourage borrowing and vice versa.
Employment rates also play a key role. More layoffs and a higher unemployment rate mean consumers dial back purchases of discretionary goods and services. Employment conditions, along with economic and policy uncertainty, drive consumer confidence. When optimism is high, cyclical stocks often rally.
Earnings Trends & Sector Data
Unlike non-cyclical companies, cyclical firms see earnings fluctuate based on economic cycles. Traders pay attention to quarterly reports and especially forward guidance. If a company expects strong sales growth due to rising demand, this can drive its stock price higher and possibly signal an upswing in the sector.
Industry-specific data, like auto sales figures or airline bookings, is also a useful gauge for assessing the future performance of a company.
Market Sentiment & Seasonal Trends
Cyclical stocks are prone to seasonal patterns—retailers surge in the holiday season, while travel stocks perform well in summer. Market sentiment is another important factor; for instance, if economic uncertainty is growing but investors on the whole believe it to be a temporary blip, then cyclical stocks may still rise.
Analysing Non-Cyclical Stocks
While traders often favour cyclical stocks for their higher potential returns, many still turn to non-cyclical companies as a possible form of short-term defence against downturns, to balance a long-term portfolio, or when unique occasions arise (earnings reports, company-specific news, etc.).
Earnings Stability & Cash Flow
Since non-cyclical companies sell essential goods and services, their earnings tend to be more consistent. Traders look at revenue trends, gross margins, and free cash flow to assess a firm’s ability to generate relatively steady income. Consistent earnings—even during downturns—can be a marker of a strong non-cyclical stock.
Dividend History & Payout Ratios
Many non-cyclical stocks pay dividends. That makes them attractive for those looking for income-generating assets. A company with a long track record of consistent or growing dividend payments is often a sign of financial strength. The payout ratio (dividends paid as a percentage of earnings) is another metric traders examine—too high, and it could indicate unsustainable distributions.
Market Conditions & Defensive Rotation
If economic uncertainty rises, investors will generally shift into defensive sectors like healthcare, utilities, and consumer staples. Many will monitor fund flows—where institutional money managing exchange-traded funds (ETFs), mutual funds, and large portfolios is headed—to understand if risk aversion is growing.
Likewise, outperformance in certain sectors can be a signal. If sector indices like the S&P 500 Consumer Staples Index or the S&P 500 Healthcare Index outperform the overall S&P 500, it may indicate capital moving into non-cyclical stocks.
Trading Cyclical and Non-Cyclical Stocks
Now, let’s take a closer look at how traders engage with these stocks.
Short-Term Trading
Short-term traders generally focus on stocks or sectors expected to move over hours or days. One strategy might be to examine the broader conditions and trade ahead of earnings reports. If summer is approaching and the economy is doing well, Delta Air Lines could rise in the weeks before an earnings release as traders anticipate strong quarterly performance and positive forward guidance.
Another strategy is trading macro themes. If inflation rises, traders might focus on companies with strong pricing power, like consumer staples firms that can pass costs onto consumers. If economic data points to a slowdown, they might focus on healthcare stocks.
Medium-Term Trading
Medium-term traders take a broader view and typically adjust their portfolio weightings based on economic conditions. During expansions, they may overweight cyclicals like construction and travel stocks, while shifting into non-cyclicals as recession risks grow. That could mean just rebalancing a collection of ETFs, over/under-weighting a set of stocks, or a mix of both.
Here, the focus is usually on broader economic trends while also staying alert for possible strengthening or weakening consumer demand.
Long-Term Trading
Long-term traders often hold a mix of cyclical and non-cyclical stocks to maintain a balanced portfolio across economic cycles. While they may still adjust weightings over time, they tend to be more concerned with long-term sector trends and income generation.
With a longer time horizon, these traders may be more willing to allocate more capital to cyclical stocks during a downturn, especially to otherwise strong companies or sectors, to take advantage of potential rebounds months down the line.
The Bottom Line
Understanding the difference between cyclical and non-cyclical stocks is fundamental to trading them. Careful analysis—macroeconomic, sectoral, and company-specific—can help traders identify potential opportunities across all time horizons.
FAQ
What Are Examples of Cyclical Stocks?
Cyclical stocks include Tesla (TSLA), Delta Air Lines (DAL), Nike (NKE), Caterpillar (CAT), Marriott International (MAR), and Ford (F).
Which Industries Are Most Cyclical?
Highly cyclical industries include automotive, airlines, hospitality, construction, luxury goods, and consumer discretionary retail.
Is Coca-Cola a Cyclical Stock?
No, Coca-Cola is considered a non-cyclical stock. Demand for its wide range of products remains stable regardless of economic conditions.
Is Starbucks a Cyclical Stock?
Yes, Starbucks is a cyclical stock. Coffee purchases aren’t essential, so demand fluctuates based on disposable income and consumer confidence.
This article represents the opinion of the Companies operating under the FXOpen brand only. It is not to be construed as an offer, solicitation, or recommendation with respect to products and services provided by the Companies operating under the FXOpen brand, nor is it to be considered financial advice.
S&P500’s Bullish Island Turns Risky: Elliott Wave Says “Top”The S&P500 Index( SP:SPX ) started to rise and even created a new All-Time High(ATH=$6,428) with the help of the Bullish Long Island Pattern , as I published in my previous idea on May 14, 2025 .
The S&P500 Index is currently moving near the Potential Reversal Zone(PRZ) , upper line of the ascending channel , the Important Resistance line , and the Yearly Resistance(1) .
In terms of Elliott Wave theory , the S&P500 Index appears to be completing microwave 5 of microwave 5 of the main wave 5 .
Also, we can see the Regular Divergence(RD-) between Consecutive Peaks .
I expect the S&P500 Index to correct at least -4% and fall to the lower line of the ascending channel .
First Target: $6,233
Second Target: $6,033
Note: Stop Loss(SL) $6,513
Do you think S&P500 Index can create a new ATH above $6,500 !?
Please respect each other's ideas and express them politely if you agree or disagree.
S&P 500 Index Analyze (SPX500USD), Daily time frame.
Be sure to follow the updated ideas.
Do not forget to put a Stop loss for your positions (For every position you want to open).
Please follow your strategy and updates; this is just my Idea, and I will gladly see your ideas in this post.
Please do not forget the ✅' like '✅ button 🙏😊 & Share it with your friends; thanks, and Trade safe.

Nightly $SPY / $SPX Scenarios for August 5, 2025🔮 Nightly AMEX:SPY / SP:SPX Scenarios for August 5, 2025 🔮
🌍 Market‑Moving News 🌍
🔹 PBOC Moves Prompt FX Backlash
On August 5, 2019, China’s central bank allowed the yuan to depreciate over 2% to its lowest level since 2008. That same day, the U.S. Treasury officially designated China as a currency manipulator, citing the PBOC’s moves as retaliation for recent U.S. tariff actions. In response, China ordered state-owned enterprises to suspend purchases of U.S. agricultural goods—a significant blow to U.S. exporters.
🔹 EU Suspends Counter-Tariffs for Six Months
Following a negotiated framework with the U.S., the European Union suspended retaliatory tariffs on U.S. goods for six months. The move aims to de-escalate trade tensions while joint discussions continue.
🔹 Citi Raises Gold Price Outlook to $3,500/oz
Citi revised its short-term trading range for gold to $3,300–$3,600 per ounce, based on weakening U.S. labor data, rising inflation pressure from tariffs, and growing demand for safe-haven assets. Spot gold traded around $3,356 oz on Monday.
📊 Key Data Releases & Events 📊
📅 Tuesday, August 5:
8:30 AM ET – U.S. Trade Balance (June)
Expected to improve modestly to –$67.6 billion (from –$71.5B), reflecting tariff-influenced shifts in import/export volumes.
9:45 AM ET – S&P Global U.S. Final Services PMI & ISM Non-Manufacturing Index (July)
Key indicators of service-sector strength. Readings above 50 suggest expansion; below 50, contraction. Flash estimates forecast moderated growth in activity.
⚠️ Disclaimer:
This content is for educational and informational use only—not financial advice. Consult a licensed financial advisor before making investment decisions.
📌 #trading #stockmarket #economy #trade #data #inflation #currency

NVTS Tight Coil Before Earnings## ⚡️ \ NASDAQ:NVTS WEEKLY TRADE IDEA (AUG 5–9)
**🔥 STRONG BULLISH FLOW | CALL/PUT: 5.24 | EARNINGS INCOMING**
---
### 🔍 SENTIMENT SNAPSHOT
* 📈 **Daily RSI**: 59.2 — Bullish
* 📅 **Weekly RSI**: 71.4 — Strong momentum
* 🔻 **Volume**: 0.7x — Weak institutional follow-through
* 🔔 **Earnings Risk**: HIGH — Earnings expected Aug 5
* 🧠 **Model Consensus**: Bullish, but cautious on binary event
---
### 💡 TRADE SETUP
| 🔹 | Trade Type | Long Call |
| -- | -------------- | --------------- |
| 🎯 | **Strike** | **\$8.50** |
| 📅 | **Expiry** | **Aug 8 (Fri)** |
| 💵 | **Entry** | **\$0.55** |
| 📈 | **Target** | **\$1.50** |
| 🛑 | **Stop** | **\$0.30** |
| 📏 | **Size** | 1 contract |
| ⚖️ | **Confidence** | 70% |
---
### ⚠️ TRADE NOTES
* 🚨 Earnings volatility could create gaps — plan around Aug 5
* 📉 Low volume = reduced follow-through risk
* ⏰ Very short expiry = high gamma exposure
---
### 🧩 STRATEGY CONTEXT
> “Momentum is real, but earnings are the wildcard. Size light. Stay nimble.”
📍 Enter: At market open Monday
🔍 Watch: Post-earnings price action + volume spike
📊 Manage: Tight stop, scale out if it rips pre-earnings
---
💬 Playing NVTS this week?
🔥 Comment “NVTS” if you’re watching this setup
🔁 Repost if you’re riding earnings momentum

S&P 500 ETF & Index– Technicals Hint at a Possible Correction📉📊 S&P 500 ETF & Index at Resistance – Technicals Hint at a Possible Correction 🔍⚠️
Everything here is pure technicals— but sometimes, the market whispers loud and clear if you know how to listen. 🧠📐
The VOO ETF, which tracks the S&P 500 , has now reached the upper boundary of a long-term ascending channel, once again brushing against resistance near 590.85. This zone has consistently led to major pullbacks in the past.
On the right panel, the US500 Index mirrors this move—pushing toward all-time highs, right as broader sentiment turns euphoric. Technically, both charts are overextended and pressing into key zones.
👀 Potential Path:
🔻 Rejection from current zone ➝ Down toward 526.17, then 465.72 (green support channel)
🔁 Possible bounce after correction — trend still intact long term
And while we’re keeping it technical, it’s worth noting that the Buffett Indicator (Stocks-to-GDP) i s currently screaming “overvaluation.” This doesn't predict timing—but it adds macro context to an already overheated chart setup.
The lesson? Price respects structure. Whether or not the fundamentals are in agreement, the charts are warning that now may not be the time to chase.
History doesn’t repeat, but it often rhymes. Stay sharp, stay technical. 🎯
One Love,
The FX PROFESSOR 💙
ps. the beauty of these levels? Tight Stop loss- excellent R/R
Disclosure: I am happy to be part of the Trade Nation's Influencer program and receive a monthly fee for using their TradingView charts in my analysis. Awesome broker, where the trader really comes first! 🌟🤝📈

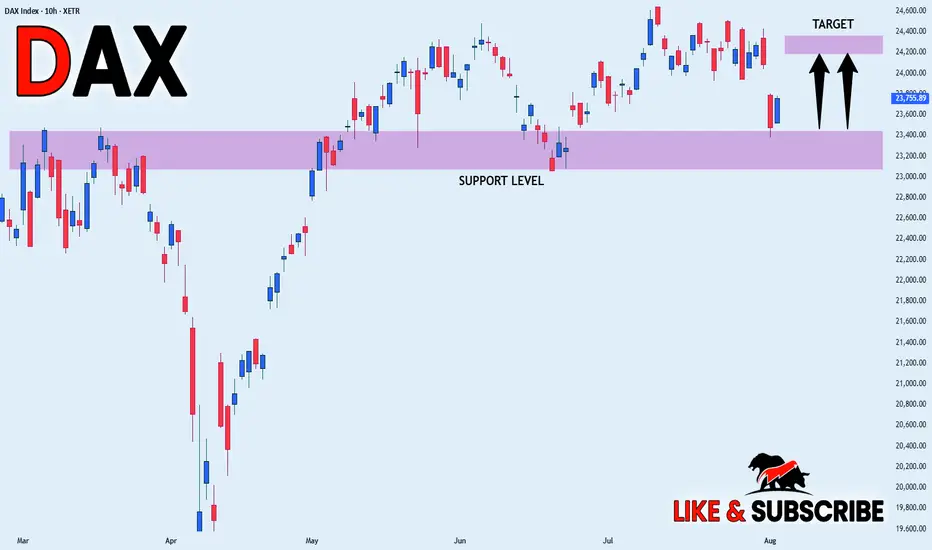
DAX WILL GROW|LONG|
✅DAX is trading in an
Uptrend and the index made
A bullish rebound from the
Horizontal support of 23,400
Which reinforces our bullish
Bias and we will be expecting
A further bullish move up
LONG🚀
✅Like and subscribe to never miss a new idea!✅