BANKNIFTY Falling as projected.We gave an analysis on BANKNIFTY based on a follower's request, though it lingered at our interest zone, however, it gave some massive push down today as you can see.
We expect some more drops on BANKNIFTY.
We do expect you to manage your trade appropriately as it aligns with your psychology and trading plan.
Stocks!

TSLA - Get Ready To Long Again...Hello TradingView Family / Fellow Traders. This is Richard, also known as theSignalyst.
📈TSLA has been trading within a big symmetrical triangle marked in blue.
Moreover, it is retesting a strong support zone around $200 round number marked in green.
🏹 Thus, the highlighted blue circle is a strong area to look for buy setups as it is the intersection of the green support and lower blue trendline.
📚 As per my trading style:
As #TSLA approaches the blue circle zone, I will be looking for bullish reversal setups (like a double bottom pattern, trendline break , and so on...)
📚 Always follow your trading plan regarding entry, risk management, and trade management.
Good luck!
All Strategies Are Good; If Managed Properly!
~Rich

NVIDIA’s Tug of War: Bulls and Bears Face OffMorning, Trading Family! NVIDIA (NVDA) is stuck in a standoff between bulls and bears. Green arrows point to a possible breakout toward $146, while red arrows warn of a drop toward support around $127.50. It’s all about watching how price reacts at these key levels—whether momentum pushes it higher or sellers step in and take control.
Stay patient and focused. Trade what you see, not what you hope for.
– Mindbloome Trader

Will NVDA Bounce or Breakdown? Key Levels to Watch at $129 and BGood evening Trading Family
NVDA is at a critical point right now—will it bounce back from $129, or are we headed down to $126 (or lower)? Let’s dive into the key levels I’m watching and break down what might happen next. If the market holds up, we could see a solid bounce, but if not... well, buckle up for a bigger drop. No fluff—just some good ol' technical analysis with a dash of Fibonacci and candlestick magic.
If you found this helpful (or just mildly entertaining), give it a like, drop a comment with your thoughts, and hit follow for more updates. Your engagement helps me keep the content coming—and who knows, it might even help NVDA bounce back too!
MB Trader
Trade what you see not what you assume

SEDG Solaredge - More losses ahead?Solaredge Chart Analysis
The stock is in a clear downtrend since February
with a Significant resistance level at around $32.11
The Minor support seems at around $17.12
Increased volume during price drops indicates strong selling pressure and
Prices below the EMA are clues for bearish momentum
Key Points for a Trade
Entry: Consider waiting for a break below support or a pullback at resistance.
Stop-Loss: Set slightly above recent swing high ($24) to manage risk.
In case of pullback look for Stops at around $32.90
Trend continuation: Be cautious at EMA crossover or strong volume spikes, which could indicate a trend reversal.
Additional Clues:
Todays Put Option Volume increased 1,4 times of what was expected indicating bearish flow

NVIDIA | A Second Technical Entry Opportunity This Year
NVIDIA has presented two key technical entry points for investors in 2024.
The first entry came during a correction in early August around the $100 level, which was shared on my TradingView channel.
The second opportunity is now, following last week’s close at an all-time high level.
After NVIDIA's strong rally in 2024, there have been two technical opportunities to enter the stock. The first was during the correction in early August around the $100 mark , which I highlighted in my earlier TradingView post.
The second opportunity has emerged now, as last week's closing price marked the highest in history. While the stock hasn't officially hit an all-time high yet, it has broken through the critical $130 resistance level, which had been a barrier for the past four months. This breakout puts the stock in what is often called "open waters," where there is no significant resistance overhead.
It's important to note that while this presents a potential technical buy, fundamentals play a key role here. The resistance of four months is relatively short in terms of a breakout, and from a psychological perspective, buying at current highs can feel doubting. While the technicals suggest a reasonable entry, it’s crucial to have a clear thesis, a long-term holding plan, and solid fundamental research.
At this point, I would say that entering the stock now carries more risk. It’s not a good entry point for short-term gains, and I wouldn’t recommend an "all-in" approach at these levels. Only investors who are willing to add to their position during a pullback, and who have done their fundamental homework should consider buying now with a long-term perspective.
Summary
NVIDIA has presented two technical buying opportunities in 2024, with the latest one emerging after a modest breakout above $130. While there is potential for further gains, such as a move toward $150-$170, this is a riskier entry, especially for short-term traders. Investors should consider the current market environment, do their fundamental research, and only buy if they’re prepared to hold for the long term or add to their position in case of a pullback.
Regards,
Vaido

#Tesla Analysis : +20% so far, What's Next ? (READ THE CAPTION)By analyzing the #Tesla stock chart on the weekly (logarithmic) timeframe, we can see that, as expected in the previous analysis, Tesla stock faced selling pressure after reaching the supply zone of $233 to $271. This selling pressure intensified this week, causing the price to drop by about 20%, reaching $214. Currently, Tesla stock is trading around $220. We will likely see a slight upward move followed by further declines in the stock.
The Main Analysis :
Please support me with your likes and comments to motivate me to share more analysis with you and share your opinion about the possible trend of this chart with me !
Best Regards , Arman Shaban

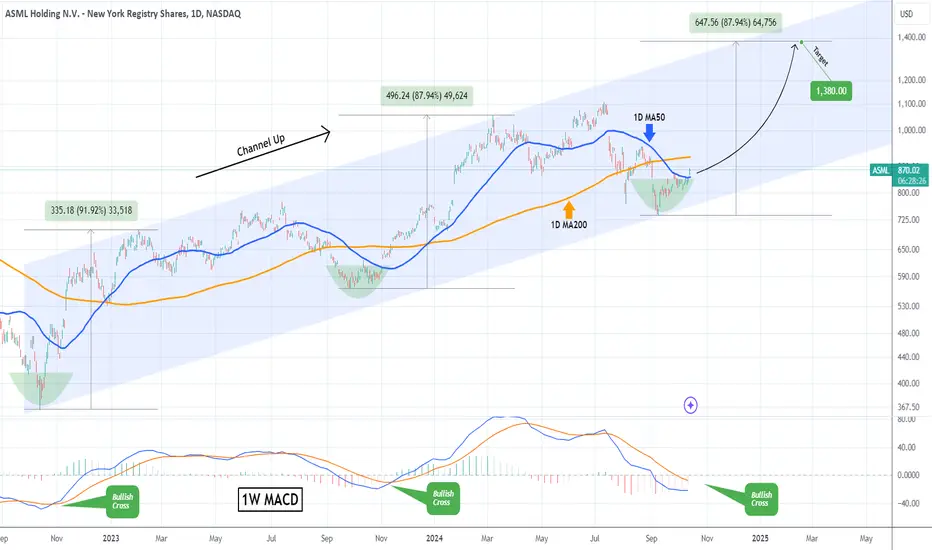
ASML Perhaps the most structured buy in the market!ASML Holding (ASML) has been trading within a 2-year Channel Up pattern since the October 13 2022 Low. The recent September 10 2024 Low has been at the bottom of the pattern, technically forming its new Higher Low.
Yesterday it broke and closed above its 1D MA50 (blue trend-line) for the first time in 3 months, which has been a solid bullish break-out signal on both previous Bullish Legs. Those then went on huge rallies that rose by +87.94% and +91.92% respectively.
As a result, with the 1W MACD about to form the final buy confirmation with a Bullish Cross, we set a 1380 long-term Target on a minimum +87.94% rise from the bottom, that will form an ideal Higher High on the Channel Up.
-------------------------------------------------------------------------------
** Please LIKE 👍, FOLLOW ✅, SHARE 🙌 and COMMENT ✍ if you enjoy this idea! Also share your ideas and charts in the comments section below! This is best way to keep it relevant, support us, keep the content here free and allow the idea to reach as many people as possible. **
-------------------------------------------------------------------------------
💸💸💸💸💸💸
👇 👇 👇 👇 👇 👇
Reliance breaks the trend line and mid channel support. Reliance breaks the trend line and mid channel support after below par support. Only saving grace can be that it is entering the oversold zone and another major support territory. The major support territory for Reliance is 2561 and 2657. We can expect a reversal from this zone. The stock can be added post bounce and further compounded after it crosses the mother and father line. After bottom formation takes place. Which has not taken place as of now.
The stock can be bought/added/averaged in X/4 quantity. Remaining 3 X/4 entries will be above Mother line 50 days EMA, above Father line that is 200 days EMA and finally after closing above 3007. As it is a long term investment Idea and Portfolio stock, Part of my personal portfolio too I would rather not keep a stop loss here. If a trader and investor wants to keep a stop loss he / she can do it after monthly closing below 2250 zone.
One or 2 quarters poor / below market expectation result should not deter an investor in holding on to GEMs. Jio Platforms Q2 profit rises 23.4% to Rs 6,539 crore; ARPU for JIO is at Rs 195.1. Green Energy Segment may start performing for Reliance from 2025. Long term outlook for the stock still remains positive.
Disclaimer: The above information is provided for educational purpose, analysis and paper trading only. Please don't treat this as a buy or sell recommendation for the stock. We do not guarantee any success in highly volatile market or otherwise. Stock market investment is subject to market risks which include global and regional risks. I an my clients have long positions in this stock. We will not be responsible for any Profit or loss that may occur due to any financial decision taken based on any data provided in this message.

TESLA LONG FROM RISING SUPPORT|
✅TESLA is trading along the rising support
And as the stock will soon retest it
I am expecting the price to go up
To retest the supply levels above at 230$
LONG🚀
✅Like and subscribe to never miss a new idea!✅

High Dividend yield HPCL wants to fly higher. Hindustan Petroleum Corp. Ltd. engages in the business of refining crude oil and sales of petroleum products. It operates through the Downstream and Others segment. The Downstream segment deals with the refining and marketing of petroleum products; The Other segment engages in exploration and production of hydrocarbons, manufacturing sugar ethanol. Hindustan Petroleum Corp. CMP is 405.85.
The positive aspects of the company are cheap Valuation (P.E. = 8.7), Company with Zero Promoter Pledge, Annual Profit Growth higher than Sector Profit Growth, MFs increased their shareholding last quarter and Stocks Outperforming their Industry Price Change in the Quarter. Dividend yield of the company at CMP is 5.2%. The Negative aspects of the company are Increasing Trend in Non-Core Income.
Entry can be taken after closing above 409 Targets in the stock will be 416 and 429. The long-term target in the stock will be 447 and 457. Stop loss in the stock should be maintained at Closing below 380 or 363 depending on your risk taking ability.
Disclaimer:The above information is provided for educational purpose, analysis and paper trading only. Please don't treat this as a buy or sell recommendation for the stock. We do not guarantee any success in highly volatile market or otherwise. Stock market investment is subject to market risks which include global and regional risks. We will not be responsible for any Profit or loss that may occur due to any financial decision taken based on any data provided in this message.

BPCL with high dividend yield wants to go higher. Bharat Petroleum Corp. Ltd. is a holding company, which engages in the business of refining of crude oil and marketing of petroleum products. It operates through the Downstream Petroleum and Exploration and Production (E&P) segment. The Downstream Petroleum segment includes the refining and marketing of petroleum products. The E&P segment focuses on hydrocarbons.
Bharat Petroleum Corp. CMP is 340.75. The positive aspects of the company are cheap Valuation (P.E. = 7.8), Company reducing Debt, Company with Zero Promoter Pledge, Dividend yield of the company at CMP is 6.2%. and Strong Annual EPS Growth. The Negative aspects of the company are Declining Net Cash Flow : Companies not able to generate net cash, Increasing Trend in Non-Core Income and Companies with growing costs YoY for long term projects.
Entry can be taken after closing above 347 Targets in the stock will be 355 and 363. The long-term target in the stock will be 375. Stop loss in the stock should be maintained at Closing below 320 or 293 depending on your risk taking ability.
Disclaimer: The above information is provided for educational purpose, analysis and paper trading only. Please don't treat this as a buy or sell recommendation for the stock. We do not guarantee any success in highly volatile market or otherwise. Stock market investment is subject to market risks which include global and regional risks. We will not be responsible for any Profit or loss that may occur due to any financial decision taken based on any data provided in this message.

COINBASE Enormous upside from this point. $360 minimum Target.Coinbase (COIN) has staged a strong bullish turnaround since our last analysis (September 09, see chart below) and it appears that we caught the perfect bottom buy:
The stock has been trading within a long-term Channel Up since the first week of January 2023 (22 months). Within this time span, it has seen 4 corrections with the latter being the longest as we haven't seen a new High since the week of March 25 2024. The current correction is almost the same (-48.50%) as the January - April 2023 (-47.15%), while the other two have been around -39%.
The key for now is to close a 1W candle above both the 1W MA50 (blue trend-line) and the 1D MA50 (red trend-line). That will be the last confirmation for this Bullish Leg. This on its own is a very pessimistic development, with the presence of only the 1W MA100 (green trend-line) remaining to offer support long-term.
Now as for the upside, the minimum % rise of a Bullish Leg within this Channel Up has been +146.82% (two times). As a result, as long as the 1W RSI closes this week above its MA trend-line (yellow), a bullish signal that emerged on all previous 4 bottoms of the Channel, we can expect the new Bullish Leg to rise on a minimum +146.82% from its bottom, which gives us a $360.00 Target.
-------------------------------------------------------------------------------
** Please LIKE 👍, FOLLOW ✅, SHARE 🙌 and COMMENT ✍ if you enjoy this idea! Also share your ideas and charts in the comments section below! This is best way to keep it relevant, support us, keep the content here free and allow the idea to reach as many people as possible. **
-------------------------------------------------------------------------------
💸💸💸💸💸💸
👇 👇 👇 👇 👇 👇

NBIX -Long -TP>25%NASDAQ:NBIX
-Long
-TP>25-30% and more
-waiting for a point to enter a long position

Microstrategy Remains In The Bullish Trend; Positive For Crypto?MicroStrategy is a leading provider of business intelligence (BI) and analytics software. Founded in 1989, the company helps organizations analyze data to make informed business decisions. It's known for its robust platform that supports data discovery, predictive analytics, and mobile app. Additionally, MicroStrategy has made headlines for its significant investments in Bitcoin and both of them are still in the bullish trend.
Microstrategy with ticker MSTR remains nicely bullish as expected and looks like 5th wave is in progress, which can push the price even higher with space up to 300 area, just be ware of short-term pullbacks. If that will be the case, then Crypto related stocks may cause a bullish breakout on Bitcoin as well due to their positive correlation.

NASDAQ - Will the US stock market remain bullish?The index is above EMA200 and EMA50 in the 4H time frame and is trading in its ascending channel
If the upward trend line is maintained, we can see the index continue to climb up to the previous ATH
The valid failure of this line will pave the way for the correction of the index to the bottom of the ascending channel

PBID - CUP-COMPLETION CHEATIDX:PBID (3C)
14-10-2024
(+):
1. Low risk entry point
2. Volume dries up
3. Price above MA 50 > 150 > 200 over 10 weeks
4. Price is within 25% of 52 weeks high
5. Price is over 30% of 52 weeks low
6. 200 day MA trending up over 1 month
7. RS Rating is over 70 (86)
(-):
1. Not really in Stage 2-a uptrend
2. No big volume on the breakout

#GBPJPY 1DAYThe GBPJPY (1-Day) chart is displaying an uptrend channel resistance pattern. This occurs when the price is moving within an upward-sloping channel and is currently approaching the resistance level, which has been established by previous highs in the trend.
Key Observations:
- The price has been consistently making higher highs and higher lows, following a well-defined ascending channel.
- The pair is now near the upper boundary (resistance) of the channel, where sellers typically step in.
- Multiple rejections from this resistance in the past suggest that the market may respect this level again, providing a potential sell opportunity.
Forecast:
A sell is anticipated as the price nears the channel resistance, with the expectation that it will reverse or correct lower within the channel. Traders should look for bearish confirmation, such as a reversal candlestick pattern or a break below key moving averages, to confirm the entry.
Key Levels:
- Resistance: The upper boundary of the channel.
- Support: The lower boundary of the channel where price might target during a correction.
Risk Management: Place stops above the resistance zone to protect against potential breakouts. Targets can be set near the mid or lower channel boundary.

Vertiv Holdings (VRT) AnalysisCompany Overview: Vertiv Holdings NYSE:VRT is strategically positioned to capitalize on the increasing demand for data center infrastructure, with a particular focus on edge computing and the expanding 5G networks. As companies across various sectors accelerate their digital transformation, Vertiv's role in providing critical infrastructure solutions, including liquid cooling technology, is crucial for the operation and efficiency of modern data centers.
Key Catalysts:
Edge Computing & 5G Growth: The rise of edge computing and 5G networks increases the need for efficient, reliable data center infrastructure, a core competency for Vertiv.
Critical Infrastructure Expertise: Vertiv's leadership in liquid cooling and other essential data center technologies will be increasingly in demand as data centers evolve and expand.
Energy Consumption in Data Centers: With U.S. data centers projected to account for a growing share of electricity consumption, Vertiv’s infrastructure solutions—designed to enhance energy efficiency and optimize operations—are expected to become even more vital.
Digital Transformation: The ongoing shift toward cloud services, AI, and machine learning will fuel greater data center demand, benefitting Vertiv’s business model.
Investment Outlook: Bullish Outlook: We are bullish on VRT above $89.00-$91.00, driven by its market-leading solutions in data center infrastructure and strong growth potential. Upside Potential: Our target range for VRT is $140.00-$145.00, reflecting the company’s strategic position in critical growth sectors like 5G, edge computing, and data centers.
🚀 VRT—Leading Data Center Infrastructure into the Digital Future. #DataCenters #EdgeComputing #5G

BANKNIFTY ProjectionBased on the demand of a follower here, we decided to look into BANKNIFTY for the first time ever...
We anticipate BANKNIFTY heading to either of the two zones up there marked with a blank line, the we expect a great fall on BANKNIFTY...
Should this align with your analysis, endeavour not to miss out on it!

#EUR/USD 1DAYEUR/USD DAILY
On the daily chart of EUR/USD, we observe a bearish pattern forming, suggesting potential downward momentum in the near term. The price has been consistently testing a key support level around 1.10400 (specific level based on the chart), where buyers are struggling to maintain control. This support zone may break under strong selling pressure, leading to a continuation of the downtrend.
Key indicators such as moving averages or oscillators might also signal weakening momentum, providing further confirmation of a **sell** forecast. Traders are advised to watch for a decisive break below the support level, as this would signal an opportunity to enter short positions,
Forecast: Sell
Key support** level: 1.10400
Potential downside targets**: 1.0900, 1.0800 & 1.0700

#US30 1DAYUS30 1D Analysis
On the daily chart, US30 is forming a rising wedge pattern, which is generally considered a bearish signal. The pattern suggests that while the index is moving higher, the momentum is slowing, and a potential reversal could be on the horizon.
Forecast:
-Sell: A rising wedge often leads to a bearish breakout. If US30 breaks below the lower trendline of the wedge, it would confirm a potential reversal. In this case, selling would be the favorable strategy, as a downward move is expected following the breakdown. Keep an eye on volume and other technical indicators to confirm the breakout.

NVDA Set for a Rebound: Will It Hit $137.40 and Beyond?Hey, trading family! Today we’re diving into NVIDIA (NVDA) and its recent price action. Right now, we’re seeing a correction, but all eyes are on whether it can push back up toward that key resistance level of $137.40. Here’s what you need to watch:
Downside risk: If NVDA continues to correct, there’s potential for it to drop below $132. If that happens, we could see the price head even lower, testing support around $128-$130. Keep an eye on these levels, as breaking below them could signal further downside.
Upside potential: On the flip side, if NVDA finds support and buyers step in, we could see it climb toward $137.40. A strong move above this resistance could lead to a bigger breakout, setting the stage for a push higher.
Stay tuned to how NVDA reacts around these key levels—this correction might just present a great opportunity, depending on how the market moves. If this helped, drop a comment or share your thoughts on NVDA’s next move!
