SWING IDEA - GARDEN REACH SHIP & ENGGarden Reach Shipbuilders & Engineers Ltd ., a leading public sector shipyard in India known for building warships and naval vessels, is showing signs of a potential swing trade opportunity.
Reasons are listed below :
1700 Zone as Strong Support : The 1700 level has acted as a crucial support zone, reinforcing a solid base for potential upside movement.
Bullish Engulfing Candle on Daily Timeframe : A bullish engulfing candle has formed, indicating increased buying pressure.
Golden Fib Zone : The price is currently bouncing from the golden Fibonacci zone, suggesting potential for further gains.
100 EMA Support on Daily Timeframe : The stock is well-supported by the 100-day EMA, further solidifying the bullish trend.
Target - 2200 // 2510
Stoploss - daily close below 1640
DISCLAIMER -
Decisions to buy, sell, hold or trade in securities, commodities and other investments involve risk and are best made based on the advice of qualified financial professionals. Any trading in securities or other investments involves a risk of substantial losses. The practice of "Day Trading" involves particularly high risks and can cause you to lose substantial sums of money. Before undertaking any trading program, you should consult a qualified financial professional. Please consider carefully whether such trading is suitable for you in light of your financial condition and ability to bear financial risks. Under no circumstances shall we be liable for any loss or damage you or anyone else incurs as a result of any trading or investment activity that you or anyone else engages in based on any information or material you receive through TradingView or our services.
@visionary.growth.insights
Stocks!

SWING IDEA - IRB INFRA DEVIRB Infrastructure Developers Ltd ., one of India's leading infrastructure development companies, is displaying technical signals that suggest a swing trading opportunity.
Reasons are listed below :
58 Zone as Strong Support: The 58 level has proven to be a crucial support zone, offering a strong foundation for potential upward movement.
Bullish Engulfing Candle on Daily Timeframe: The formation of a bullish engulfing candle indicates a surge in buying pressure.
200 EMA Support on Daily Timeframe: The stock is receiving solid support from the 200-day EMA, which strengthens the bullish outlook.
Volume Spike: A noticeable increase in trading volumes suggests strong investor interest and potential for a breakout.
Target - 72 // 78
Stoploss - daily close below 57
DISCLAIMER -
Decisions to buy, sell, hold or trade in securities, commodities and other investments involve risk and are best made based on the advice of qualified financial professionals. Any trading in securities or other investments involves a risk of substantial losses. The practice of "Day Trading" involves particularly high risks and can cause you to lose substantial sums of money. Before undertaking any trading program, you should consult a qualified financial professional. Please consider carefully whether such trading is suitable for you in light of your financial condition and ability to bear financial risks. Under no circumstances shall we be liable for any loss or damage you or anyone else incurs as a result of any trading or investment activity that you or anyone else engages in based on any information or material you receive through TradingView or our services.
@visionary.growth.insights

UBER Breakaway or Pullback? Trend Analysis
Bullish Momentum: Strong upward momentum with a recent gap up indicates bullish sentiment.
Breakout: Price has broken through previous resistance levels, suggesting continuation.
Price Action Analysis
Gap Up: Significant gap up on high volume signals strong buying pressure.
Pullback Levels: Potential support near $82 could provide buying opportunities.
Indicator Analysis
Volume Surge: High volume confirms the strength of the breakout.
EMA Support: Exponential Moving Average trending up, supporting the bullish outlook.
Forecast Summary
Expected Movement: Anticipate further upward movement, possibly testing new highs.
Key Support and Resistance Levels:
Support Level: Around $80, previously a resistance.
Resistance Level: Near $87, recent high.
Additional Support: Potential at $77, recent consolidation area.
Additional Resistance: Beyond $87 towards $90, historically significant zone.
Triggers/Events: Earnings reports or market news may impact volatility and direction.
Trading should focus on buying opportunities during pullbacks, monitoring key support levels, and staying alert for market events that could influence price dynamics.

GAIL Showing Strength Above 10 EMA: Key Support & Resistance NSE:GAIL Showing Strength Above 10 EMA: Key Support & Resistance Levels (Daily & Weekly Analysis)
NSE:GAIL is currently trading at ₹229.40, maintaining strength above the 10 EMA on the daily chart, indicating positive short-term momentum. A similar setup is reflected on the weekly chart, where the stock is trading well above its 50 EMA, reinforcing a bullish bias.
Key Resistance Levels:
₹236 – Immediate resistance zone, significant on both daily and weekly timeframes. A breakout above this level could trigger further bullish momentum.
₹246 – The 52-week high, acting as a strong resistance on the weekly chart. A decisive move above this would mark a fresh bullish breakout, potentially leading to accelerated gains.
Key Support Levels:
₹226 – Crucial short-term support on the daily chart, aligning closely with the 50 EMA (₹226.29). Holding this level is essential for sustaining the positive trend.
₹216 – Next significant support zone on both timeframes. A break below this could signal weakening momentum.
₹196 – Major support level corresponding to the weekly 50 EMA. This level acts as a long-term safety net, and a breach below would indicate a shift in the broader trend.
Outlook:
The stock’s alignment above key EMAs on both the daily and weekly charts suggests that GAIL is in a strong uptrend. A break above ₹236 could lead to a test of the 52-week high at ₹246, where a breakout would be a strong bullish signal. Traders should monitor price action around these levels closely.
If GAIL faces a pullback, holding support at ₹226 will be crucial to maintain its short-term momentum. A break below ₹216 could indicate potential weakness, with ₹196 (weekly 50 EMA) serving as a critical long-term support.
Disclaimer: I am not a SEBI Registered Research Analyst (RA). This analysis is for educational purposes only and should not be considered as investment advice. Please conduct your own research or consult a financial advisor before making any trading decisions.

QQQ Weekly Outlook (SPY) for OCT 14, 2024A week ago, I provided a weekly long-term view of QQQ (link below):
I annotated that by looking at the weekly time frame, we can note that QQQ has been bouncing off the weekly trendline (TL) that started back in JAN 2023.
It has touched and bounced off that trendline 3x so far:
-MARCH 2023
-OCTOBER 2023
-AUGUST 2024
We started OCT 7th week around 487 and closed end of week at 493.36
Based on technical analysis, QQQ is in a triangle pattern with the top trendline starting on JULY 17th and then hitting it again several other times:
-SEPT 26
-OCT 9
-OCT 10
-OCT 11
The bottom trendline starts on AUG 5th and touches again on:
-SEPT 6
-SEPT 9
-SEPT 10
-SEPT 11
Another TL was drawn on SEPT 11 up which price has been respecting:
-OCT 2
-OCT 3
-OCT 4
-OCT 7
-OCT 8
-OCT 11
This has cause price to get tighter and tighter against JULY 17th TOP TL.
In addition, price has been making Higher Lows (HL) and Higher Highs (HH) starting from AUG 5th until current date. The following are the HH/HL:
HL: AUG 5/ SEPT 6 - 11 / OCT 1 - 3
HH: AUG 22 / SEPT 26 / OCT 11
The GAP that was created between JULY 16 - 17 was filled on SEPT 26 causing the market to GAP REJECT and push price down.
Price has once again come back to that gap and closed above it.
GAPS can be used in several ways. One being the initial rejection. As price is back above it again, what was once resistance / supply can now be potentially turned into support / demand. The second method can be the INVERSION of a GAP.
Utilizing my longer thesis from last week along with the new / current data, a bullish sentiment is formed going into this week for the following reason:
-Two bottom TLs have been respected and acted as support
-Higher Lows/Higher Highs are being made
-Price closed above the GAP that that acted initially as resistance and now turned into support (inversion)
-No economic catalyst for bearish scenario 'yet'
-Price had a strong close above the 5 and 8 EMA on the daily time frame.
Price Targets:
PT1: $498.44
PT2: $500
PT3: $501.01
PT4: $503.07
PT5: $503.52
PT6: $505
This is NOT financial advice but my opinion on the market.
NASDAQ:AAPL NASDAQ:AMZN NASDAQ:QQQ NYSE:ES SP:SPX #thestrat SEED_ALEXDRAYM_SHORTINTEREST2:NQ AMEX:SPY SEED_ALEXDRAYM_SHORTINTEREST2:NQ NASDAQ:MSFT NASDAQ:TSLA NASDAQ:NVDA NASDAQ:AMD
SaD

Berkshire Hathaway Testing Crucial Levels: Will the Bulls WIN? Berkshire Hathaway (BRK.B) is approaching key levels that could dictate its next big move!
Upside Potential : A break above $465.04 could push the stock toward the next target at $473.18, where bulls are likely to step in for a rally. Watch for increased momentum if price closes above these resistance levels.
Downside Risk: If the stock fails to hold the current support around $459, a drop toward the lower support zone at $448.29 could be in play. Bears should be ready for action if the price breaks below this level.
Stay sharp, traders—both scenarios present strong opportunities. Keep an eye on price action and volume!
Happy Trading
Mindbloome Trader

Meta (META) Testing Key Levels: Breakout or Breakdown? Evening Traders
Meta (META) is currently trading in a key range, and the next move could be significant! 📊
Upside Potential: If META breaks above the critical resistance at $596, we could see a rally toward the next target of $600.44. 📈 Bulls should watch for momentum above this level as a potential breakout zone.
Downside Risk: A failure to hold the current support at $582.99 could see META retrace toward the next major support at $569.35. 📉 Bears will be eyeing a break below this level for further downside action.
Stay alert for a strong move in either direction! This chart is loaded with opportunities for both bulls and bears. 🔥
Mindbloome Trader
Happy Trading :)

$MNDY - MONDAYNASDAQ:MNDY - Breakout
After an initial increase of 45%, the price action consolidated with higher lows and reduced volatility (VCP).
Entry 284
Stop loss 273
TP1 30-50%: after 4-5 days
Then Stop follow up (visual) with EMA 10 or EMA 20
Let's see on Monday the price action :)

TESLA Breakdown or Bounce? Critical Levels You Cant Miss!!!!Tesla (TSLA) just broke below a critical level, and now all eyes are on the $213 support. 📉 If bulls defend this zone, we could see a strong bounce toward $236 and beyond. However, if we lose this support, expect a drop to the next target at $207 and possibly down to $189. 📉
⚡ Stay alert, traders—this could go either way! Watch for volume and price action around these levels. Are you ready to catch the move? 🚀
MB Trader

NVDA Breakout or Rejection? Major Levels to Watch NVDA is at a make-or-break point, and it’s time to pay attention! 🔥
Key Resistance:
👉 $137 is the line in the sand! A breakout above $137.49 could send NVDA rocketing higher. 📈
Key Support:
👀 If the rejection happens here, look for price to drop into the $132-$133 zone, where fresh opportunities might open for the bears. 📉
📌 Keep these levels on your radar — it’s shaping up to be a high-volatility move! Are you ready to take advantage? 🌊
MB Trader

Linc trying to link back to good times. Linc Ltd. engages in the manufacture and distribution of ball point pen. Its products include gel pen, ball pen, fountain pen, stationery, notebook, and files and folders. It operates through the Writing Instrument and Stationary segment. The company is the exclusive Indian selling agent of the premium pen range of Mitsubishi Pensils Company, Japan. Linc also have a similar arrangement with Besia, Taiwan to sell non-sharpening pensils and erasers. Linc Ltd CMP is 630.65. The Negative aspects of the company are Declining Net Cash Flow Promoter decreasing their shareholding, The positive aspects of the company are Company with No Debt, Company with Zero Promoter Pledge and FII / FPI or Institutions increasing their shareholding. Entry can be taken after closing above 646. Targets in the stock will be 664, 683 and 700. The long-term target in the stock will be 717, 740 and 760. Stop loss in the stock should be maintained at Closing below 578.
Disclaimer: The above information is provided for educational purpose, analysis and paper trading only. Please don't treat this as a buy or sell recommendation for the stock. We do not guarantee any success in highly volatile market or otherwise. Stock market investment is subject to market risks which include global and regional risks. We will not be responsible for any Profit or loss that may occur due to any financial decision taken based on any data provided in this message.

Bandhan Bank trying to change trend with volume.Bandhan Bank Ltd. engages in the provision of banking and financial services. It operates through the following segments: Treasury, Retail Banking, Corporate and Wholesale Banking, and Other Banking Business. Bandhan Bank Ltd CMP is 210.26. The Negative aspects of the company are MFs decreased their shareholding last quarter and Inefficient use of capital to generate profits - RoCE declining in the last 2 years. The positive aspects of the company are Company with Zero Promoter Pledge, Rising Net Cash Flow and Cash from Operating activity, Company with high TTM EPS Growth and Growth in Net Profit with increasing Profit Margin (QoQ). Entry can be taken after closing above 212. Targets in the stock will be 223 and 241. The long-term target in the stock will be 254 and 262. Stop loss in the stock should be maintained at Closing below 188 or 183.
Disclaimer: The above information is provided for educational purpose, analysis and paper trading only. Please don't treat this as a buy or sell recommendation for the stock. We do not guarantee any success in highly volatile market or otherwise. Stock market investment is subject to market risks which include global and regional risks. We will not be responsible for any Profit or loss that may occur due to any financial decision taken based on any data provided in this message.

Uber (UBER): What a ride!Uber (UBER): NYSE:UBER
We've recently added Uber to our portfolio, noting its astonishing 400% rise from the COVID-19 low of $13.71. This surge is significant, and we anticipate that in the current wave 3 we're experiencing, the price could reach between $101 and $201. The precise target seems to lean towards the $101 mark, aligning with the 161.8% extension level. Currently, the high is at $81.86. We expect a pullback in the coming days and weeks to between $59.40 and $52.46, corresponding to the 38.2% to 50% retracement levels.
There's a possibility of forming an Expanded Flat leading to wave 4, a pattern observed in waves 1 and 2, suggesting a potential deviation from the anticipated zigzag or other formations. Thus, surpassing the $81.86 mark would not be incorrect, provided it does not exceed the 138% threshold. Following this wave 4, we foresee the completion of wave 3 at a minimum of $101. A limit order will be placed at the first sign of weakness.

Swing Trade Opportunity - LONG WBAWBA has broken a long term downtrend line, creating a potential inverse HS in the process.
This company is due for a bounce at the very least.
Best case for longs is a longer term bottom and reversal being put in that can take us to the 200DMA or above.
See video for details

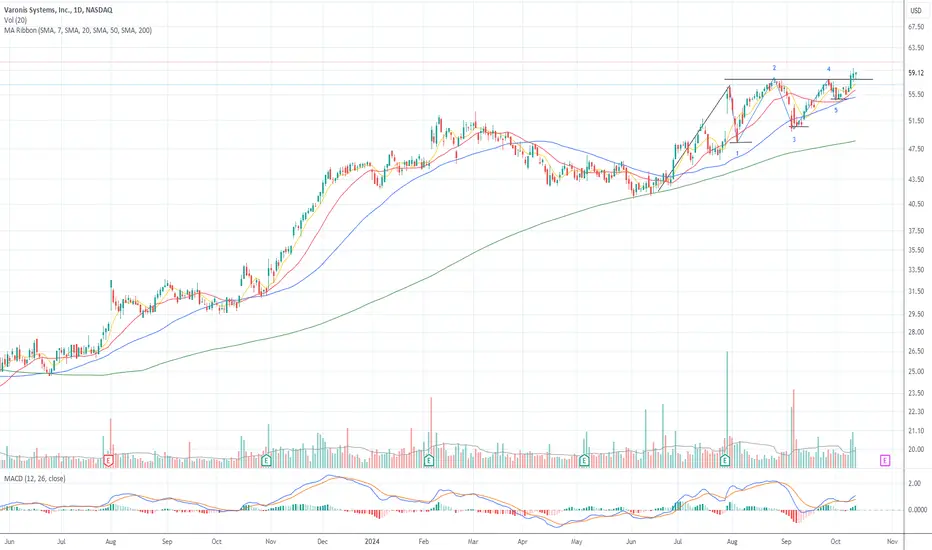
VRNS - VARONISVRNS - No Breakout yet
This is a leader +168% from 2023, a long cup & handle.
A recent consolidation with higher lows and volatility contraction (VCP).
It is just missing a big breakout that did not happen yesterday, will be cautious about that
Entry 57.15
Stop loss 55.55
TP1 30-50%: after 4-5 days
Stop follow up (visual) with EMA 10 or EMA 20
TESLA Can it reverse the ROBOTAXI DISASTER?Tesla (TSLA) plummeted on opening today following yesterday's Robotaxi event, dropping as much as -10% intra day below its 1D MA50 (blue trend-line) and touching the 1D MA100 (green trend-line) for the first time since August 05.
The market clearly considered the Robotaxi and the other aspects of the event a disaster fundamentally and the early impression is imprinted on this price collapse. The question on investors' minds is, can the company reverse the sentiment?
Well, technically there is a big reason why the price has been pulling back since the September 30 High and that is simple. It has been rejected exactly on the Lower Highs trend-line that started on Tesla's All Time High (ATH) back on November 04 2021.
As you can see, this powerful multi-year Resistance has already 5 rejections (red circles) under its belt. But on the bright side, the price has shown clear signs of reversing this long-term and the biggest is the Higher Lows since the January 06 2023 market bottom (the 2nd Higher Low on April 22 2024).
On top of that we are seeing the potential for a Channel Up (blue) since the April 22 2024 bottom and is being supported by the 1D MA100. Below that, the last (symmetrical) Support Zone is offered by the 1D MA200 (orange trend-line) and the 195.00 level (so a zone roughly within 195.00 - 203.00). Below that, the recovery potential is endangered to a great extent.
So to summarize, there are strong support levels that may cause yesterday's disastrous fundamental sentiment to reverse but most of all, Tesla needs to break above its ATH Lower Highs trend-line. If it does, the first target of the new Bullish Leg should be $380.00 (Higher High on the blue Channel Up).
-------------------------------------------------------------------------------
** Please LIKE 👍, FOLLOW ✅, SHARE 🙌 and COMMENT ✍ if you enjoy this idea! Also share your ideas and charts in the comments section below! This is best way to keep it relevant, support us, keep the content here free and allow the idea to reach as many people as possible. **
-------------------------------------------------------------------------------
💸💸💸💸💸💸
👇 👇 👇 👇 👇 👇

TESLA Local Long! Buy!
Hello,Traders!
TESLA is going down now
But the pair is trading in an
Uptrend so we are bullish
Biased and after the stock
Retests the horizontal
Support of 232.00$ we
Will be expecting a
Local bullish rebound
Buy!
Like, comment and subscribe to help us grow!
Check out other forecasts below too!

PUMA long trade (1 to 6 months)Puma is gonna benefit from nike's problems.
We are currently at a nice stable bottom. (support)
Buying season is coming.

Tesla (TSLA) Shares Fall After ‘We, Robot’ PresentationTesla (TSLA) Shares Fall After ‘We, Robot’ Presentation
On 10 October, at the Warner Brothers studio in Burbank, California, Elon Musk unveiled three products during the presentation of “We, Robot”:
→ Cybercab – an autonomous robotaxi that Musk claims will be produced in very large quantities.
→ Robovan – an autonomous bus capable of transporting 20 people or cargo, with an expected price tag of under $30,000.
→ Optimus Gen 2 – humanoid robots that participated in the event, with Musk showcasing a video of how Optimus can be used in home settings.
Elon Musk stated that Tesla anticipates the arrival of fully autonomous vehicles without supervision in Texas and California by next year.
Despite the revolutionary nature of the products presented under the Tesla brand, investors seem disappointed, as TSLA shares are trading around $225 in pre-market today, down from over $238 at yesterday's close.
Technical analysis of the Tesla (TSLA) stock chart indicates that the ascending channel (marked in purple), which has guided the price upward since August, may break downward at the market open today.
From a broader perspective, TSLA shares are within a wide ascending channel (shown in blue) – the bearish momentum following the “We, Robot” event could potentially push the price down to the lower boundary, further distancing it from resistance at the $260 level.
Investors may reevaluate their initial reactions to the unveiled Cybercab, Robovan, and Optimus. Nonetheless, the current decline in TSLA's stock price serves as a warning ahead of the earnings report scheduled for 23 October.
This article represents the opinion of the Companies operating under the FXOpen brand only. It is not to be construed as an offer, solicitation, or recommendation with respect to products and services provided by the Companies operating under the FXOpen brand, nor is it to be considered financial advice.

JOHNSON & JOHNSON Excellent confirmed sell signalJohnson & Johnson (JNJ) gave us the most optimal buy entry on our last call (April 17, see chart below) and easily hit our 157.50 Target:
Having been rejected early in September exactly at the top (Lower Highs trend-line) of the 2-year Channel Down and now establishing price action below its 1D MA50 (blue trend-line), this is a confirmed sell signal and the start of the Channel's 5th Bearish Leg. The RSI Lower Highs are common on all previous Channel tops.
Our Target is 141.00, which is on the Internal Lower Lows trend-line (formed by the last 2 Lower Lows) and still above the 1.236 Fibonacci extension.
-------------------------------------------------------------------------------
** Please LIKE 👍, FOLLOW ✅, SHARE 🙌 and COMMENT ✍ if you enjoy this idea! Also share your ideas and charts in the comments section below! This is best way to keep it relevant, support us, keep the content here free and allow the idea to reach as many people as possible. **
-------------------------------------------------------------------------------
💸💸💸💸💸💸
👇 👇 👇 👇 👇 👇

AMD: 4H Golden Cross is the best buy signal you can get.Advanced Micro Devices may be having a noticeable correction that turned the stock back to neutral both on the 4H and 1D technical outlook (RSI = 54.728, MACD = 5.610, ADX = 40.223) but it just formed the strongest bullish pattern of all: a Golden Cross on the 4H chart. In the past 2 years we've been given another two 4H Golden Crosses and both turned out to be the utmost bullish validation for enormous rallies, which in both cases extended at +141% from the bottom. We expect another such run and now we have the best confirmation (TP = 290.00).
## If you like our free content follow our profile to get more daily ideas. ##
## Comments and likes are greatly appreciated. ##

A touch of Sweetness...Alohaaaah! to All my beloved Kama'āina out There!
This one, was picked Especially for you
Very *affordable* to get a "slice" of the Action!!
It just Emerged from its trendline/ moving average. Buying interest increasing
What does the Trend look like, to you ? Big Picture?
May be coming back from the wildfire calamity perhaps.
Remember-
When life gives you pineapples just add rum.
Why did the pineapple go to the doctor? It wasn’t peeling well
How does a pineapple answer the phone? “Yellow!”
Why did the pineapple join the gym? To work on its core!
Let's make some $'s. And, again "Aloha," (Aloha means both hello and goodbye when you're bidding farewell".

Gilead Sciences (GILD): Pattern Still Intact—What’s the Plan?Let’s quickly review our open position in $GILD. We’ve managed to turn the whole chart around, and I hope everyone who bought in had the strength to sit it out. It was a close call with the stop loss, but now we’re up significantly, and we’ve moved our stop loss closer to $65.46. So far, we’re up 17%, and we don’t want to dictate when to take profits. If you’re in, do your own research and take profits whenever you feel comfortable—it's all up to you 👍.
If you take a closer look, you’ll see that NASDAQ:GILD has been following a nice upward pattern: a surge, then three candles down, then another surge. I’m not sure how long this pattern will hold, but as long as we don’t retrace too much, we should be fine. I also like that we’re respecting all the key levels. The RSI is about to be overbought, so we might see another three candles down, but this time it could be a deeper pullback.
We’ll see how it plays out, but we’re very pleased with this swing trade so far. Congratulations to everyone who’s been riding this wave 🍾.
