TESLA WILL GO DOWN|SHORT|
✅TESLA is going up now
But a strong resistance level is ahead at 336$
Thus I am expecting a pullback
And a move down towards the target of 320$
SHORT🔥
✅Like and subscribe to never miss a new idea!✅
Disclosure: I am part of Trade Nation's Influencer program and receive a monthly fee for using their TradingView charts in my analysis.
Stocks

Taking profit on GE Aerospace stock to buy in lower after summerIt's clear NYSE:GE has hit overbought, it's the perfect time to take profits now. Less stress managing stocks over the summer too lol...
$196 is the 0.618 level I'm aiming to re-enter, there's also decent support near that level $190 to $200

Looking to take profits on Microsoft that's severely overboughtThis summer most stocks will lose their momentum making it a great time to take profits. We got into NASDAQ:MSFT at an average of $$350-375, it's time to sell at least half to 75% of the stack then buy back around the 0.618 golden fibonacci at $400 after the gap is filled.

SPY (S&P500) - Price Testing Support Trendline - Daily ChartSPY (S&P500 ETF) price has just closed below $600 and is currently under a support trendline.
If price cannot breakout above the $600 and $605 resistance level this month, a pullback could occur down to the support zone.
SPY price could potentially pullback to various levels of support due to:
-USA domestic conflict
-International military conflicts
-Technical chart bearish divergence
-USA federal reserve interest rate news
-Government and corporate news
Support Levels: $595, $590, $585, $580.
Resistance Levels: $600, $605, $610, $615.
The 50EMA/200EMA Golden Cross is still on-going, and support prices of $580 and $568 have yet to be tested significantly.

SHORT SP500fundamental : negative dollar
Techniq: respecting 15M BEARISH GAP
OB = BB
SSL still not taken

GE Vernova Inc. (GEV) – Powering the Global Energy TransitionCompany Overview:
GE Vernova NYSE:GEV is becoming a cornerstone of the global clean energy shift, providing advanced power generation, transmission, and renewable energy technologies that are now mission-critical for national energy strategies.
Key Catalysts:
Explosive Electrification Growth ⚡
Grid Solutions backlog tripled YoY, driven by demand for modern, resilient, and clean grids.
HVDC & FACTS technologies place GEV at the forefront of a global multi-decade grid overhaul.
Recurring Revenue from Wind Repowering 🌬️
1 GW of upgraded capacity in 2024 under the Repower program.
GEV operates the most widely installed wind platform in the U.S., giving it dominance in the high-margin retrofit market.
Strategic Manufacturing Expansion 🏭
$600M+ in investments across Florida and India expand capacity and de-risk the supply chain.
Supports global demand from infrastructure stimulus and decarbonization mandates.
Investment Outlook:
Bullish Case: We are bullish on GEV above $410.00–$415.00, as clean energy investment accelerates.
Upside Potential: Price target of $600.00–$610.00, backed by order momentum, retrofit leadership, and global energy reform.
🔋 GE Vernova – Electrifying the Future. #GEV #CleanEnergy #GridModernization #WindPower

ADM 1D: 10-Month Channel Says Goodbye?Since July 18, 2024, ADM had been locked in a clean downward channel — well-behaved, well-respected. But in May 2025, the structure finally cracked: price broke out, crossed above the 50-day MA, and pulled back for a textbook retest right on the channel’s upper edge. So far, the breakout is holding. The next targets sit at 50.6 (0.618), 53.5 (0.5), and 56.5 (0.382). As long as price stays outside the channel, the bullish structure remains intact.
Connor’s RSI down below is quietly doing its job — already bounced from deep oversold, now curling up with momentum. It’s not flashy, but in this context it signals early strength before the crowd notices.
Fundamentally, ADM is still cleaning up after the early-2024 accounting scandal that nuked investor trust. But management moved fast: reinstated buybacks, tightened guidance, and Q1 2025 came in strong — $22.6B revenue, $0.88 EPS, both beating expectations. ADM remains a pillar of the U.S. ag sector, and in an era of global food anxiety, that means structural demand isn’t going anywhere.
Вот адаптированный перевод финального блока под **английский пост**, в том же живом и профессиональном стиле:
Enjoyed the idea? Like, share, and drop your thoughts in the comments.
It helps keep the content visible, free, and accessible to everyone.
Got your own charts or takes? Let’s discuss them below.

TESLA Will Fall! Sell!
Hello,Traders!
TESLA went up from the
Horizontal support but has
Hit a horizontal resistance
Of 335$ and we are already
Seeing a bearish pullback
So we will be expecting
A further local move down today
Sell!
Comment and subscribe to help us grow!
Check out other forecasts below too!
Disclosure: I am part of Trade Nation's Influencer program and receive a monthly fee for using their TradingView charts in my analysis.

Nightly $SPY / $SPX Scenarios for June 13, 2025 🔮 Nightly AMEX:SPY / SP:SPX Scenarios for June 13, 2025 🔮
🌍 Market-Moving News 🌍
🚨 Israel Strikes Iran — U.S. Markets Sell Off
Israel launched airstrikes on Iran’s nuclear and military facilities, triggering a sharp risk-off move in global markets. U.S. stock futures slid over 1%, driven by a drop in equities and a surge in safe-haven assets
🛢️ Oil Prices Surge 7–8% on Supply Fears
Brent crude jumped over 7%, reaching ~$74.65/barrel, while WTI rose nearly 8%—the strongest move since early May. The sudden energy-price spike reflects heightened fears of supply disruptions in the Middle East
💱 Dollar & Safe Havens Climb
True to form, the U.S. dollar, Japanese yen, Swiss franc, gold, and Treasuries rallied as investors moved to the safety of low-risk assets amid escalating geopolitical uncertainty
📊 Key Data Releases 📊
📅 Friday, June 13
(No scheduled U.S. economic data)
Data flow will take a backseat as markets digest geopolitical developments and await the weekend.
⚠️ Disclaimer:
This information is for educational and informational purposes only and should not be construed as financial advice. Always consult a licensed financial advisor before making investment decisions.
📌 #trading #stockmarket #geopolitics #oil #safety #charting #technicalanalysis

$SMCI "Buy The Dip" Value AreaSMCI (Super Micro Computer) has weathered the storm from all the negative press and I believe it is poised to go on a big run. This $26-$47 area is the BEST value you are going to get on it. This is probably the last discount before takeoff. We may not see this level again. As NVDA continues to fly, so will SMCI. Always do your own DD.

Strongest stock of the day with 3 Buy $CGTL1st and 3rd alert paid for the whole day, including 2nd which was cut quick at $1.70

NVO Soaring Towards TargetsOur NVO call debit spreads and LEAPS options soaring towards targets at the 233 EMA here.
Beautiful thing when fundamentals, valuations and technicals align.
Impulse move from the bottom gave us a hat trick - triple green tags (white circles) for bullish A+ momentum signals into a consolidation period in which we built our position and added on the consolidation breakout

APPLE: 3 year Channel Up targets $285.Apple is marginally bearish on its 1D technical outlook (RSI = 43.788, MACD = -0.260, ADX = 30.978) as the recent weakness impeded the price from making the decisive bullish break-out above it. The 1W RSI structure though indicates that this is a bottom formation and it is evident on the Channel Up that the April 7th low has been the start of the new bullish wave. The first bullish wave which also started after a -32% correction, made a first peak on the 1.236 Fibonacci extension. We are bullish on Apple long term, TP = 285.00.
## If you like our free content follow our profile to get more daily ideas. ##
## Comments and likes are greatly appreciated. ##

Small Stocks vs. GoldThis index represents small caps minus big caps, divided by gold. A good representation of how small companies in USA are doing related to gold (hard asset). You could argue that this is more representing of real economy and it's health.

Rocket (RKLB) From Launch Innovator to Space Systems PowerhouseCompany Evolution:
Rocket Lab NASDAQ:RKLB is transforming into a vertically integrated space and defense systems company, leveraging its launch heritage to build long-term, diversified revenue streams.
Key Catalysts:
Rapid Launch Cadence 🛰️
3 Electron launches in 24 days demonstrate operational agility and scalability.
Meets rising demand for high-frequency satellite constellation deployments.
Strategic GEOST Acquisition 🛡️
$275M deal expands into electro-optical and infrared payloads, key for defense/ISR.
Boosts margin profile, backlog durability, and government contract appeal.
Validated Execution & Recurring Revenue 💼
100% mission success rate and multi-launch contract with Japan's iQPS reinforce credibility.
Positions RKLB for long-term cash flow stability and multiyear contract wins.
Investment Outlook:
📈 Bullish above $23.00–$24.00, backed by high reliability and strategic expansion.
🎯 Price Target: $42.00–$43.00, reflecting an expanding TAM, defense sector momentum, and vertically integrated execution.
🌠 RKLB is no longer just reaching orbit—it's building the infrastructure of space. #RKLB #SpaceStocks #DefenseGrowth

TSLA Short Entry | Recession UnderwayI have added to NASDAQ:TSLA short.
I have also linked my previous Tesla short chart from 2022.
Nothing has changed with Tesla. The company is severely over-valued.
I will continue to provide updates.

S&P 500 Breaks Out — Trump, Tariffs & Bullish Island PatternDonald Trump has mentioned the US stock market in every meeting he has held in the past few days, which has caused the US stock market indices , including the S&P500 Index ( SP:SPX ), to rise:
"Better go out and buy stocks now".
President Donald Trump told a crowd in Saudi Arabia on Tuesday that the markets are just getting started. “It’s going to get a lot higher,” he said, right as the S&P 500 posted its first gain since late February.
But one of the main reasons for the increase in the S&P 500 Index and US stocks is The United States has dropped its tariffs on Chinese goods to 30% , down from a brutal 145% , while China is slashing its own duties on US imports to just 10% , temporarily, for the next 90 days .
-------------------------------------------------
Now let's take a look at the S&P 500 Index chart on the daily time frame .
S&P500 Index managed to break the Resistance zone($5,737_$5,506) and 21_SMA(Weekly) by Breakaway Gap .
In terms of Classic Technical Analysis , the S&P500 Index has managed to form a Bullish Long Island Pattern , and this pattern is one of the continuing patterns and will be a sign of the continuation of the S&P500 Index's upward trend .
In terms of Elliott Wave theory , it seems that the S&P500 index has completed the corrective wave and is in new impulsive waves , which could cause a new All-Time High(ATH) to form.
I expect the S&P500 index to increase by at least +5% as it approaches the Uptrend line , and we will see the possibility of a new ATH .
Please respect each other's ideas and express them politely if you agree or disagree.
S&P 500 Index Analyze (SPX500USD), Daily time frame.
Be sure to follow the updated ideas.
Do not forget to put a Stop loss for your positions (For every position you want to open).
Please follow your strategy and updates; this is just my Idea, and I will gladly see your ideas in this post.
Please do not forget the ✅' like '✅ button 🙏😊 & Share it with your friends; thanks, and Trade safe.

WALMART testing its 1D MA50! Will it bounce?Walmart (WMT) hit yesterday its 1D MA50 (blue trend-line) for the first time since April 21. It appears that the rebound from the Trade War Low has turned sideways on a Double Top formation and the 1D MA50 is the first Support to be tested, with the 1D MA200 (orange trend-line) following.
This pattern resembles the August - September 2022 Bull Flag, which despite breaking below its 1D MA50, it resumed the uptrend shortly after and hit the 1.382 Fibonacci extension before the next 1D MA50 pull-back.
As a result, we expect the stock to reach $110.00 (Fib 1.382) by the end of the Summer.
-------------------------------------------------------------------------------
** Please LIKE 👍, FOLLOW ✅, SHARE 🙌 and COMMENT ✍ if you enjoy this idea! Also share your ideas and charts in the comments section below! This is best way to keep it relevant, support us, keep the content here free and allow the idea to reach as many people as possible. **
-------------------------------------------------------------------------------
💸💸💸💸💸💸
👇 👇 👇 👇 👇 👇

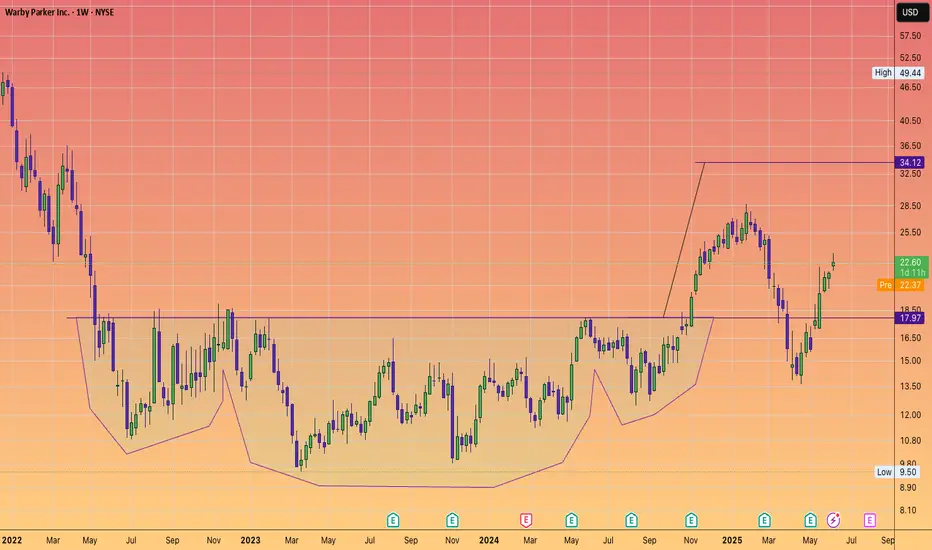
WARBY PARKER to continue its recovery to $34 and beyond#inverseheadandshoulders
They want to have 900 retail locations
currently operating 271 in the US and 5 in Canada.
Intel (INTC) Shares Drop Over 6% in a DayIntel (INTC) Shares Drop Over 6% in a Day
As shown on the Intel (INTC) chart, after Tuesday’s candle closed above $21, the price dropped sharply on Wednesday. INTC was the worst-performing stock of the day among the components of the S&P 500 index (US SPX 500 mini on FXOpen).
Why Did INTC Shares Fall?
The decline is linked to growing competitive pressure. According to media reports:
→ On one hand, AMD continues to rapidly expand its share of the server CPU market. A report by Mercury shows that the company already controls 40% of the segment and could match Intel as early as next year.
→ On the other hand, Nvidia is preparing to launch two accelerated processing units (APUs) for the consumer market, which will combine CPU and GPU capabilities in a single product.
Technical Analysis of the INTC Chart
In 2025, the price remains:
→ within a broad downward trend (marked in red);
→ supported by the $18.50–$20 zone.
Meanwhile, price fluctuations in May and June are forming a narrowing triangle (marked in black). Following the recent negative news, it is possible that INTC shares could fall towards the lower boundary of the triangle — or even retest the psychologically important $20 level.
This article represents the opinion of the Companies operating under the FXOpen brand only. It is not to be construed as an offer, solicitation, or recommendation with respect to products and services provided by the Companies operating under the FXOpen brand, nor is it to be considered financial advice.

Why? Because liquidity is building at this support zone.🚨 GBP/JPY Traders — Don’t Get Trapped! 🚨
GBP/JPY has just touched a major support level, and on the surface, it looks like a golden buying opportunity. But here’s the catch: this is exactly where most retail traders get trapped.
Why? Because liquidity is building at this support zone. Smart money knows retail traders have stop losses and pending orders sitting right below — and they’re coming for it. 🧠💰
Here’s what the market is likely to do next:
📈 Step 1: A small bullish bounce to lure retail traders in. Everyone starts thinking, “This is the reversal!”
🔄 Step 2: Boom — a sharp move down. Stop hunts. Fakeouts. Panic sells. The market dips below support, grabbing liquidity.
🚀 Step 3: Once liquidity is swept and BPR (Break Point Range) is hit, then the real move begins.
This is a classic setup — trap retail, feed institutional orders, and then drive the market in the true direction.
⚠️ Don’t fall for the bait. Stay patient. Let the trap spring before you strike.
📊 Watch structure. Watch liquidity. Watch price behavior. That’s where the edge is.
DYOR — Do Your Own Research. This isn’t financial advice — it’s a trader’s insight.
Trade smart. Trade sharp. 💼🔥

Last week Bitcoin created massive liquidity at a key resistance!🚨 Bitcoin Update – A Bullish Storm Is Brewing? 💥
Last week, Bitcoin created massive liquidity at a key resistance zone, and guess what? That liquidity is still untouched. The market hasn’t fully tapped into it yet — and that’s a big deal.
Recently, BTC smashed through resistance and even left behind a Bullish Fair Value Gap (FVG), signaling strength. But hold on—after this breakout, the market is showing signs of a minor pullback, likely to retest its marked IRL (Important Reaction Level).
📉 It’s cooling off temporarily... but don’t blink. This zone could act as a springboard for the next big leg up.
💡 Here’s the kicker: there’s still a ton of liquidity waiting above. If the market wants it—and it usually does—there’s a high probability (80%+) of another bullish push.
👀 Watch this area closely. It’s a make-or-break zone.
📊 Do Your Own Research (DYOR) – this is not financial advice, just a friendly nudge from the charts.

Lemonade Inc.: Breakout in Motion — Cup, Flag, and No BrakesLemonade Inc. (LMND) is accelerating after a clean breakout from a textbook cup with handle pattern, where the handle formed as a tight bullish flag. The breakout occurred around $32, and since then, price action has been sharp, controlled, and uncorrected — currently trading at $42.42 with buyers clearly in charge.
On the fundamental side, LMND is moving through a recovery phase: operational losses are narrowing, revenue is stabilizing, and the company is aggressively leveraging AI to automate its insurance processes. Expansion into Europe continues, and institutional interest is visibly rising — confirmed by volume building alongside price. Within the insuretech sector, LMND is starting to look like a comeback story rather than a cautionary tale.
Technically, the setup remains strong:
– Golden Cross confirmed (EMA50 crossing EMA200)
– EMA50/100/200 all below price — bullish structure firmly intact
– Volume expanding on up-days — healthy confirmation
– RSI hovering in the 60–65 range — momentum is intact, no signs of exhaustion
Targets remain aligned with the structure:
– tp1 = $64 — measured move from the flag
– tp2 = $94 — full realization of the cup pattern
Tactically, this is no longer a “wait and see” setup — the move is in progress. No correction so far, only continuation. Momentum traders may consider entries into strength. Above $45, the move could accelerate further as more participants recognize the structure.
LMND is showing technical and fundamental alignment — confirmed breakout, improving narrative, and strong trend structure. While the impulse holds, this chart favors continuation, not hesitation.
