SPY SHORT FROM RESISTANCE|
✅SPY went up to retest
A horizontal resistance of 610$
Which is also an All-Time-High
So its a very strong level
Which makes me locally bearish biased
And I think that we will see a pullback
And a move down from the level
Towards the target below at 596.43$
SHORT🔥
✅Like and subscribe to never miss a new idea!✅
Disclosure: I am part of Trade Nation's Influencer program and receive a monthly fee for using their TradingView charts in my analysis.
Stocks

META: Close to a 1D Golden Cross. Strong buy.META is almost overbought on its 1D technical outlook (RSI = 69.797, MACD = 30.360, ADX = 40.237) but is about to form a 1D Golden Cross, the first such pattern since March 1st 2023, which was a little after the November 2022 market bottom. The market technically thrives on such conditions and since 2019, the 3 Golden Cross patterns that were formed were bullish continuation formations. Based on the 1W RSI, the current Golden Cross might be more similar with the June 2nd 2020 Golden Cross that was formed after the COVID crash. It rose by +123.42% before pulling back to the 1D MA200 again, so we remain bullish on META with TP = 1,000.
## If you like our free content follow our profile to get more daily ideas. ##
## Comments and likes are greatly appreciated. ##

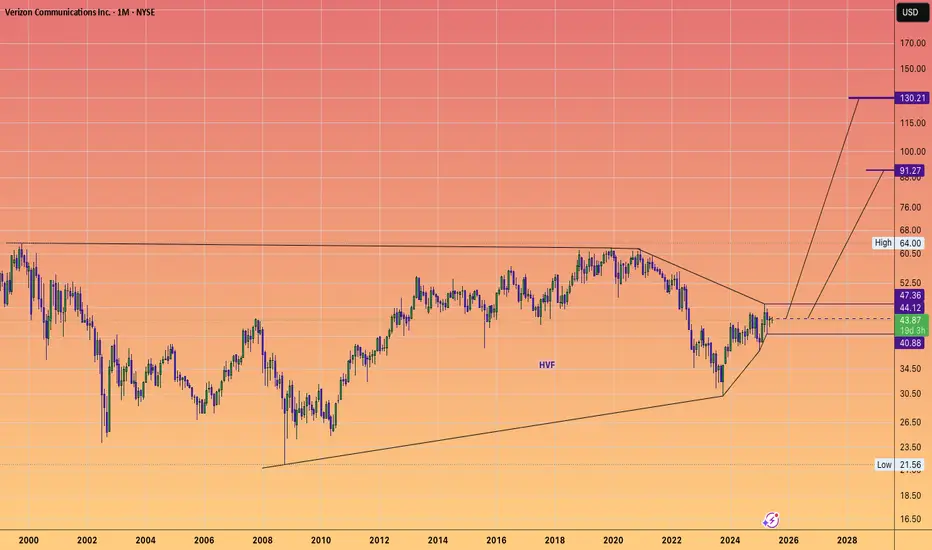
VERIZON will run up to $130It's not me
it's the chart that says it will
#HVF
#HuntVolatiltyFunnel
@FrancisHunt-TheMarketSnipe
@TheMarketSniper
@TheCryptoSniper
Just crazy $XTIA in minutesFrom halt to halt, doubling on power volume. It started the year at $60 seems like traders are looking at that as they're buying into vertical.

NQ (Nasdaq) Futures Trading Levels [6/11/25]For Day Traders, here's some trading levels for NQ Futures Trading for today. It's CPI day, so we should get some nice swings today. Trade carefully and trade smart!

ELI LILLY Is starting its next big rally.Eli Lilly (LLY) is about to test its 1W MA50 (blue trend-line) following a rebound just below the 1W MA100 (green trend-line). The latter, has been the ultimate market Support since May 2018 (last time it broke below it).
The overall correction since the July 15 2024 High seems like a Bull Flag pattern, no different than all the others after 2018 which only served as healthy rebalancing of an overbought price action.
Based on he 1W RSI in particular and the Bullish Divergence it displayed, the current Bull Flag resembles more the March - October 2019 pattern. Both that and the next one reached their 2.0 Fibonacci extensions.
As a result, our long-term Target on LLY is just below the 2.0 Fib at $1300.
-------------------------------------------------------------------------------
** Please LIKE 👍, FOLLOW ✅, SHARE 🙌 and COMMENT ✍ if you enjoy this idea! Also share your ideas and charts in the comments section below! This is best way to keep it relevant, support us, keep the content here free and allow the idea to reach as many people as possible. **
-------------------------------------------------------------------------------
💸💸💸💸💸💸
👇 👇 👇 👇 👇 👇

GAIL 1H Chart Analysis (Trendline Breakout Setup)NSE:GAIL GAIL 1H Chart Analysis (Trendline Breakout Setup)
The 1-hour chart of GAIL (India) Ltd shows a clean descending trendline breakout followed by higher lows, indicating strength building up. The price is consolidating just below a horizontal resistance around ₹193, forming a potential ascending triangle pattern.
Trendline Breakout:
Price has broken a long-standing descending trendline.
Retest and higher lows have followed the breakout, showing bullish intent.
Ascending Triangle Pattern:
Horizontal resistance near ₹193 is tested multiple times.
Rising trendline support suggests buyers are becoming aggressive.
Volume Confirmation Needed:
A breakout above ₹193.10 with volume would validate the bullish setup.
Trade Setup:
Buy Entry: Above ₹193.10 (confirmed breakout
Stop Loss: Below ₹190.00 (below rising trendline) CLOSING BASIS
Target 1: ₹196.85 (resistance zone)
Target 2: ₹204.50 (swing high)
The combination of trendline breakout and ascending triangle formation indicates a strong bullish continuation setup. Entry above ₹193.10 is ideal after confirmation, with targets up to ₹204 and risk well-managed below ₹190.
Disclaimer: I am not a SEBI-registered advisor. The analysis shared is purely for educational and informational purposes only. Please consult your financial advisor before making any investment or trading decision. Trading and investing in the stock market involves financial risk. The author will not be held responsible for any losses incurred.
@thetradeforecast
NSE:GAIL NSE:NIFTY

US100 Local Short! Sell!
Hello,Traders!
US100 keeps growing but
The index will soon hit a
Horizontal resistance
Of 22,243 so after the
Retest we will be expecting
A local pullback and a
Local move down
Sell!
Comment and subscribe to help us grow!
Check out other forecasts below too!
Disclosure: I am part of Trade Nation's Influencer program and receive a monthly fee for using their TradingView charts in my analysis.

PayPal: Rebound or Rerun?PayPal in 2025: A breakout with backbone or just another spineless fintech?
PayPal is still in the rehabilitation ward after its fall from grace in 2021. Management drama, growth slowdown — the full fintech fatigue package. But something has shifted behind the scenes. A new CEO is cutting costs, AI integration is being whispered about, and earnings have started to surprise again. Wall Street pretends not to notice — but volume tells a different story.
Technically, we’re looking at a well-formed inverse head and shoulders. The neckline stretches from $72.00 to $74.76, aligning with the 0.5 Fibonacci level. A confirmed breakout above this zone opens the path to a clear target at $93.66 — the 1.0 Fibonacci extension. Multiple EMA clusters and strong pattern symmetry reinforce the setup. But no fairy tales here: the real entry comes after a retest. Without confirmation, it’s just another pretty formation for chart enthusiasts.

Nightly $SPY / $SPX Scenarios for June 11, 2025🔮 Nightly AMEX:SPY / SP:SPX Scenarios for June 11, 2025 🔮
🌍 Market-Moving News 🌍
🤝 Cautious Optimism on U.S.–China Trade Progress
Markets responded positively to fresh developments in ongoing U.S.–China trade talks, with S&P 500 and Nasdaq closing ~0.6% higher — the third straight day of gains — on hopes of easing trade barriers
📉 Treasury Yields Climb as Auction Approaches
Bond investors grew cautious ahead of a key Treasury debt auction and incoming U.S. inflation data. The 10-year yield stayed elevated, weighing modestly on equities .
💹 Global Markets Showing Resilience
Asian and European markets tracked U.S. gains midweek, driven by trade-talk optimism, despite lingering concerns over slower global growth and debt levels .
📊 Key Data Releases 📊
📅 Wednesday, June 11:
(No major U.S. releases — focus remains on market reactions to trade talks and Treasury auctions.)
⚠️ Disclaimer:
This information is for educational and informational purposes only and should not be construed as financial advice. Always consult a licensed financial advisor before making investment decisions.
📌 #trading #stockmarket #economy #news #trendtao #charting #technicalanalysis

1,505% from $0.20 to $3.21 on massive 1+ Billion volume $KLTOWOW 🤯 1,505% from $0.20 to $3.21 on massive 1+ Billion shares traded 🚀 NASDAQ:KLTO
I sent out 2 Buy Alerts for everyone to get paid nicely ✅
This will trigger more runners, premarket already got movers NASDAQ:MEGL , NASDAQ:MRIN , NASDAQ:EVGN

Nasdaq-100 (NDX) Weekly Chart 2025 Chart Context
This weekly timeframe analysis of the Nasdaq-100 Index (NDX) forms a key pillar in our 2025 macro analysis series. Following the breakout structure seen in TOTAL, TOTAL2, BTC.D, and US10Y, this chart utilizes 2 Fibonacci tools (1 trend-based extensions and 1 retracement) to project potential corrective and expansion scenarios.
Fibonacci Tools Used:
Fibonacci Retracement : Applies to the recent smaller swing to determine micro retracement zones and cluster supports.
0=20674 and 100=10504
Trend-Based Fibonacci Extension: Drawn using a three-leg structure (point A= 3993 to B=16724 to C10504) to forecast upside targets beyond ATH.
All take-profit (TP) levels: TP1 (~23,400), TP2 (~26,700), and TP3 (~30,344.49)—are located at confluence zones where Fibonacci levels from different tools align, reinforcing their validity and strength.
There is a 4TP above all the Visible TPs
Key price references:
0% retracement: ~20,674.71
Next Resistance ~23,400 (confluence of extensions and psychological resistance)
Projected TPs:
1TP=~23,400,
2TP=~26,700,
3TP=~30,344.49,
4TP=44000
Support/Resistance:
Red zone: ~16,700–18,300 (historical S/R and correction target and Fib Confluences)
Resistance zone: ~23,000–23,400 ,
22000(ATH area)
Key Technical Observations:
Fibonacci Retracement from ~20674 to ~15732 marks the initial corrective range.
Trend-Based Extensions forecast:
TP1 (~23,400): First breakout resistance
TP2 (~26,700): Medium-term expansion zone
TP3 (~30,344): Long-term target if macro tailwinds persist
Scenario Pathways:
Bullish Continuation: Breaks above ATH to reach TP2/TP3
Healthy Correction: Pullback to ~20,600 or deeper ~18,300 before resumption
Deep Correction: Revisits ~16,700 zone if macro environment deteriorates
Fundamental Context:
Tech Stocks & Economic Sentiment: NDX is often the first to move during liquidity expansions. Its performance signals risk-on behavior across global equity markets.
Rate Cuts in 2025: With anticipated Fed rate cuts, tech stocks are primed for inflows. Forward earnings valuations rise, justifying extended upside in high-beta tech.
AI Boom & Earnings Growth: Nasdaq is heavily weighted toward AI, cloud, and semiconductors—sectors expected to lead earnings surprises.
NDX Influence on Gold and Crypto
When NDX rallies:
Crypto: Risk appetite improves. Capital rotation flows into altcoins and layer-1 assets.
Bitcoin: Often sees parallel inflows, especially during strong tech rallies (e.g., 2020).
TOTAL & TOTAL3: Begin breakout patterns if NDX continues to surge.
Gold: May stall or correct as investors favor risk assets. However, gold still holds due to macro hedging and real yield pressures.
When NDX corrects:
Crypto: Volatility spikes. Altcoins bleed faster.
Bitcoin: Short-term dip but may decouple if viewed as digital gold.
Gold: Benefits from flight-to-safety behavior.
US10Y: Often reacts inversely to NDX moves—used for confirmation.
Search Highlights (2024–2025):
Institutions view NDX correction as signal to rotate into commodities (incl. gold).
Cross-market correlations show NDX peaks often precede crypto mini-rallies.
De-risking from NDX often triggers gold strength, especially in geopolitical or inflationary backdrops.
Bias & Strategy Implication
Primary Bias: Bullish
Expecting upside continuation to 26,700–30,000 zone
Multiple correction opportunities are present even during rally
Strategic Actions:
Monitor for correction to yellow/red zones for accumulation
Use NDX behavior as leading macro signal for crypto rotations
Watch resistance at 23,400 closely; breakout confirms trend extension
Time Horizon
Short-Term (1–2 months): Watch for breakout or correction to ~20,600–18,300
Mid-Term (3–6 months): Probable test of ~26,700
Long-Term (6–12 months): Potential expansion to ~30,344.49

Nightly $SPY / $SPX Scenarios for June 10, 2025🔮 Nightly AMEX:SPY / SP:SPX Scenarios for June 10, 2025 🔮
🌍 Market-Moving News 🌍
📱 Apple Disappoints at WWDC Keynote
Apple ( NASDAQ:AAPL ) faced criticism after a lackluster WWDC keynote. Major AI and Siri upgrades were delayed, prompting a 1–1.5% drop in Apple shares—the weakest move during today's presentation
🎮 GameStop to Report Q1, Crypto Pivot in Focus
GameStop ( NYSE:GME ) is scheduled to announce Q1 earnings after market close. Investors will be watching for updates on its $500M Bitcoin allocation and potential crypto-related strategies
📈 Small-Business Optimism Rises
The NFIB Small Business Optimism Index for May came in at 95.9—above the 94.9 consensus—showing modest improvement in sentiment among small firms
📊 Key Data Releases & Events 📊
📅 Tuesday, June 10:
6:00 AM ET – NFIB Small Business Optimism (May):
A reading above expectations could boost risk market sentiment by showing stronger Main Street confidence.
⚠️ Disclaimer:
This is for educational/informational purposes only and does not constitute financial advice. Please consult a licensed professional before making investment decisions.
📌 #trading #stockmarket #economy #news #trendtao #charting #technicalanalysis

BIG 441% Monday from $0.60 to $3.25 $OMH🔥 BIG 441% Monday from $0.60 to $3.25
Easiest money made today was on NASDAQ:OMH buy before halt, then once it came out of halt it was just gapped up into 💸💸💸

$ELV, Long, TP>10-15%NYSE:ELV , Long, TP>10-15%
Fundamentally the stock is good.
Choose an entry point and do not forget about a protective order if you are trading with leverage.
Don't risk it if you're not sure.
Good luck to everyone.

$FI, Long, TP>15-20%NYSE:FI , Long, TP>15-20%
Fundamentally the stock is good.
Choose an entry point and do not forget about a protective order if you are trading with leverage.
Don't risk it if you're not sure.
Good luck to everyone.

Review and plan for 10th June 2025 Nifty future and banknifty future analysis and intraday plan.
Positional ideas.
This video is for information/education purpose only. you are 100% responsible for any actions you take by reading/viewing this post.
please consult your financial advisor before taking any action.
----Vinaykumar hiremath, CMT

Apple (AAPL) Shares Consolidate Ahead of WWDCApple (AAPL) Shares Consolidate Ahead of WWDC
Today, 9 June, marks the start of Apple’s Worldwide Developers Conference (WWDC) — an event that traditionally attracts significant attention from investors and traders.
It is fair to say that WWDC 2025 begins against a rather negative backdrop:
→ Since the start of 2025, AAPL stock price has fallen by 19%, and Apple has lost its title as the world’s most valuable company, now trailing behind Microsoft and Nvidia.
→ Expectations raised by last year’s conference — particularly regarding new AI features in the iPhone — were not fully realised. As Barron’s noted, in March, an Apple spokesperson admitted that the new Siri “will take longer than we thought to implement these features. We expect to roll them out next year.”
Technical Analysis of the AAPL Chart
AAPL price movements are forming a narrowing triangle pattern:
→ The red trendline highlights sustained downward pressure on AAPL shares in 2025 — partly driven by concerns over the impact of the ongoing trade war;
→ On the other hand, the area below the psychological $200 level may attract buyers willing to take on risk.
WWDC 2025 could well provide fresh hope for the bulls and prompt an attempt to break out upwards from the triangle pattern.
This article represents the opinion of the Companies operating under the FXOpen brand only. It is not to be construed as an offer, solicitation, or recommendation with respect to products and services provided by the Companies operating under the FXOpen brand, nor is it to be considered financial advice.

NAS100 - Will the stock market reach its previous ATH!?The index is above the EMA200 and EMA50 on the 4-hour timeframe and is trading in the specified pattern. In case of a valid break of this range, I expect a new trend to form. It is better to wait for confirmation on the break in order to control further risk.
U.S. President Donald Trump announced that an American delegation will meet with Chinese representatives in London on June 9 to discuss a potential trade agreement. In a post on Truth Social, Trump stated, “I’m pleased to announce that Treasury Secretary Scott Bessent, Commerce Secretary Howard Lutnick, and U.S. Trade Representative Jamieson Greer will meet with Chinese officials on Monday, June 9, 2025, in London to discuss a trade deal.” He added that he expects the meeting to go “very well.” U.S. stock markets rose on Friday, and Chinese markets are now following suit. The Hang Seng Index has reached its highest level since March.
Meanwhile, Amazon has completely halted its hiring budget for office workers in its core retail business. This decision applies only to white-collar staff and excludes warehouse employees and those in its cloud computing division. According to Business Insider, which cited internal company emails, the hiring freeze affects Amazon’s online marketplace, logistics operations, and grocery business.
Having doubled its workforce between 2019 and 2021 to 1.6 million, Amazon reduced that number to 1.55 million last year. Since late 2022, the e-commerce giant has laid off at least 27,000 employees.
This move comes as the U.S. jobs report released Friday helped ease some concerns, though signs of broader economic challenges remain. Experts suggest that such a hiring freeze could reflect broader economic trends—where mass layoffs are avoided, but hiring slows down significantly.
In May, the U.S. economy added 139,000 jobs, down from 147,000 in April. The unemployment rate remained steady at 4.2%, staying within the narrow range it has held over the past year. The labor market has remained resilient, dismissing fears that tariffs would cause a significant slowdown. So far, tariff-related disruptions have not been severe enough to destabilize the job market—at least not in May.
Data indicates that employers continue to refrain from layoffs, even as hiring has slowed considerably compared to the post-pandemic surge. Labor market analysts expect signs of weakness to emerge in the coming months, as businesses become more cautious about hiring due to uncertainty surrounding tariffs—according to recent surveys. For now, however, the labor market remains strong.
The absence of red flags in employment may give the Federal Reserve more room to maintain its patient stance on interest rate cuts. This year, Fed officials have kept interest rates higher than average to curb inflation by increasing borrowing costs. The Fed’s dual mandate is to keep inflation low and employment high, and it may opt to cut rates to stimulate the economy if the labor market weakens.Fed Chair Jerome Powell and other FOMC members have said they are waiting to see whether President Trump’s trade wars will stoke inflation, trigger job losses, or both. So far, neither scenario has materialized. Strong labor market data may give them further justification to stay in wait-and-see mode. Rosner wrote, “Given the Fed’s sharp focus on inflation risk management, today’s stronger-than-expected jobs report is unlikely to alter its patient approach. We expect the Fed to remain on hold at this month’s meeting and believe further deterioration

Nifty Gave Breakaway Gap Strong Bullish SignalWhat is Breakaway GAP?
A breakaway gap refers to the situation in the market where there is a strong price movement that crosses support or resistance. Breakaway gaps are formed after substantial periods of consolidation of prices in the market. It signifies a break from the previous trading range or pattern, and it suggests that a new trend or direction is emerging.
Nifty was trading in a range for 5 days and today 6/09/2025 it gap up and sustained above 25000 crucial level, the importance of break-away gap is that it's very strong sign of bullishness in market this also strong support too so if nifty come to retrace it would become support around 25000 level,
if nifty break today opening rang then it's very likely that it will go further so there are possibly Two entry Sign for Long: - first, OR breakout, second: -retracement on 15 Min chart near 20 Ema -50 Ema. Thats My opinion

Weekly $SPY / $SPX Scenarios for June 9–13, 2025 🔮 Weekly AMEX:SPY / SP:SPX Scenarios for June 9–13, 2025 🔮
🌍 Market-Moving News 🌍
📱 Apple WWDC & Tech Momentum
Apple’s annual Worldwide Developers Conference kicks off Monday with CEO Tim Cook set to discuss new products, services, and likely AI initiatives—tracks should watch include impacts on NASDAQ:AAPL and AI-related stocks
🧨 GameStop Eyed for Crypto Pivot
GameStop (a meme-stock darling) reports earnings Tuesday. Markets are watching for updates on its $500M bitcoin investment and potential pivot toward crypto-driven revenue streams
🇨🇳 U.S.–China Trade Talks in London
High-level trade dialogue begins Monday between U.S. and Chinese representatives in London, offering possible relief to trade tensions and providing a lift to risk assets
📉 Key Inflation Data Midweek
Wednesday brings the May CPI release—crucial for assessing tariff-driven inflation trends and likely to influence Fed policy outlook ahead of next month’s meeting
💹 Oil Markets React to Trade Uncertainty
Oil prices are stable to slightly up ahead of trade talks, as Brent holds around $66/barrel—reflecting balanced supply concerns and hopes for easing global tensions
🌐 G7 Summit and Global Policy Risks
G7 finance ministers convene in Canada (50th anniversary), tackling trade strains, Russia–Ukraine, and inflation. Global macrospoilers could trigger renewed volatility
📊 Key Data Releases & Events 📊
📅 Monday, June 9
Apple WWDC begins (CEO keynote)
U.S.–China trade talks start in London
📅 Tuesday, June 10
GameStop Q2 earnings (+ bitcoin update)
NFIB Small Business Index (6:00 AM ET)
📅 Wednesday, June 11
8:30 AM ET – Consumer Price Index (May)
Watch for inflation signal from tariffs.
8:30 AM ET – Core CPI (May)
Core inflation trend under scrutiny.
📅 Thursday, June 12
8:30 AM ET – Producer Price Index (May)
Early check on wholesale inflation
8:30 AM ET – Initial & Continuing Jobless Claims
📅 Friday, June 13
10:00 AM ET – University of Michigan Consumer Sentiment (June, preliminary)
Consumer mood and tariff impact insights
⚠️ Disclaimer:
This is for informational/educational purposes only. Not financial advice. See a licensed advisor before making investing decisions.
📌 #trading #stockmarket #economy #news #trendtao #charting #technicalanalysis

Stocks & ETF : Breaking out and Ready for Massive Bull runBelow is the list of stocks and ETFs that are in the early stage of breakout with ultra volume level. Good time to buy.
NSE:SCHNEIDER
NSE:ASAHIINDIA
NSE:HINDZINC
NSE:ABREL
NSE:TATAINVEST
NSE:UJJIVANSFB
NSE:PNBHOUSING
NSE:BANDHANBNK
NSE:DLF
NSE:ICICIGI
NSE:IDFCFIRSTB
NSE:SHRIRAMFIN
NSE:AUTOBEES
NSE:INDUSINDBK
NSE:ABB
NSE:TATACHEM
NSE:GODREJPROP
NSE:SIGNATURE
NSE:JPPOWER
NSE:HFCL

HOOD (Robinhood) - Price Above Bollinger Band and Shooting StarsHOOD (Robinhood) stock price has been in an uptrend since May 2025.
Recent fundamentals such as corporate earnings, EPS, Revenue, Acquisitions have been good in Q2 2025.
However currently, HOOD price has printed 2 shooting stars above the upper bollinger band and linear regression lines (blue arrow).
Potential selling and profit-taking could occur, especially if there is a significant bearish catalyst or news in the stock market.
A -4% or -8% move selloff could occur over time if the price gaps up to an overextended level too fast, such as $80 to $85.
Both the weekly and daily charts are starting to show bearish divergence so I am watching both the technicals and fundamentals this month.
