Unity Software (U) – Strong Earnings and Bullish FlowsFundamental Overview
Unity Software has been consolidating within a defined range for approximately a year following a significant decline in its stock price. Despite previous challenges, the company has consistently surprised investors with its earnings over the past year, maintaining strong performance. Historically, Unity tends to perform well during the May–June period. Looking ahead, projections suggest a decline in net margin, though net income is expected to increase, reinforcing the company's strong execution.
Additionally, Unity has exceeded expectations for four consecutive earnings reports, underscoring its resilience and growth trajectory.
Technical Outlook
- Momentum & Price Action: The stock exhibits solid momentum and is currently situated in a buy zone.
- Options Flow: Bullish sentiment is evident in options activity, signaling strong institutional interest.
- Analyst Ratings:
- Needham analyst Bernie McTernan maintains a Buy rating but lowers the price target from $33 to $30.
- Barclays analyst Ross Sandler maintains an Equal-Weight rating and lowers the price target from $26 to $25.
Given the current trends, bullish options flows, and favorable seasonality, Unity Software appears poised to test $25 in the upcoming weeks, particularly if momentum continues to drive price action.
Stocks

WGMI - Livermore Accumulation Cylinder From what I can see, in such an underloved sector of the market (Bitcoin reaching new highs whilst mining stocks suffer), it appears to me that WGMI is in an accumulation pattern, and could have explosive moves in later quarters this year.

WATCH OUT FOR VERITASKAPFrom around 0.83, VERITASKAP created an all-time high of around 1.81. This happened between August 2024 and September 2024. Then, price dropped into the discount level where is currently. The current price action shows that price is in a discount level, at a demand zone and within a falling wedge.
From a chart pattern perspective, falling wedge can be seen on the chart and a break out of the downtrend and resistance level around 1.06 with a bullish candle closing above these levels will serve as a strong indication that the stock is ready to rally up as much as the all-time high.
From a technical indicator perspective, awesome oscillator is below 0, showing that the stock is oversold. In addition, there is a bullish indication on the awesome oscillator as shown by its colour and upward movement. This is pointing to the fact that the value of the awesome oscillator is moving towards 0 and can cross over it which can be a good indication for a rise in price as well.
From a smart money concept perspective, a break of the last high (around 1.27) that led to the last bearish internal break of structure will as serve as indication of a bullish trend. Hence, the target will the all-time high.
Either way, the stock has a good potential. An aggressive trader or investor may buy at the current market price. While a conservative trader or investor may wait for a breakout.
Watch out for the confluences indicating potential rise in price so as to not miss out on the benefit.

AMAZON eyes $255 on the 3rd such buy signal in 18 months!AMAZON Inc. (AMZN) has been trading within a 18-month Bullish Megaphone pattern whose latest bottom was on the April 07 2025 Low. Since then, the pattern has started its new Bullish Leg, which has been confirmed by the break-out above its 1D MA50 (blue trend-line) and the 1W RSI's above its MA.
The previous two Bullish Legs hit at least their 3.5 Fibonacci extension levels and the 2nd Bullish was +30% more than the 1st. If the stock achieves a +60% gain from its April bottom again, it will be almost exactly on its 3.5 Fib ext.
As a result, we believe that a $255 Target (on the 3.5 Fib), is more than realistic to be achieved by September.
-------------------------------------------------------------------------------
** Please LIKE 👍, FOLLOW ✅, SHARE 🙌 and COMMENT ✍ if you enjoy this idea! Also share your ideas and charts in the comments section below! This is best way to keep it relevant, support us, keep the content here free and allow the idea to reach as many people as possible. **
-------------------------------------------------------------------------------
💸💸💸💸💸💸
👇 👇 👇 👇 👇 👇

Your are not Bullish enough on ETHExperts foresee Ethereum’s future mirroring that of early Amazon and Microsoft, predicting significant growth.
Analysts draw parallels between Ethereum (ETH) and major tech companies such as Amazon and Tesla, indicating that it could be a high-growth asset moving forward.
Even though ETH has experienced a recent decline, several analysts point out the increasing interest from institutional investors, with substantial holders actively accumulating.
The long-term prospects of Ethereum are linked to its innovative capabilities and established reputation, with its security-oriented strategy echoing Amazon’s approach to growth.
The analyst pointed out that this is a pivotal moment to "front-run" Ethereum's potential supremacy in the blockchain arena. He emphasized that Ethereum is set apart by its ongoing innovation; however, instead of focusing on immediate user expansion, the network has prioritized security. This dedication to dependability has established Ethereum as the most reliable settlement layer in the sector.
Please refrain from analyzing ETH as if it were Procter & Gamble. Acquiring ETH is more akin to investing in a high-growth stock like AMZN, MSFT, or TSLA from decades past.
Ethereum's approach to enhancing the dominance of the EVM could be compared to Amazon.
This chart comparing ETH prices to Tesla's stock price indicates a parallel trend of growth and dominance.
Make no mistake, I am quite optimistic about Tesla's prospects through 2030.
But this ongoing head and shoulders pattern implies that as we move into the Crypto Banana zone, ETH will accelerate and potentially surpass Tesla's market cap.

Credo Technology Group (CRDO) – Powering the AI Data Center BoomCompany Snapshot:
Credo Technology NASDAQ:CRDO is a rising star in AI infrastructure, delivering high-speed, low-power connectivity solutions that are mission-critical to modern data centers.
Key Catalysts:
AI Infrastructure Tailwinds 🧠🏢
Direct exposure to Active Electrical Cables (AEC) and PCIe retimers
Positioned for rapid demand acceleration from AI, cloud, and hyperscale data centers
AEC chip market expected to grow 15x from $68M (2023) to $1B+ by 2028
Sticky Software + Hardware Model 🧩
PILOT software platform offers real-time diagnostics and performance tuning
Enables a recurring revenue model and strengthens customer retention
Scalable, Energy-Efficient Portfolio ⚡🌐
High-bandwidth, low-power design aligns with sustainability goals of large data centers
Integrated solutions are already seeing early adoption momentum
Investment Outlook:
✅ Bullish Above: $51.00–$52.00
🚀 Upside Target: $90.00–$92.00
📈 Growth Drivers: AI infrastructure demand, software expansion, chip market scale
💡 Credo isn’t just riding the AI wave—it’s building the rails for it. #CRDO #AIInfrastructure #Semiconductors

Apple Stock Heist Blueprint – Precision Buy Setup Unlocked!🏴☠️ Apple Stock Heist: The Stealthy Long Setup
🎯 Entry Zone – Loot the Dip!
Current Price: $200.21
Action: Initiate long positions now or target pullbacks near the $193–$190 support zone.
Pro Tip: Place buy limits near swing lows/highs. Utilize chart alerts as your secret weapon.
🛡️ Stop Loss – Guard the Treasure!
Swing Traders: Position stop loss below the $190 support level.
Day Traders: Adjust stop loss according to your risk tolerance and order count.
TECHi
💰 Profit Target – Escape with the Loot!
Primary Target: $210 resistance zone.
Secondary Target: $227–$230 range.
⚔️ Scalpers vs. Swing Traders – Choose Your Weapon!
Scalpers: Focus on quick strikes. Enter long positions and exit swiftly.
Swing Traders: Trail stops and lock in gains as the price moves in your favor.
🌪️ Market Pulse – Bullish Winds Blowing!
Technical Indicators: Price is supported near $201, with potential to bounce back toward local resistance at $213.
RSI: Approximately 35 on the 1-hour timeframe, indicating oversold conditions and potential for a rebound.
TradingView
⚠️ News Trap Warning!
Upcoming Events: Monitor for any high-impact news that may affect Apple's stock price.
Strategy: Freeze trades or tighten stops ahead of major announcements.
🚨 Join the Trading Crew!
Engage: Like 👍 or Boost 🚀 this idea to fuel our next raid.
Support: Your engagement keeps the strategies alive!
🤑 Stay Locked In – The Next Big Score is Coming…
Timing: Watch the charts closely.
Action: Strike hard. Exit smarter.

NIFTY 1W forecast until August 2025India's stock market is correcting now. The correction will be short and not deep - just a normal retest of 24,500 but should not make a weekly close below 24,250 during the first half of June 2025.
A major bullrun will start in the middle of June 2025. Slowly at first, but explosive during summer.
It will find its top in August 2025 at the level of 27,800
Here I publish 1W charts, for weekly 1D charts check my profile for more ways to keep in touch

DELL Stock Price Analysis Ahead of Earnings ReleaseDELL Stock Price Analysis Ahead of Earnings Release
In addition to Nvidia’s (NVDA) quarterly report, this week financial market participants are also closely watching Dell Technologies’ (DELL) earnings release, scheduled for Thursday, 29 May, after the close of the trading session.
According to analysts cited by the media:
→ the company’s revenue is expected to come in at $23.18 billion (compared to $22.24 billion in the same period last year, and $23.9 billion in the previous quarter);
→ particular attention will be paid to Dell’s business segment focused on manufacturing servers for AI applications.
Notably, DELL’s price chart shares several similarities with the NVDA chart we analysed yesterday.
Technical Analysis of DELL’s Share Price
Price movements have formed a downward channel (shown in red) that has remained valid since 2024. In a broader context, it resembles a bullish flag pattern, which typically signals the potential continuation of an uptrend — a scenario that seems increasingly likely given the following:
→ the DELL’s price is currently near the upper boundary of the channel;
→ the May price rally suggests strong demand for DELL shares. Note the confident breakout above the psychologically significant $100 level (highlighted by the arrow), accompanied by a bullish gap and a series of rising candlesticks.
It is possible that the upcoming earnings report will act as a catalyst, enabling the bulls to gather momentum and attempt a breakout from the prevailing downward channel.
This article represents the opinion of the Companies operating under the FXOpen brand only. It is not to be construed as an offer, solicitation, or recommendation with respect to products and services provided by the Companies operating under the FXOpen brand, nor is it to be considered financial advice.

S&P500 6300 is the minimum short-term Target right now.The S&P500 index (SPX) is extending Friday's rebound on the 1D MA200 (orange trend-line) following an impressive rally after the April 07 bottom. That is technically the pattern's new Bullish Leg.
This quick consolidation technically resembles all 4 short-term pull-backs (blue circles) that took place since April 2023. The minimum % rise on those before they pulled back to the 1D MA50 (blue trend-line) again was +10%.
As a result, we expect 6300 to be the minimum Target by the end of July, which of course will be an All Time High.
-------------------------------------------------------------------------------
** Please LIKE 👍, FOLLOW ✅, SHARE 🙌 and COMMENT ✍ if you enjoy this idea! Also share your ideas and charts in the comments section below! This is best way to keep it relevant, support us, keep the content here free and allow the idea to reach as many people as possible. **
-------------------------------------------------------------------------------
Disclosure: I am part of Trade Nation's Influencer program and receive a monthly fee for using their TradingView charts in my analysis.
💸💸💸💸💸💸
👇 👇 👇 👇 👇 👇

15-minute chart, there exists another Fair Value Gap!Gold Price Technical Analysis.
At present, gold is exhibiting signs of continued bearish momentum as it trades below the 50% retracement level of the 30-minute Fair Value Gap (FVG). The fact that this critical level has been broken suggests a weakening of bullish strength in the short-term timeframe, and reinforces the likelihood of further downward pressure on the price.
Moreover, on the 15-minute chart, there exists another Fair Value Gap just below the current market level, which is offering minor support for the time being. This area has been acting as a temporary cushion, slowing the pace of decline; however, its sustainability remains uncertain under the current market sentiment.
Should gold decisively break below the 15-minute FVG as well, it would indicate a deeper structural weakness and open the possibility for an extended bearish move. In such a scenario, the next potential support level lies around the 3293 mark, which could act as a short-term target for sellers and a critical level for buyers to watch for possible reversal signals.
Traders and investors are advised to monitor price action closely around these key levels, as further developments could define the next major move in gold's short- to medium-term trend.

SPY (S&P500 ETF) - Price Bounced Above Gap Support Zone - DailySPY (S&P500 ETF) price has bounced up from the $576 price support gap level.
EMA Golden Cross is still active, the yellow 50EMA crossed above the red 200EMA which could signal a longer term bullish rally.
SPY price has been in an uptrend since May 2025.
Resistance Levels: $594, $596, $600, $607, $613.
Support Levels: $581, $575, $572, $567, $564.
Tariff and trade deal news, corporate earnings, presidential and government law changes, inflation data, economic data, and consumer sentiment can all affect Stock and ETF prices.

Nightly $SPY / $SPX Scenarios for May 28, 2025🔮 Nightly AMEX:SPY / SP:SPX Scenarios for May 28, 2025 🔮
🌍 Market-Moving News 🌍
🏭 Trump’s Tax Bill Threatens Clean-Energy Boom President Trump’s proposed budget aims to accelerate the expiry of key clean-energy tax credits, jeopardizing over $321 billion in investments and forcing manufacturers to pause expansion—risking a slowdown in solar and wind growth.
🛢️ Oil Flat as OPEC+ Output Hike Looms Brent and WTI held steady amid expectations that OPEC+ will announce a 411K bpd production increase for July at today’s ministerial meeting—balancing tighter U.S. supply and easing trade-tension pressures.
💻 Nvidia Earnings Eye Export-Curbs Impact Ahead of Q1 results, analysts warn U.S. chip-export restrictions to China could shave $5.5 billion from Nvidia’s ( NASDAQ:NVDA ) sales this quarter, testing AI-led growth optimism.
📈 Wall Street Climbs on Tariff Reprieve U.S. futures jumped after Trump delayed planned EU tariffs until July 9, lifting risk appetite across megacaps—Nvidia led gains with a 2.7% pre-market rise.
📊 Key Data Releases 📊
📅 Wednesday, May 28:
9:00 AM ET: Case-Shiller Home Price Index Measures month-over-month changes in home values across 20 major U.S. cities—a key gauge of housing-market trends.
10:00 AM ET: Consumer Confidence Index Tracks consumer sentiment on current business and labor-market conditions and expectations for the next six months.
2:00 PM ET: FOMC Minutes (May 6–7 Meeting) Detailed readout of policymakers’ economic outlook and voting rationale—critically watched for hints on future rate policy.
⚠️ Disclaimer: This information is for educational and informational purposes only and should not be construed as financial advice. Always consult a licensed financial advisor before making investment decisions.
📌 #trading #stockmarket #economy #news #trendtao #charting #technicalanalysis

$1 to $4.58 or +353% upside today $LVWRPOWER ⚡ $1 to $4.58 or +353% upside today 🚀 NYSE:LVWR
Morning Buy with additional messages during the day explaining importance of $2 support for after hours squeeze of shortsellers trapped ✅
NASDAQ:IMNN wasn't far from similar move as well
NYSE:BBAI NASDAQ:SBET and NASDAQ:FAAS had power volume

MICROSOFT Correction ahead of 1st 1D Golden Cross in 2 years?Microsoft (MSFT) is just below the $470 All Time High (ATH) and last technical Resistance, following the remarkable rally on the April 07 2025 bottom.
By the first week of June, it should technically form a 1D Golden Cross, which will be its first in more than 2 years (since March 17 2025). That Golden Cross was formed just after the price pulled-back on the 0.382 - 0.5 Fibonacci retracement Zone, finding support on its 1D MA50 (blue trend-line) and rebounding.
As a result, it is quite possible to see a short-term correction to at least $420 before the 1D Golden Cross restores the bullish sentiment. That previous structure eventually hit the -1.0 Fibonacci extension, before the next 1D MA50 test. We therefore expect to see $630 in 2025 before a 1D MA50 correction again.
-------------------------------------------------------------------------------
** Please LIKE 👍, FOLLOW ✅, SHARE 🙌 and COMMENT ✍ if you enjoy this idea! Also share your ideas and charts in the comments section below! This is best way to keep it relevant, support us, keep the content here free and allow the idea to reach as many people as possible. **
-------------------------------------------------------------------------------
💸💸💸💸💸💸
👇 👇 👇 👇 👇 👇

OSCR 1W — When the Chart Speaks Before the FundamentalsThe Oscar Health chart is currently forming a textbook cup and handle — a long-term reversal structure that has completed its base and is now breaking out of the consolidation zone. The bullish structure is confirmed through price action, volume, and positioning relative to key moving averages.
The price has broken through the upper boundary of the handle, shaped as a descending wedge. The breakout is accompanied by increased volume — a clear sign of capital rotation out of accumulation. All major moving averages (EMA, MA50, MA200, WMA) are trending upward, and the price is holding above them all, confirming the bullish momentum.
According to Fibonacci extension levels, drawn from the historical low of $1.50 to the peak near $23.26, the first wave target stands at $36.71 (1.618 level), with an extended target at $45.02 (2.0 level).
Structurally, the setup suggests a medium-term scenario pointing from current levels toward the $36–45 range, with the potential to repeat the kind of explosive move seen during the 2023 phase, when the price increased more than sixfold.
On the fundamental side, Oscar Health is actively recovering: in 2024, revenue grew by more than 50%, net losses were cut nearly in half, and the client base continued to expand. The company is strengthening its share in the digital insurance market and gaining support from institutional investors, including Morgan Stanley and Capital Group. The latest quarterly report was positively received.
The breakout is technically clean and fundamentally supported. The immediate pullback zones sit at $14.95 and $13.40. Below that, moving averages may act as control zones for reaction.

Apple: Wave [2] Correction We now consider the dark green wave to be complete and thus place AAPL in the intermediate corrective movement of wave , which can be further subdivided into waves (A), (B), and (C) in magenta. Currently, only the last part of this (C) wave should be missing before the next impulsive uptrend unfolds towards the previous all-time high. We must still weigh our alternative scenario with a 34% probability: If the price falls below support at $168, this scenario with a new low for the blue wave alt.(IV) would be confirmed, although in this case, the price should not fall significantly below our previous Target Zone.
📈 Over 190 precise analyses, clear entry points, and defined Target Zones - that's what we do.

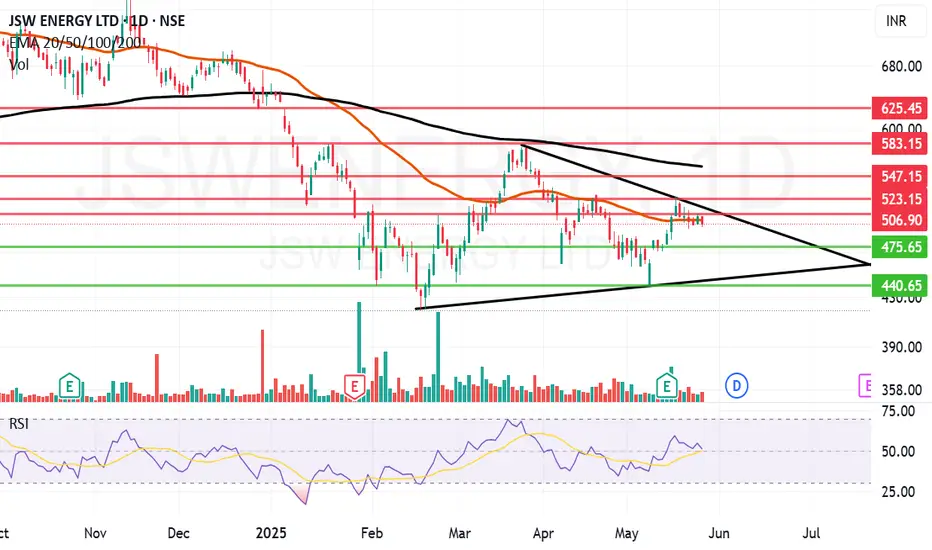
JSW Energy trying to gain some energy and momentum.JSW Energy Ltd. engages in the business of power generation. It operates through the following business segments: Power Generation, Power Transmission, and Power Trading. The company was founded by Om Prakash Jindal on March 10, 1994 and is headquartered in Mumbai, India.
JSW Energy Ltd. Closing price is 497.4. The positive aspects of the company are Annual Net Profits improving for last 2 years, Consistent Highest Return Stocks over Five Years and MFs increased their shareholding last quarter. The Negative aspects of the company are high Valuation (P.E. = 45.2), Stocks Underperforming their Industry Price Change in the Quarter, Increasing Trend in Non-Core Income, Companies with Increasing Debt, Promoter decreasing their shareholding and Companies with high market cap, lower public shareholding.
Entry can be taken after closing above 507 Historical Resistance in the stock will be 528, 547 and 567. PEAK Historic Resistance in the stock will be 583 and 625. Stop loss in the stock should be maintained at Closing below 475 or 440 depending upon your risk taking ability.
Disclaimer: The above information is provided for educational purpose, analysis and paper trading only. Please don't treat this as a buy or sell recommendation for the stock or index. The Techno-Funda analysis is based on data that is more than 3 months old. Supports and Resistances are determined by historic past peaks and Valley in the chart. Many other indicators and patterns like EMA, RSI, MACD, Volumes, Fibonacci, parallel channel etc. use historic data which is 3 months or older cyclical points. There is no guarantee they will work in future as markets are highly volatile and swings in prices are also due to macro and micro factors based on actions taken by the company as well as region and global events. Equity investment is subject to risks. I or my clients or family members might have positions in the stocks that we mention in our educational posts. We will not be responsible for any Profit or loss that may occur due to any financial decision taken based on any data provided in this message. Do consult your investment advisor before taking any financial decisions. Stop losses should be an important part of any investment in equity.
MSumi Wiring trying to wire up to old levelsMotherson Sumi Wiring India Ltd. engages in the manufacture and sale of wire harnesses, components, and wires to automotive original equipment manufacturers. The company was founded on July 2, 2020 and is headquartered in Mumbai, India.
Motherson Sumi Wiring India Ltd. Closing price is 59.35. The positive aspects of the company are Stocks Outperforming their Industry Price Change in the Quarter, Companies with Zero Promoter Pledge, Companies with Low Debt and FII / FPI or Institutions increasing their shareholding. The Negative aspects of the company are high Valuation (P.E. = 43.1), Increasing Trend in Non-Core Income, Declining Net Cash Flow : Companies not able to generate net cash, Companies with growing costs YoY for long term projects and MFs decreased their shareholding last quarter.
Entry can be taken after closing above 60 Historical Resistance in the stock will be 62.3 and 66.2. PEAK Historic Resistance in the stock will be 69.6 and 72.7. Stop loss in the stock should be maintained at Closing below 55.3 or 53.9 depending upon your risk taking ability.
Disclaimer: The above information is provided for educational purpose, analysis and paper trading only. Please don't treat this as a buy or sell recommendation for the stock or index. The Techno-Funda analysis is based on data that is more than 3 months old. Supports and Resistances are determined by historic past peaks and Valley in the chart. Many other indicators and patterns like EMA, RSI, MACD, Volumes, Fibonacci, parallel channel etc. use historic data which is 3 months or older cyclical points. There is no guarantee they will work in future as markets are highly volatile and swings in prices are also due to macro and micro factors based on actions taken by the company as well as region and global events. Equity investment is subject to risks. I or my clients or family members might have positions in the stocks that we mention in our educational posts. We will not be responsible for any Profit or loss that may occur due to any financial decision taken based on any data provided in this message. Do consult your investment advisor before taking any financial decisions. Stop losses should be an important part of any investment in equity.

NASDAQ got the 4H MA50 confirmation it neededNasdaq (NDX) has been trading within a Channel Up since the April 21 bottom and last week it unfolded its latest technical Bearish Leg.
As the 4H RSI bottomed on the 30.00 oversold barrier and the 4H MACD formed a Bullish Cross, that Leg bottomed and today the index gave the confirmation of the new Bullish Leg by breaking above its 4H MA50 (blue trend-line).
This is similar to the April 21 bottom, so we expect at least a minimum of +9.18% rise on the current Bullish Leg, which gives a 22500 short-term Target.
-------------------------------------------------------------------------------
** Please LIKE 👍, FOLLOW ✅, SHARE 🙌 and COMMENT ✍ if you enjoy this idea! Also share your ideas and charts in the comments section below! This is best way to keep it relevant, support us, keep the content here free and allow the idea to reach as many people as possible. **
-------------------------------------------------------------------------------
Disclosure: I am part of Trade Nation's Influencer program and receive a monthly fee for using their TradingView charts in my analysis.
💸💸💸💸💸💸
👇 👇 👇 👇 👇 👇

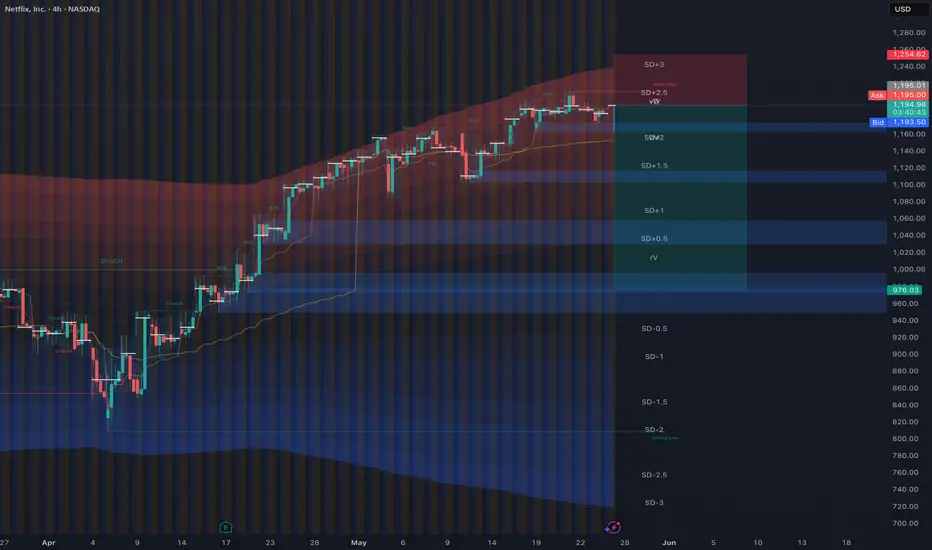
NFLX is looking nastyPositive sentiment at ATH, nobody even dares shorting it, all while being extremely overbought and consumers short on expendable income. I've seen this before.
NFA. TP and SL are not accurate, I just used the short position tool to show direction. I'm in position with 1100p looking to TP around 1065 and 980.
What’s Happening with Nvidia (NVDA) Ahead of Earnings?What’s Happening with Nvidia (NVDA) Ahead of Earnings?
After an extended weekend due to Veterans Day in the US (observed on Monday), financial markets are returning to active trading. The highlight of the week will be Nvidia’s (NVDA) earnings report, scheduled for Wednesday after the close of the main trading session.
What You Need to Know Ahead of Nvidia’s Earnings
According to media reports, market participants are concerned about:
→ escalating trade tensions between the US and China;
→ increasing competition;
→ Nvidia’s premium pricing at a time when the GPU market is shifting towards more affordable alternatives;
→ downward revisions to earnings per share, which some interpret as a sign that Nvidia’s report may fall short of expectations.
On the other hand, Reuters reports that Nvidia is set to unveil a new processor that:
→ is designed specifically for AI applications;
→ is based on the Blackwell architecture;
→ will not be subject to US export restrictions on chips sent to China;
→ is expected to be cost-effective.
Technical Analysis of Nvidia (NVDA) Stock
Today’s NVDA price chart suggests that the descending channel (marked in red) may be forming a large bullish flag — a continuation pattern that typically indicates a potential resumption of the uptrend after a corrective phase.
Price action in Nvidia stock has slowed near the upper boundary of the channel — a sign of temporary equilibrium between supply and demand (this could also be interpreted as traders adopting a wait-and-see stance ahead of the earnings release).
Given that the earnings report is a potentially strong price catalyst, a breakout from the bullish flag cannot be ruled out. Such a move could signal the start of a new phase in NVDA’s long-term upward trend (as indicated by the arrow on the chart).
This article represents the opinion of the Companies operating under the FXOpen brand only. It is not to be construed as an offer, solicitation, or recommendation with respect to products and services provided by the Companies operating under the FXOpen brand, nor is it to be considered financial advice.

What Is Stock Tape Reading, and How Do Traders Use It?What Is Stock Tape Reading, and How Do Traders Use It?
Tape reading is a real-time market analysis method used to track buying and selling pressure. Unlike technical indicators, which rely on historical data, tape reading focuses on executed trades, order flow, and liquidity shifts. Traders use it to assess momentum, identify institutional activity, and refine trade timing. This article explores how tape reading works, its role in modern markets, and how traders apply it to short-term decision-making.
The Origins and Evolution of Tape Reading
Tape reading began in the late 19th century when stock prices were transmitted via ticker tape machines, printing a continuous stream of price updates on paper strips. Traders would gather around these machines, scanning for large trades and unusual activity to anticipate market moves. One of the earliest and most well-known tape readers, Jesse Livermore, built his fortune by studying these price changes and spotting institutional buying and selling patterns.
By the mid-20th century, as markets became faster and more complex, ticker tape machines were replaced by electronic order books. Instead of scanning printed numbers, traders began using Level 2 market data and time & sales windows to track order flow in real time. This transition allowed for more precise liquidity analysis, making it easier to see how large orders impacted price movement.
The rise of algorithmic and high-frequency trading (HFT) in the 2000s further changed the landscape. Today, market depth tools, order flow software, and footprint charts have replaced traditional tape reading, but the core principle remains the same: analysing how buyers and sellers interact in real time. While charts and indicators offer historical insight, tape reading provides a direct window into current market behaviour, giving traders an edge in fast-moving conditions.
How to Read the Tape
Nowadays, tape reading is all about real-time market data—watching when and how orders are placed and filled to gauge momentum and liquidity. Unlike technical indicators, reflecting past price action, tape reading focuses on what’s happening right now. Stock, forex, and commodity traders use it to assess buying and selling pressure, spot large orders, and understand market sentiment as it unfolds. Here is the key information provided by tape reading:
Time & Sales
The time & sales window (the tape) displays every completed trade. Each entry shows time, price, trade size, and whether it hit the bid or ask.
- Trades at the ask suggest aggressive buying, as buyers are willing to pay the market price.
- Trades at the bid indicate selling pressure, as sellers accept lower prices.
- Large block trades often signal institutional activity—tracking these can reveal where big players are positioning.
Bid-Ask Activity
Nowadays, an order book is a part of tape reading. The order book (Level 2 or DOM) shows the number of buy and sell orders at different price levels. While not all orders get filled, traders watch for:
- Stacked bids (a high concentration of buy orders) near a price level, which may indicate strong buying interest.
- Stacked offers (large sell orders) acting as resistance.
- Orders rapidly appearing or disappearing, suggesting hidden liquidity or fake orders meant to mislead traders.
Volume and Trade Size
Changes in trade size and volume help traders judge the conviction behind a move:
- Consistent large trades in one direction can suggest institutions accumulating or distributing a position.
- A surge in small trades may indicate retail participation rather than institutional moves.
- A sudden drop in trade activity after a sharp move may hint at exhaustion or a potential reversal.
Trade Speed
The pace of executions matters.
- Fast, continuous transactions suggest urgency—buyers or sellers are aggressively taking liquidity.
- A slowdown in transactions near a key level can indicate hesitation or a shift in sentiment.
Tape Reading vs Technical & Fundamental Analysis
Tape reading differs from technical and fundamental analysis in both approach and timeframe. While technical traders study historical price patterns and fundamental analysts focus on company performance and economic data, tape readers focus on real-time order flow to assess market direction as it develops.
Technical Analysis
Technical traders rely on chart patterns, moving averages, and oscillators to identify trends and potential turning points. These tools are built on past price data, meaning they lag behind actual market activity. For example, a trader using a moving average crossover strategy waits for confirmation before acting, whereas a tape reader sees momentum shifting as it happens by watching the flow of orders.
Fundamental Analysis
Fundamental analysis is longer-term, based on financial statements, earnings reports, and macroeconomic indicators. Investors using this approach focus on factors like revenue growth, interest rates, and industry trends to decide whether a stock is undervalued or overvalued. Tape reading, by contrast, ignores these metrics entirely—it’s used by short-term traders reacting to immediate buying and selling pressure.
Where Tape Reading Fits In
Many traders combine approaches. A day trader might use technical analysis to find key price levels and then apply tape reading to fine-tune entries and exits. Similarly, a swing trader tracking earnings reports may use tape reading to see how large players are reacting. Each method provides different insights, but tape reading offers a unique advantage: it reveals market sentiment in real time, helping traders assess momentum before price movements become obvious.
Advantages and Disadvantages of Tape Reading
Tape reading gives traders an inside look at real-time market activity, but it also comes with challenges, especially in modern electronic markets.
Advantages
- Immediate Market Insight: Unlike lagging indicators, tape reading reflects live buying and selling pressure, helping traders react before price changes become obvious.
- Identifying Large Buyers & Sellers: Institutions often execute orders in patterns, leaving clues in the stock market tape. Recognising these can help traders gauge potential price direction.
- Fine-Tuning Entries & Exits: By tracking order flow near key price levels, traders can time their trades more precisely rather than relying on static chart signals.
- Useful in Fast-Moving Markets: Tape reading can be particularly valuable in scalping and day trading, where short-term momentum plays a key role.
Disadvantages
- Algorithmic Trading Distortion: High-frequency trading firms place and cancel orders rapidly, making it harder to interpret true supply and demand.
- Steep Learning Curve: Unlike technical analysis, which provides visual patterns, tape reading requires experience in spotting meaningful order flow changes.
- Mentally Demanding: Constantly watching the tape can be exhausting, requiring a high level of focus and quick decision-making.
- Less Effective in Low-Volume Markets: When liquidity is thin, tape reading becomes unreliable, as fewer trades mean less actionable data.
Modern Footprint Charts and Order Flow Software
While some stock tape readers rely on raw order flow data, many use footprint charts and order flow software to visualise buying and selling pressure more effectively.
Footprint charts display executed trades within each price bar, showing volume distribution, bid-ask imbalances, and point of control (POC)—the price level with the highest traded volume. This helps traders see where liquidity is concentrated and whether buyers or sellers are in control.
Order flow software offers heatmaps, cumulative delta, and volume profile tools. Heatmaps highlight resting liquidity in the order book, revealing where large players may be positioned. Cumulative delta tracks the difference between market buys and sells, helping traders assess momentum shifts.
These tools provide a more structured approach to tape reading, filtering out noise and making it easier to spot large orders, absorption, and potential reversals. While experience is still essential, modern software gives traders a clearer view of market behaviour beyond just raw time & sales data.
The Bottom Line
Reading the tape remains a valuable tool for traders looking to analyse real-time order flow and market liquidity. While there are numerous algorithms that place trades, understanding executed trades and bid-ask dynamics can provide an edge in fast-moving conditions.
FAQ
Is Tape Reading Still Useful in Trading?
Yes, but the application of tape reading in trading has changed. While traditional tape reading focuses on printed ticker tape, modern traders use time & sales data, Level 2 order books, and footprint charts to analyse order flow. High-frequency trading and algorithmic activity have made tape reading more complex, but it remains valuable for scalpers, day traders, and those tracking institutional activity.
What Are the Principles of Tape Reading?
Tape trading is based on real-time order flow analysis. Traders focus on executed trades (time & sales), bid-ask activity (order book), volume shifts, and trade speed to gauge buying and selling pressure. The goal is to understand how liquidity moves in the market and spot signs of institutional accumulation or distribution.
What Is the Difference Between Order Book and Tape?
The order book (Level 2 or DOM) shows pending orders at different price levels, representing liquidity that may or may not get filled. The tape (time & sales) displays completed transactions, showing actual buying and selling activity in real time.
What Is the Difference Between Technical Analysis and Tape Reading?
Technical analysis relies on historical price patterns and indicators, while tape reading focuses on real-time executed trades and market depth. Technical traders look at charts, whereas tape readers analyse live order flow to assess momentum and liquidity shifts.
How to Read Ticker Tape?
Modern ticker tape is displayed in time & sales windows on trading platforms. Traders monitor price, trade size, and whether transactions occur at the bid or ask. Rapid buying at the ask suggests demand, while consistent selling at the bid indicates selling pressure.
This article represents the opinion of the Companies operating under the FXOpen brand only. It is not to be construed as an offer, solicitation, or recommendation with respect to products and services provided by the Companies operating under the FXOpen brand, nor is it to be considered financial advice.
