WHAT A LOVELY BULLISSH GAP ON AMAZON: A 4RR PROFIT TRADE CLOSEDI just closed this beautiful 4RR trade on Amazon.
The trade was entered last week, this new week market open Gap pushed the price high to my 4RR target.
Trade Idea;
The monthly is extremely bullish.
The weekly is also bullish.
Daily is bullish as well, so i entered on the daily time frame pull back swing low.
Result?
A beautiful 4RR profits trade.
Next Action?
I will wait till the daily frame correct and form a swing low before entering for a bullish trend continuation buy.
Stocks

Celanese Corp | CE | Long at $39.64Celanese Corp is another chemical company (like Dow Inc) crushed by tariffs and economic headwinds. It's dropped -78% in one year.... However, this is a very strong company with strong credit market interest and no immediate liquidity crisis. From a technical analysis perspective, this... like in 2008 and 2020... is the time to gather shares given it has reached the "abysmal crash" levels based on my selected simple moving averages. In the past, recovery to new highs has taken 1-2 years. History doesn't always repeat, but fear is opportunity in the stock market. If negative news continues to reign, a dip into the high $20's isn't out of the question.
If the company can squeak through 2025 and not continue to stack debt (debt/equity=2.43x), the growth opportunity into 2027-2028 looks promising.
I'm keeping my targets into 2026 low, but this could be a good buy and hold for the right investor.
Targets:
$47.00
$54.75

Gold - New All Time High in the making?market context and trend environment
This 4-hour chart of Gold (XAU/USD) from OANDA illustrates a strong impulsive structure within a broader bullish trend. Following a sharp upward movement that broke through previous structure, gold formed a swing high before entering a corrective phase. The market has since pulled back and appears to be stabilizing near a zone of high confluence, suggesting potential for a renewed move to the upside. Price has respected key retracement levels, reinforcing the technical strength of this zone.
fair value gap and fibonacci confluence
A notable feature of this setup is the alignment between a visible fair value gap and the Fibonacci golden pocket zone, comprising the 0.618–0.65 retracement levels. This convergence of technical tools adds weight to the significance of the support zone around the 3,280–3,300 region. Fair value gaps represent inefficiencies in the market caused by strong institutional participation, while the golden pocket is historically known for acting as a magnet for reversals within trending markets. The presence of both in the same area increases the likelihood of price reacting positively here.
liquidity sweep and structural reaction
Before revisiting this key demand zone, price briefly swept below a local low, which may have served as a liquidity grab to fuel the next bullish leg. This liquidity sweep is followed by a sharp reaction, suggesting that downside pressure may have been absorbed by aggressive buyers positioned at the FVG and golden pocket. Price has since rebounded, and the subsequent price action shows a gradual formation of higher lows, hinting at a shift in short-term order flow back in favor of buyers.
projection and bullish scenario
The chart projects a potential bullish continuation move, with a series of higher lows anticipated to form en route to a break of structure above recent swing highs. Multiple buy-side liquidity levels (BSL) are marked, representing areas where buy stops are likely to be clustered. These zones offer clear targets for bullish expansion. The blue arrowed projection outlines a methodical stair-step advance, respecting interim levels before ultimately attempting to reach the prior high near 3,530.
strategic framework and trader insight
This chart offers a methodical roadmap for bullish continuation, rooted in the smart money framework of liquidity, inefficiency, and institutional order flow. The confluence between the fair value gap and Fibonacci retracement is particularly notable and serves as a key validation area for bullish traders. Rather than anticipating immediate breakout behavior, the projection emphasizes a progressive structure that aligns with how larger players tend to accumulate positions before moving the market. Patience and alignment with structure are emphasized as price prepares for a potential continuation move higher.

MSTR (Strategy) coming up to $395, the smaller resistance levelNASDAQ:MSTR has rebounded from the bottom fairly fast compared to other stocks and indexes. It's even performed better than Bitcoin itself. However it should be hitting heavy resistance now near 395-400 and above is only heavier resistance. It's time for a pullback and a breather for MSTR. Target is the Point of Control near $350, before going higher. However we could turn bullish again before reaching $350
I personally know someone who played with fire by buying MSTR options calls while it was dropping before, meaning he was trying to catch a falling knife and got burnt finally. He lost nearly $500,000 because of it. So I don't mess with options personally, however I will margin trade with stocks and trade futures, forex and leverage trade cryptocurrencies.

S&P 500 WEEKLY Bullish Divergence According to this bullish divergence we have on weekly time frame for S&P 500, it can push to about $6800 and Bitcoin follows to new ATHs

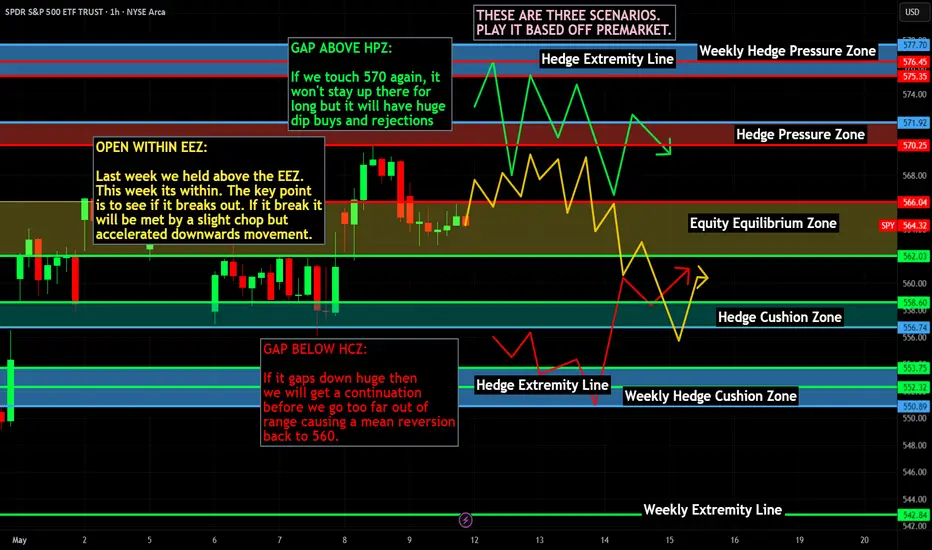
Weekly $SPY / $SPX Scenarios for May 12–16, 2025 🔮 Weekly AMEX:SPY / SP:SPX Scenarios for May 12–16, 2025 🔮
🌍 Market-Moving News 🌍
📊 Inflation and Retail Sales Data in Focus
Investors are closely watching this week's release of the Consumer Price Index (CPI) on Tuesday and Retail Sales data on Thursday. These reports will provide insight into inflation trends and consumer spending amid ongoing tariff concerns.
🤝 U.S.-China Trade Talks Resume
High-level trade discussions between the U.S. and China are set to continue this week in Switzerland. The outcome of these talks could significantly impact global markets and investor sentiment.
💼 Key Corporate Earnings Reports
Major companies including Walmart ( NYSE:WMT ), Cisco ( NASDAQ:CSCO ), Applied Materials ( NASDAQ:AMAT ), and Take-Two Interactive ( NASDAQ:TTWO ) are scheduled to report earnings this week. These reports will offer insights into consumer behavior and the tech sector's performance.
🏦 Federal Reserve Speeches
Federal Reserve Chair Jerome Powell is scheduled to speak on Thursday, with other Fed officials also making appearances throughout the week. Their comments will be analyzed for indications of future monetary policy directions.
📊 Key Data Releases 📊
📅 Monday, May 12:
No major economic data scheduled.
📅 Tuesday, May 13:
8:30 AM ET: Consumer Price Index (CPI) for April
📅 Wednesday, May 14:
10:30 AM ET: EIA Crude Oil Inventory Report
📅 Thursday, May 15:
8:30 AM ET: Retail Sales for April
8:30 AM ET: Producer Price Index (PPI) for April
8:30 AM ET: Initial Jobless Claims
9:15 AM ET: Industrial Production and Capacity Utilization
10:00 AM ET: Business Inventories
2:00 PM ET: Federal Reserve Chair Jerome Powell speaks
📅 Friday, May 16:
8:30 AM ET: Housing Starts and Building Permits for April
10:00 AM ET: University of Michigan Consumer Sentiment Index (Preliminary) for May
S&P Global
⚠️ Disclaimer:
This information is for educational and informational purposes only and should not be construed as financial advice. Always consult a licensed financial advisor before making investment decisions.
📌 #trading #stockmarket #economy #news #trendtao #charting #technicalanalysis
Breakout in Dave Inc...Chart is self explanatory. Levels of breakout, possible up-moves (where stock may find resistances) and support (close below which, setup will be invalidated) are clearly defined.
Disclaimer: This is for demonstration and educational purpose only. This is not buying or selling recommendations. Please consult your financial advisor before taking any trade.

BTC Technical Market Update! $110,000?Bitcoin (BTC) Technical Market Update
Over the past several trading sessions, Bitcoin (BTC) has demonstrated a pattern of strength, particularly visible on the 4-hour chart. Price action has consistently respected the Fair Value Gap (FVG) zones on this timeframe, taking support from these areas without breaching any significant downside levels. This repeated behavior indicates a strong underlying bullish sentiment, suggesting that market participants are actively defending key support zones.
Furthermore, Bitcoin recently approached a high-liquidity resistance zone—a level that historically acts as a supply barrier—and not only absorbed the liquidity but also decisively broke through it. This move implies that bullish momentum is firmly in control, and short-term resistance levels are being invalidated one after another. The market structure remains intact, with higher highs and higher lows supporting the current trend.
As of now, BTC has just bounced from a 4H FVG and is trading above that support. However, a short-term pullback remains possible. If such a retracement occurs, it is expected to revisit the next significant 4H FVG support zone, which lies approximately between $98,800 and $97,400. This area could act as a strong accumulation zone for buyers, potentially fueling another bullish wave. In the case of renewed upward momentum from this level, Bitcoin could target the $101,000 to $105,000 range in the short to mid-term.
Market participants are advised to remain cautious and observe price behavior as it unfolds in the coming days. Technical setups are aligning in favor of the bulls, but volatility may increase near key resistance and support levels. Always base your trades and investment decisions on thorough analysis, and keep in mind that no setup guarantees results.
Disclaimer: This is not financial advice. Please ensure you conduct your own independent research and analysis (DYOR) before making any trading or investment decisions.

Will gold reach an all-time high?Gold (XAU/USD) Market Analysis
Trend Environment
The 4-hour chart of Gold (XAU/USD) from OANDA illustrates a strong impulsive structure within a broader bullish trend. Following a sharp upward movement that broke through previous structure, gold formed a swing high before entering a corrective phase. The market has since pulled back and appears to be stabilizing near a zone of high confluence, suggesting potential for a renewed move to the upside.
Key Levels
Support Zone 3,280-3,300 region, characterized by a fair value gap and Fibonacci golden pocket zone (0.618-0.65 retracement levels).
Potential Targets Higher lows and break of structure above recent swing highs, with buy-side liquidity levels (BSL) marking areas where buy stops are likely to be clustered.
Technical Confluence
The alignment of the fair value gap and Fibonacci retracement levels in the 3,280-3,300 region increases the likelihood of price reacting positively. Fair value gaps represent inefficiencies in the market caused by strong institutional participation, while the golden pocket is historically known for acting as a magnet for reversals within trending markets.
Bullish Scenario
The chart projects a potential bullish continuation move, with a series of higher lows anticipated to form en route to a break of structure above recent swing highs. A methodical stair-step advance is expected, respecting interim levels before ultimately attempting to reach the prior high near 3,530.
Strategic Framework
This analysis offers a methodical roadmap for bullish continuation, rooted in the smart money framework of liquidity, inefficiency, and institutional order flow. The confluence between the fair value gap and Fibonacci retracement serves as a key validation area for bullish traders. By understanding the technical and institutional drivers of the market, traders can better navigate the complexities of the gold market and identify potential opportunities for growth.

NI225 CORRECTION AHEAD|SHORT|
✅NIKKEI has been growing recently
And the index seems locally overbought
So as the pair is approaching a horizontal resistance of 38,216
Price decline is to be expected
SHORT🔥
✅Like and subscribe to never miss a new idea!✅
Disclosure: I am part of Trade Nation's Influencer program and receive a monthly fee for using their TradingView charts in my analysis.

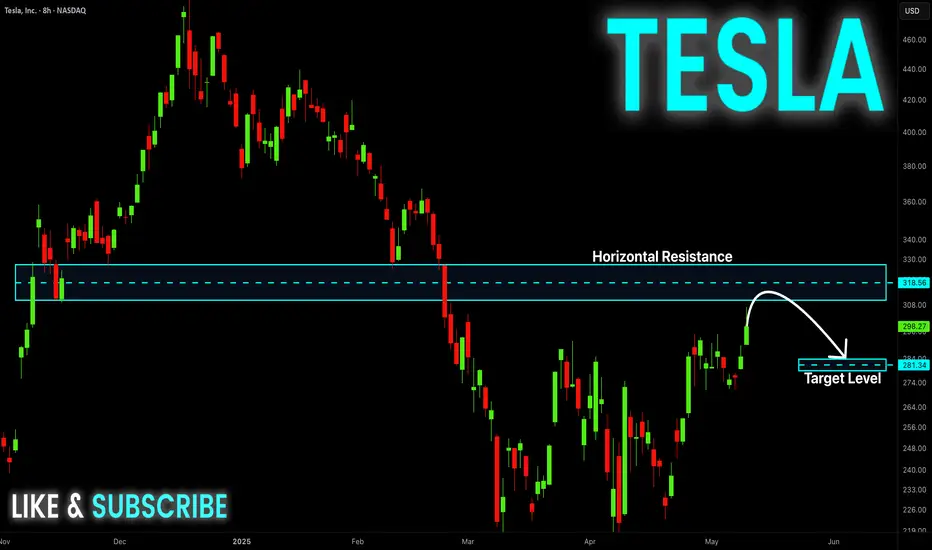
TESLA Resistance Ahead! Sell!
Hello,Traders!
TESLA stock is growing
And we are bullish biased
Mid-term but the price is
About to hit a horizontal
Resistance of 322.00$
So after the retest we
Will be expecting a local
Bearish correction
Sell!
Comment and subscribe to help us grow!
Check out other forecasts below too!
Disclosure: I am part of Trade Nation's Influencer program and receive a monthly fee for using their TradingView charts in my analysis.
NZDUSD - Elliott Wave Setup: Eyes on the Buy Zone!NZDUSD - 3D Chart Elliott Wave Outlook
We've been tracking NZDUSD over the years and each move continues to align with Elliott Wave Theory.
The current structure is unfolding as a large ABC corrective pattern.
- Wave A and the complex Wave B (WXY) are now complete.
- We're now in Wave C, and we expect it to target the highs of Wave A.
Recently, NZDUSD made a clear bullish impulse but has been consolidating for the past 3 weeks. This correction is likely to resolve with a bullish breakout.
We've marked a buy zone between the 38.2% and 50% Fibonacci retracement levels, which we believe is the ideal entry area. We'll be watching this zone closely for lower timeframe bullish confirmations like a break of structure (BOS) or trendline break.
Trade Plan:
- Wait for price to enter the buy zone
- Look for bullish confirmations (BOS, trendline break)
- Enter after confirmation, with stops below the corrective lows
- Targets: 0.63 (500 pips), 0.65 (700 pips)
Goodluck and as always, Trade Safe!

S&P 500 Daily Chart Analysis For Week of May 9, 2025Technical Analysis and Outlook:
In the initial days of this week’s trading session, the S&P 500 Index exhibited a steady to low price movement pattern, successfully achieving a significant target at the Mean Support level of 5601, as indicated in last week’s Daily Chart Analysis. Subsequently, the Index experienced a robust rebound, effectively retesting the Mean Resistance level of 5692. This upward trajectory achievement established a reversal pattern for the downward acceleration to repeat the Mean Support level 5601 retest. However, it is critical to recognize the considerable risk of a sharp upward movement from the current price action, which may lead to an ascent toward the next Mean Support level of 5778. Furthermore, there exists the potential for additional escalation, potentially reaching the Outer Index Rally level of 5915 and beyond.

Walt Disney Co | DISThe Walt Disney Company is reportedly exploring options to sell or find a joint venture partner for its India digital and TV business, reflecting the company's ongoing strategic evaluation of its operations in the region. The talks are still in the early stages, with no specific buyer or partner identified yet. The outcome and direction of the process remain uncertain. Internally, discussions have commenced within Disney's headquarters in the United States as executives deliberate on the most viable course of action. These deliberations signify the company's willingness to adapt and optimize its business operations to align with changing market dynamics. The Wall Street Journal reported on July 11 that Disney had engaged with at least one bank to explore potential avenues for assisting the growth of its India business while sharing the associated costs. This approach suggests a proactive stance by the company to explore partnerships or arrangements that can drive growth while minimizing financial burdens. While it is too early to ascertain the exact direction this exploration will take, the developments in Disney's India business warrant attention, as they may shape the future landscape of the company's presence in this all-important region.
The ongoing shift from traditional TV to streaming has placed Disney and its competitors in a costly and transformative phase. As part of this transition, Disney is actively cutting costs amid macroeconomic challenges that have impacted its advertising revenue and subscriber growth. CEO Bob Iger has been at the forefront of these changes, and his contract was recently extended through 2026 to allow him sufficient time to make transformative changes while strengthening the bench with future leaders of the company.
One of the key considerations for Disney is evaluating its portfolio of TV networks, including ABC and ESPN. Bob Iger has expressed a willingness to be expansive in assessing the traditional TV business, leaving open the possibility of selling certain networks while retaining others acknowledging that networks like ABC may not be core to Disney's new business model. ESPN, as a cable TV channel, is being approached differently. Disney is open to exploring strategic partnerships, such as joint ventures or offloading ownership stakes, to navigate the challenges faced by the sports network. CEO Iger, who had previously expressed pessimism about the future of traditional TV, has found the situation to be worse than anticipated since his return to Disney.
Although the linear networks segment, which accounts for Disney's TV properties such as ABC, National Geographic, FX, and FreeForm, has struggled to grow in the recent past, this segment is still an important part of the company's business, which is evident from the positive operating income reported by this segment in fiscal 2022. As below data reveals, the DTC business and content licensing made operating losses in FY 2022 which were offset by the operating income reported by linear networks. For this reason, investors will have to closely monitor a potential sale of TV assets to evaluate the impact of such a decision on Disney's profitability.
The broadcasting landscape is experiencing a significant shift, with uncertainties surrounding its future and the changing nature of consumer preferences. While linear television channels are not expected to disappear immediately, their consumption continues to decline as viewers increasingly favor OTT platforms. This transition represents a fundamental trend shaping the industry. In terms of business models, subscription video-on-demand (SVOD) services will continue to grow with targeted advertising.
As the ascent of streaming video continues, cable, satellite, and internet TV providers in the United States faced their most significant subscriber losses to date in the first quarter of 2023. Analyst estimates indicate a collective shedding of 2.3 million customers during this period. Consequently, the total penetration of pay-TV services in occupied U.S. households, including internet-based services like YouTube TV and Hulu, dropped to its lowest point since 1992, standing at 58.5%, according to Moffett's calculations.
In Q1, pay-TV services in the U.S. witnessed a nearly 7% decline in customers compared to the previous year, with cable TV operators experiencing a 9.9% decline, while satellite providers DirecTV and Dish Network registered subscriber losses of 13.4%. Virtual MVPDs, which are multichannel video programming distributors, also suffered significant losses, shedding 264,000 customers during the quarter. Comcast, the largest pay-TV provider in the country, lost 614,000 video customers in Q1, and Google's YouTube TV was the only tracked provider to experience subscriber growth, adding an estimated 300,000 subscribers during the period. These trends illustrate the challenges faced by the pay-TV industry, with factors like increasing sports-broadcast fees driving retail prices higher, leading to cord-cutting and subsequent price adjustments by distributors. By 2026, e-Marketer predicts that the number of non-pay TV households will surpass pay TV households by over 25 million.
In efforts to achieve profitability in the streaming business, Disney has implemented significant cost-cutting measures, including saving $5.5 billion through cost reductions and layoffs, and a focus on making Disney+ and Hulu more profitable. Disney aims to enhance Hulu integration, seeing it as a vital component of the company's transition from TV to a streaming-only model. Discussions are also underway for Disney to acquire Comcast Corporation's (CMCSA) stake in Hulu, as Disney currently holds 66% ownership. The company believes that the integration of Hulu and Disney+ will bolster the streaming business and contribute to its profitability. While the negotiations with Comcast over Hulu's valuation are ongoing, the combined offering of Disney+ and Hulu is expected to be available to consumers by the end of the calendar year. Although Disney's plans for ESPN+ and the fate of its other cable channels, such as the Disney Channel, remain uncertain, Bob Iger expects ESPN to eventually move to a streaming-only model, acknowledging the disruptive nature of the traditional TV business model.
The discussions surrounding Walt Disney's TV and streaming business in India come at a critical juncture for the company, as it grapples with intensified competition and significant challenges in the market. The emergence of Reliance Industries' JioCinema streaming platform has posed a considerable threat to Disney's dominance, especially after Reliance secured digital rights for the highly popular Indian Premier League cricket tournament. This strategic move by Reliance, which offered free access to the tournament earlier this year, caused a substantial decline in Disney+ Hotstar's subscribers, a popular streaming service under Disney's India business.
Additionally, Viacom18, which is backed by Reliance and Paramount Global (PARA), made a significant impact on Disney's market position in India. Through its partnership with Warner Bros, Viacom18 secured content rights to popular shows on HBO including Succession, previously aired on Disney's platform. This collaboration forms a formidable alliance challenging Disney's dominance in the Indian market. Reliance's freemium model poses the most significant threat to Disney's current position. By offering content for free on its streaming platform, JioCinema attracted a substantial number of subscribers through the broadcast of IPL. With its ample cash reserves, Reliance has the advantage of focusing on subscriber growth without immediately focusing on monetization strategies. The loss of streaming rights for the IPL, combined with a subsequent decline in paid subscribers, had a profound impact on Disney's reputation in India in the first quarter of this year, which could very well be the most challenging Q1 Disney has had in India for a long time.
A report on video consumption trends in India by Media Partners Asia sheds light on the dynamic landscape of the online video sector in India. For the 15 months that ended in March 2023, total consumption across the online video sector reached a staggering 6.1 trillion minutes. During this period, Disney+ Hotstar emerged as the dominant player in premium VOD, capturing 38% of viewing time. The report attributes Hotstar's success to its strong sports offerings and the depth of its Hindi and regional entertainment content.
During the survey period, Zee and Sony together held a 13% share of the Indian premium video sector viewing time. While the two companies are expected to merge pending regulatory approval, they are projected to operate independently for another year, benefiting from strong engagement across sports as well as regional, local, and international content. Prime Video and Netflix, Inc. (NFLX) collectively accounted for a 10% share of viewership in the premium VOD category. Prime Video also garnered a significant portion of viewership from regional Indian titles. The report emphasizes that local content dominates premium VOD viewership, particularly outside the sports category, while international content leads paid tiers. Catch-up TV is prevalent in the free tier across freemium streaming platforms.
Although Disney was the clear winner in 2022, this report highlights a significant shake-up in the market brought about by the transformation of JioCinema. JioCinema, which previously held a mere 2% share of the premium video market, experienced a major upswing in growth since April. This surge can be attributed to JioCinema's decision to offer free live streaming of the popular IPL cricket tournament, a property that was previously exclusive to Disney-owned media in India. Despite technical glitches impacting user experience, JioCinema witnessed a more than 20-fold increase in consumption in April 2023, enabling it to dominate the premium VOD category. The report raises questions about JioCinema's ability to sustain this growth and scale in the absence of IPL action after June 2023. That being said, this could be an early indication of growth challenges Disney-owned brands may face in India.
Star India, now known as Disney Star following the rebranding last year, is expected to experience a revenue drop of around 20% to less than $2 billion for the fiscal year ending September 2023. Additionally, EBITDA is projected to decline by approximately 50% compared to the previous year. Furthermore, Hotstar is estimated to lose 8 to 10 million subscribers in its fiscal third quarter as well.
Given the current scenario, finding an outright buyer for Disney's India business is expected to be challenging. When Disney acquired the entertainment assets of 21st Century Fox in 2019, the enterprise value of the Indian business was estimated at around $15-16 billion. This high valuation, coupled with the intense competition and declining subscriber base, presents a complex landscape for potential buyers or partners.
I believe Disney stock is attractively valued today given that the company's streaming business has a long runway for growth internationally while its brand assets will continue to drive revenue higher. As an investor, I am both concerned and curious about what the future holds for Disney's linear networks segment. Going by the recent remarks of CEO Iger, major changes are on their way. A strategic decision to divest non-core assets, in my opinion, will trigger a positive response from the market. That being said, a major divestment of TV assets could materially impact the company's profitability in the next 3-5 years until its streaming business scales enough to replace lost revenue from the linear networks segment. Investors will have to closely monitor new developments to identify a potential inflection point in Disney's story.

SPY (S&P500 ETF) - Testing Key Resistance Levels - Weekly ChartSPY (S&P500 ETF) is currently attempting an uptrend rally, bouncing up from the April 7th 2025 support level ($488) and weekly support trendline.
The current resistance price level is $569 above, and the support price level below is $555.
SPY price needs to remain and close above $522 in May 2025 to maintain the current uptrend rally.
Resistance price targets above: $569, $578, $600, $610.
Support price targets below: $555, $542, $533, $512.
Tariff and trade deal news, corporate earnings, government law changes, and consumer sentiment will continue to affect the stock price action of SPY.
Support price levels need to hold for an uptrend to continue in 2025.

1,700% in a day $NXTT from $0.31 to $5.67I've sent out buy alert at $1.50 as soon as I thought was safe enough to get in, even if I watched it before that but at that time volume was still too low and it was halting on both sides too much. It needed some extra time to get safer price action even if it meant missing some of the move, but at the end from $1.50 up to $5.50 is more than enough if you really wanted to milk it all the way.
NASDAQ:NXTT

MICROSTRATEGY Can $2000 be its next High?Microstrategy (MSTR) followed the exact trading pattern we suggested on our last analysis (December 27 2024, see chart below) as it made its technical correction December through March and rebounded aggressively in April:
Back then we called this a shift to a new paradigm and is no different than the April 1999 bounce than led to the eventual massive rally that made the Dotcom Bubble burst.
Since the recent All Time High (ATH) broke above the (blue) 23-year Channel Up, we applied the Fibonacci Channel levels all the way from its March 2000 Dotcom High. The fractal we mentioned before shows that the stock's next Target, and possibly this Cycle's High, can be on the 0.618 Fib at $2000.
-------------------------------------------------------------------------------
** Please LIKE 👍, FOLLOW ✅, SHARE 🙌 and COMMENT ✍ if you enjoy this idea! Also share your ideas and charts in the comments section below! This is best way to keep it relevant, support us, keep the content here free and allow the idea to reach as many people as possible. **
-------------------------------------------------------------------------------
💸💸💸💸💸💸
👇 👇 👇 👇 👇 👇

GOOGL (Alphabet Inc.) – Medium-Term Position Trade SetupNASDAQ:GOOGL is showing strength as it revisits its previous all-time high, now aligning with the 50% Fibonacci retracement of the current wave. The price action suggests a bullish flip of resistance into support at the $153 zone, with clear signs of buyer defense—offering a compelling medium-term opportunity.
🔹 Entry Zone:
Around $153 (support zone)
🎯 Take Profit Targets:
🥇 $200
🥈 $230
🛑 Stop Loss:
Weekly close below $130

HUGE +1,522% in 2 days from $0.61 to $9.90 $ASSTIt was clear from the very start this one will go insane because of the volume. It traded 315 million shares on first day when I posted about it. I sent out a message premarket at the very beginning of the move and it already had tens of millions of shares volume at that time.
Then the next day it got to 241 million shares, you just don't see stuff like that in regular stocks.
Awesome profits made along the way, can't wait for a new catch like that!
NASDAQ:ASST

Dow Jones Correction in May 2025: Key DriversDow Jones Correction in May 2025: Key Drivers
Summary: The Dow Jones Industrial Average (DIA) is under pressure and likely headed for a correction due to the Federal Reserve’s tight monetary policy, trade uncertainty from Trump’s tariffs, and weak economic data.
Key Drivers:
➖ Federal Reserve Policy: At the May 6–7 meeting, the Fed is expected to maintain the 4.25–4.5% interest rate due to persistent inflation (2.7% forecast for 2025) and a robust labor market (+177K jobs in April). This dampens hopes for rate cuts, pressuring stocks.
➖ Trump’s Tariffs: New tariffs raise inflation risks and recession fears, reducing the appeal of Dow Jones constituents like Caterpillar and Walmart.
➖ Weak GDP and Global Volatility: A 0.3% GDP contraction in Q1 2025 and declines in Asian markets (1.6–1.8%) signal global instability.
➖ Technical Indicators: DIA trades below its 200-day moving average (~420 USD), with fewer stocks above this level (down from 76% to 55% since January), indicating market weakness.
➖ Outlook: Analysts (Long Forecast) predict volatility, with a potential drop to 38,958 in May, despite an average forecast of 43,370 by month-end. Historically, corrections occur every 1.88 years, and current conditions (tariffs, inflation, GDP) heighten the likelihood of a 10–15% decline.
Target: My downside target for the Dow Jones is 38,555.00.
Current factors and historical trends strongly suggest a near-term correction.
Idea for S&P 500:

BTC – One last pushmarket context and structure
This BTCUSDT 4-hour chart from BYBIT provides a broader perspective on BTC’s ongoing uptrend, emphasizing the role of fair value gaps in guiding price behavior. After a prolonged period of sideways action and consolidation, BTC initiates a sharp bullish impulse that breaks previous structure and introduces fresh momentum into the market. Each leg higher is followed by a corrective phase, during which multiple fair value gaps (FVGs) are formed. These FVGs serve as structural inefficiencies left by aggressive buying pressure and outline key zones of interest for future price interaction.
fair value gaps and institutional demand
The chart identifies three key FVGs that have influenced BTC’s price action. The lowest FVG, created during the initial breakout below the 89,000 zone, is the origin of this current bullish leg and reflects strong institutional involvement. The mid-level FVG, created as BTC pushed through the 94,000–96,000 region, marks another significant shift in order flow. The most recent FVG, created just prior to the most recent impulse, lies just beneath the 98,000 level and represents a more immediate zone of demand. Price is currently trading above this uppermost FVG, indicating that it may act as a reaccumulation zone if price retraces.
liquidity dynamics and continuation thesis
The projection drawn on the chart suggests a short-term retracement back into the upper FVG before a potential continuation higher. This idea is rooted in the expectation that institutional participants will revisit unfilled orders left within the FVG before driving price upward toward new liquidity pools. The light blue shaded zone indicates the potential target range for this continuation. The market has consistently respected prior FVGs, confirming their role as reliable demand zones and reinforcing the current bullish bias.
price behavior and structural clarity
BTC’s price action on this timeframe is characterized by impulse–correction cycles with clearly defined inefficiencies. Each impulse leaves behind an FVG, which is either fully or partially mitigated during pullbacks. The most recent bullish leg has created an unmitigated FVG directly beneath current price, suggesting that if a retracement occurs, it is likely to interact with this gap before continuing the upward trajectory. This behavioral pattern of clean imbalances followed by targeted mitigation is a strong indicator of organized institutional involvement in the market.
interpretation and tactical insight
The chart outlines a strategic approach to navigating BTC’s current bullish structure. Rather than entering impulsively, the analysis encourages waiting for price to retrace into identified imbalance zones where the probability of sustained movement is higher. Fair value gaps provide a roadmap for understanding where price is likely to react and continue. In this case, if BTC revisits the nearest FVG and holds that level, it sets the stage for continuation toward the 101,000–102,000 zone, in line with the drawn projection. The setup remains aligned with smart money trading methodology, where price is guided by liquidity and imbalance mechanics.

Carvana to $400?Carvana may have reached a bottom and may skyrocket in my prediction at least as far as HKEX:400 per share. Stay tuned!

$2.55 to $9.30 $VEEE$2.55 to $9.30 NASDAQ:VEEE was just one of awesome movers to give great payday if you weren't too greedy 💵
Stocks that make +300% +500% moves in a day out of nowhere can also come out with offering news as company tries to get paid from the move which just happened in the market. That is the reason of stock drop and it usually happens outside of regular hours so if you buy in the morning you can ride it whole day if you want, but it's smart to lock some if not all of the massive profit into end of day and the get back in again next morning if no offering news.
