Amazon losing weekly trendline – watch these Fibo levels nextTechnical Analysis
Amazon (AMZN) has broken below its weekly ascending trendline and failed to reclaim the key 0.618 Fibonacci level (180.52). Strong bearish volume and a weakening RSI suggest downside continuation. Key support targets lie at 161.55, 151.21, and 142.58, with extended downside to 119.12.
Fundamentals
Macro pressure from high interest rates and a slowdown in consumer spending weighs on Amazon. Intense competition in AWS and e-commerce adds uncertainty. Upcoming earnings may serve as a catalyst for directional clarity.
Scenarios:
Base case – move down toward 151.21, 142.58, 119.12
Bullish case – break above 180.52 → rally toward 207.52, 241.92
Stocks

Nvidia: Bullish Monday?A new week is about to get started and we would like to know if the NVIDIA Corporation (NVDA) chart supports a bullish Monday.
What is the chart saying on the daily timeframe?
The chart has many positive signals and support a strong week but...
Good Sunday my fellow Cryptocurrency trader, how are you feeling in this wonderful day?
I hope you are doing great.
Let's read the chart; together, let's trade!
The chart looks really good and the short-term can always surprise, anything goes.
The chart is saying, "up, straight up," and even though the markets are unpredictable, I can easily tell you what the market is doing and is most likely to happen after the weekly close.
NVDA is super bullish and likely to continue growing based on multiple signals:
1) The falling wedge pattern is already confirmed. The action broke above it.
2) The trading volume supports a continuation of the pattern breakout.
3) The correction was really strong but the reaction to support was even stronger. Such a strong reaction indicates that traders were anxious and ready to buy. The only reason to sell was based on political bad news. With the bad news removed, up we go. NVDA is solid and with Bitcoin and mining growing, the market expanding, AI, NVDA is set to follow and also grow.
4) Both the 0.786 and 0.618 Fib. retracement levels are major support and gauge the strength of a stock. If the action is happening below, bearish; when the action happens above bullish. The fact that the action moved below just to recover makes this a strong bullish signal. A failed signal for the bears because they failed to move prices lower. A strong bullish signals for the bulls because the action is back above long-term critical support.
5) The session 10-April closed as a hammer and this also points up.
6) Finally, NVDA managed to close daily above EMA8, EMA13 and EMA21. Short-term bullish bias is now valid, active and confirmed.
All these are bullish signals saying that the market will move higher next.
What needs to happen for all this to become invalid?
NVDA would need to close daily below the last low.
No need to worry about short-term moves and noise. We are going up long-term.
The correction here reached more than 43%. Believe it or not, a 43% drop is a very strong drop. For the market to go lower, it would need to be the end of the company or worse. What need is there for a stock like this one, with a great product in huge demand, to drop by 80%, for what reason?
We are going up.
Namaste.

BROADCOM's 15 year chart is why you will regret not buying now.Broadcom Inc. (AVGO) has been on a strong correction in the past 4 months, completing so far 3 straight brutally red 1M (monthly) candles since January, having broken below its 1W MA50 (blue trend-line).
This month, it hit its 1W MA100 (green trend-line) for the first time since November 2022. This is a key Support level as it is AVGO's main Support during Bull Cycles that historically has only broken during Bear Cycles.
In fact, the stock has been trading within a 15-year Channel Up since it's IPO. And this is the reason why this correction is a blessing in disguise for long-term investors. The 1W MA100 was intact during the previous historic Bull Cycle from May 2013 to July 2018. So since we tested it now, there is a far stronger probability of it holding and extending the Bull Cycle that started on the October 2022 Low, than turning into a Bear Cycle.
Notice also how symmetric the rises have been within this Channel Up. The 2012 - 2015 rise has been +500% before the 1W MA50 was breached again. Similarly, AVGO has grown by +500% again from the October 2022 bottom to the recent All Time High, before it broke last month again below the 1W MA50.
If this is a new Low similar to August 2015, then we can expect an equally symmetric follow up rise of +178.64% in the next 2 years. This gives us a rough long-term Target of $380.
-------------------------------------------------------------------------------
** Please LIKE 👍, FOLLOW ✅, SHARE 🙌 and COMMENT ✍ if you enjoy this idea! Also share your ideas and charts in the comments section below! This is best way to keep it relevant, support us, keep the content here free and allow the idea to reach as many people as possible. **
-------------------------------------------------------------------------------
💸💸💸💸💸💸
👇 👇 👇 👇 👇 👇

S&P 500 E-mini Futures – Bearish Setup Ahead?Price recently tapped into a key resistance zone where an imbalance was filled by a wick, showing signs of potential exhaustion. We could see a liquidity grab above before a significant move down toward the 5,150 level. Watch for a reaction in the highlighted resistance area – this could be the beginning of a bearish reversal. Major support sits lower, where a larger move might find footing.
🔹 Resistance tested
🔹 Imbalance filled
🔹 Bearish reaction anticipated
🔹 Targeting the 5,150 zone
Let me know your thoughts – do you see the same setup?

US 100 - At a Critical Crossroads The US 100 index shows intriguing price action as it navigates key technical levels. Currently trading at 18,967.2 , the market has formed a clear double top pattern at the resistance zone, suggesting potential exhaustion in the uptrend.
Key Technical Observations:
The chart reveals strong resistance near recent highs around 19,024.3 , with price struggling to break through this ceiling. Below current levels, we spot a double bottom formation that previously provided support, creating an interesting tension between these patterns.
Notable price levels include:
- Resistance: 19,024.3 (double top confirmation)
- Support: 18,961.7 (recent swing low)
- Critical zone: The weakened gap that remains to be filled below current prices
Market Dynamics:
The minimal +0.02% change indicates indecision at these levels. The presence of liquidity pools both above and below suggests potential for volatility when either side gives way.
Trading Considerations:
A break above the double top resistance could signal continuation of the uptrend, while failure to hold current levels may see price test lower supports to fill the gap. The tight range between 18,961.7 and 19,024.3 suggests an impending volatility expansion.
The market appears to be at an inflection point where the next directional move could be significant. Traders should watch for either a confirmed breakout above resistance or breakdown below support before committing to positions.
Final Note: This technical setup presents clear risk/reward opportunities, but requires confirmation before acting. The double top pattern would only be validated by a break below the interim support levels.
Disclaimer: Market conditions can change rapidly. This analysis represents one interpretation of current price action and should be verified with additional indicators. Always use proper risk management.

Chipmaker Stocks DeclinesChipmaker Stocks Declines
According to the charts, semiconductor stocks underperformed the broader equity market yesterday. While the S&P 500 index (US SPX 500 mini on FXOpen) fell by around 2.2%, the drop was far steeper across the chip sector:
→ The bullish semiconductor ETF (SOXL) declined by 15%;
→ Nvidia (NVDA) shares fell by 6.9%;
→ Advanced Micro Devices (AMD) dropped by 7.3%.
In other words, chipmaker stocks dragged down the broader market, raising concerns ahead of the upcoming earnings season.
Why Are Chip Stocks Falling?
The decline stems from corporate assessments of how the escalating global trade war and new tariffs could impact future performance.
According to media reports:
→ AMD expects to face tariffs of up to $800 million on exports to China;
→ For Nvidia, similar levies could exceed $5 billion.
Technical Analysis – Nvidia (NVDA)
The price continues to fluctuate within a downward channel, previously identified in our analysis:
The lower boundary of the channel is acting as support, helping the price close near its opening level yesterday (forming a Doji candle on the daily chart).
Technical Analysis – AMD
A similar picture is emerging on the AMD chart:
The $96 level now appears to be a key resistance zone.
In Summary
All eyes are on today’s earnings report from chipmaker TSMC (TSM), which could significantly influence the currently bearish sentiment in the sector.
This article represents the opinion of the Companies operating under the FXOpen brand only. It is not to be construed as an offer, solicitation, or recommendation with respect to products and services provided by the Companies operating under the FXOpen brand, nor is it to be considered financial advice.

What Is a Balanced Price Range, and How Can You Use ItWhat Is a Balanced Price Range, and How Can You Use It in Trading?
Balanced Price Ranges (BPRs) offer traders insight into areas where market forces temporarily balance. Understanding how BPRs form and how to use them can help traders identify key zones of interest on the chart. This article explores the details of BPRs, their applications in trading, and how combining them with other tools can refine your market analysis.
What Is a Balanced Price Range (BPR)?
A Balanced Price Range (BPR) is an Inner Circle Trader (ICT) concept used to pinpoint areas on a price chart where market activity reflects a temporary equilibrium between buyers and sellers. These zones, often identified through overlapping Fair Value Gaps (FVGs), highlight price levels where buying and selling pressures have offset each other, creating a balance.
Here’s how it works in a bullish scenario: a rapid price move downward leaves a bearish Fair Value Gap—a price range the market skips over due to strong selling momentum. If the price rises with equal intensity shortly, creating a bullish Fair Value Gap in the opposite direction, the overlapping region between these gaps becomes the BPR. This overlap represents a zone of temporary balance, where the market has effectively “corrected” the earlier imbalance.
BPR zones are not random. They often form in areas of high market interest—perhaps near key support or resistance levels, or after significant news events that cause sharp price movements. Traders look at these ranges because they frequently act as reference points for future price reactions.
The boundaries of an ICT BPR—its high and low—serve as critical levels. These edges often function as dynamic support and resistance, helping traders gauge potential turning points. Furthermore, BPRs can appear across various timeframes, from minute-by-minute to weekly charts.
How Does a Balanced Price Range Form?
Now that we know the idea of the ICT Balanced Price Range, let’s look at how it forms step by step.
1. An Initial Price Imbalance
A BPR begins with a strong price movement in one direction—either up or down. For example, in an overall bearish scenario, buyers initially drive the price up rapidly and leave behind a bullish FVG. This gap reflects an area where the market didn’t fully engage, often skipping over price levels due to overwhelming demand.
2. A Counter-Move Creates an Opposing Gap
After the initial move, the market can shift in the opposite direction with equal momentum. In our example, sellers step in, pushing the price downward. This creates a bearish FVG that partially overlaps with the earlier bullish FVG. These rapid shifts often occur around key events, such as news releases or liquidity grabs, which ignite temporary market imbalances.
3. Overlapping Fair Value Gaps Define the Range
The overlapping portion of the bullish and bearish FVGs is what forms the BPR. This zone represents the price levels where buying and selling forces are temporarily balanced, neutralising the earlier imbalances.
4. Market Consolidation and Testing
Once the BPR is established, the price often consolidates near this range. This zone acts as a magnet for future price action because it’s seen as an area of high market interest, where traders may take note of previous balance. In the example given, a test may precede a bearish reaction.
Combining BPRs With Other ICT Concepts
Balanced Price Ranges in the ICT methodology become even more powerful when combined with other related concepts. By layering multiple tools, traders can refine their analysis and pinpoint high-probability areas for market activity. Here’s how BPRs work with key ICT concepts:
Fair Value Gaps
Since BPRs are defined by overlapping fair value gaps, understanding how to read these gaps adds depth to BPR analysis. FVGs outside the BPR can act as supplementary zones of interest.
Order Blocks
Traders often spot BPRs forming near significant order blocks. When these zones overlap, they highlight areas where institutional activity may have left a footprint, increasing their importance for analysis.
Liquidity Pools
BPRs often align with liquidity zones where stop orders are clustered. Price may gravitate toward these areas before reacting, offering traders insight into potential price reversals or continuations.
Market Structure Shifts
BPRs can reinforce insights gained from market structure shifts. For example, a BPR forming after a break in structure might signal consolidation before the next major move.
Higher Timeframe Confluence
When a BPR aligns with key levels on higher timeframes, it can provide added confidence in the zone’s relevance for price reactions.
How to Use a Balanced Price Range
The Balanced Price Range can provide traders with valuable insights into price behaviour, acting as a reference point for analysing potential market movements. By understanding how these zones function, traders often use them to refine their strategies and enhance their market analysis.
Identifying High-Interest Zones
As BPRs highlight areas where the market found an equilibrium between buyers and sellers, traders typically monitor how the price reacts when revisiting a BPR. For example, if the price approaches the upper or lower boundary of a BPR, it may indicate a potential turning point or a continuation, depending on the market context.
Support and Resistance Dynamics
One common approach is to view BPRs as dynamic support or resistance zones. When the price tests the range, traders often anticipate a reaction. For instance, a rejection from a BPR in a bearish trend may suggest continued downward momentum, while a breach might signal weakening selling pressure.
Contextualising Larger Market Structures
BPRs don’t exist in isolation; they often align with broader market structures. Traders may use them in combination with tools like liquidity zones or order blocks to build a more complete market picture. For instance, if a BPR forms near a major resistance level on a higher timeframe, this confluence could strengthen its importance as a reference point.
Adjusting for Timeframe and Strategy
The relevance of a BPR often depends on the timeframe being analysed. Day traders might focus on intraday BPRs to find potential trading opportunities, while swing traders could look for these zones on higher timeframes, considering them significant levels for long-term moves. Either trader can use lower and higher timeframe BPRs to inform their analysis and entries.
Managing Risk Around BPRs
Traders may incorporate BPRs into their risk management plans, such as by using the boundaries of the range to set stop-loss or take-profit levels. A breach of these levels can indicate a shift in market sentiment, helping traders refine their analysis.
Risks and Considerations When Using BPRs
While BPRs can be a useful tool for analysing price behaviour, they aren’t without limitations. Traders need to approach BPRs with a clear understanding of their potential pitfalls. Here are some key considerations:
- Not Predictive: BPRs don’t guarantee future price movement. While they highlight zones of interest, traders must combine them with broader market analysis to avoid over-reliance.
- Subjectivity: Identifying BPRs can sometimes be subjective. What one trader sees as a balanced range might not align with another’s interpretation, especially on different timeframes.
- Timeframe Sensitivity: A BPR on a lower timeframe may lose significance in the broader market context. Conversely, higher timeframe BPRs may lag behind fast-moving markets.
- False Breakouts: Price can move beyond a BPR briefly before reversing, creating potential traps for traders relying solely on breakout strategies.
- Market Context Matters: BPRs are analysed alongside market conditions like volatility, news events, or broader trends. Ignoring these factors can reduce their reliability.
The Bottom Line
Understanding Balanced Price Ranges can help traders interpret key market zones and improve their analysis. By combining BPRs with other tools and strategies, traders gain deeper insights into price movements.
FAQ
What Is the ICT Price Range?
The ICT price range refers to specific price levels or zones highlighted in the Inner Circle Trader (ICT) methodology. These ranges often represent areas of interest in the market, such as liquidity pools, fair value gaps, or balanced price ranges. Traders use ICT price ranges to analyse price movement, identify potential reaction points, and refine their trading strategies.
What Is the Meaning of a Balanced Price?
Balanced price describes a market state where buying and selling pressures are in equilibrium. It typically forms in areas where overlapping fair value gaps exist, reflecting zones where previous imbalances have corrected. These areas can act as key levels for future price reactions.
What Is an Optimal Trade Entry in a Balanced Price Range?
Optimal trade entry in a balanced price range refers to identifying high-probability entry points within or near a BPR. Traders often look for price reactions at the range’s boundaries, combining BPR analysis with other ICT tools, such as order blocks or liquidity zones, to refine their approach.
This article represents the opinion of the Companies operating under the FXOpen brand only. It is not to be construed as an offer, solicitation, or recommendation with respect to products and services provided by the Companies operating under the FXOpen brand, nor is it to be considered financial advice.

Nightly $SPY / $SPX Scenarios for April 17, 2025🔮 🔮
🌍 Market-Moving News 🌍:
🇪🇺 ECB Expected to Cut Rates Amid Trade Pressures: The European Central Bank is anticipated to reduce its deposit rate by 25 basis points to 2.25% during its meeting on April 17. This expected move aims to counteract the economic impact of recent U.S. tariffs and a strengthening euro, which have contributed to disinflationary pressures in the eurozone.
📉 German Inflation Decline Supports Easing: Germany's inflation rate fell more than expected in March, dropping to 2.3% from 2.6% in February. This decline, driven by falling oil prices and a sluggish economy, bolsters the case for further interest rate cuts by the ECB.
🤖 AI Enhances ECB Policy Predictions: A study by the German Institute for Economic Research indicates that artificial intelligence significantly improves the accuracy of forecasting ECB monetary policy decisions. By analyzing ECB communications, AI models can better anticipate policy shifts.
📊 Key Data Releases 📊
📅 Thursday, April 17:
🏠 Housing Starts (8:30 AM ET):
Forecast: 1.420 million
Previous: 1.501 million
Indicates the number of new residential construction projects begun, reflecting housing market strength.
🏭 Philadelphia Fed Manufacturing Survey (8:30 AM ET):
Forecast: 3.7
Previous: 12.5
Measures manufacturing activity in the Philadelphia region, providing insights into sector health.
📈 Initial Jobless Claims (8:30 AM ET):
Forecast: 223,000
Previous: 223,000
Reports the number of individuals filing for unemployment benefits for the first time, reflecting labor market conditions.
⚠️ Disclaimer: This information is for educational and informational purposes only and should not be construed as financial advice. Always consult a licensed financial advisor before making investment decisions.
📌 #trading #stockmarket #economy #news #trendtao #charting #technicalanalysis

AAON Update – Potential Bullish Double Bottom!📈 NASDAQ:AAON Update – Potential Bullish Double Bottom! 🚀
👀 NASDAQ:AAON has formed a potential Double Bottom pattern, which is typically bullish.
🔑 If the price breaks out above the red resistance zone, it could trigger a move to fill the gap (potential 12% target) and reach the green line levels!
Keep a close eye on NASDAQ:AAON for a potential breakout!

Potential Bullish Cup & Handle!☕ NASDAQ:SSRM Update – Potential Bullish Cup & Handle! 🚀
👀 NASDAQ:SSRM appears to be forming a potential Cup and Handle pattern, which is typically bullish.
🔑 Keep an eye on the development of the handle and watch for a potential breakout above the resistance level of the cup.

HTZ UP AROUND 22% TODAY. ACTIVIST INVESTOR BOUGHT $46.5M SHARES!HERTZ (HTZ) Surged nearly 22% today. A recently report revealed "Activist" Investor Bill Ackman had acquired $46.5 million shares . Should you hop on the bullish trend? Or will price cool off once the hype is over? What are your thoughts?
Disclaimer: Not Financial Advice


Undervalued, Oversold, Overlooked: MRK Hits The Key Zone!Hi all,
Merck & Co. (MRK) is a global pharmaceutical titan and is currently trading near its 52-week low of ~$79. Anchored by Keytruda’s 7% YoY revenue growth, a stable ~4% dividend yield, and an average fair value estimate of $156.59 (98% upside), MRK appears significantly undervalued.
Analysts forecast a 12-month price target of $118.05, implying 49% upside, supported by a strong pipeline and solid financials. While tariff concerns and Keytruda’s 2028 patent expiration pose risks.
Technically speaking, MRK has fallen 43% from its all-time high and has reached the strongest area on the chart—a key support zone offering a compelling opportunity to build mid- or long-term positions. This critical area is defined by multiple technical factors, creating a high-probability setup for a potential reversal:
Role Reversal Support: A broad, well-established resistance zone, aged like fine wine, has now flipped to act as support. This classic role reversal provides significant confluence to the setup.
Textbook Trendline: A perfectly respected trendline, straight out of technical analysis textbooks, has consistently held. The price has approached this trendline from higher highs, underscoring its strength as a key support level.
50% Retracement Level: A critical level often watched for potential reversals.
Monthly EMA200 Confluence: The 200-period exponential moving average on the monthly chart adds further strength to this area, reinforcing its technical significance.
Strategic Guidance:
This setup requires strong conviction. If you’re not prepared to buy in the lower gray areas of this support zone (marked on the chart), do not initiate a position.
In today’s market sentiment, your fundamental research must be robust, and technical analysis allows you to get that much confidence to make it happen!
Ask yourself: If the price falls further into the gray zones, am I willing to buy more? If your answer is yes, the current price presents a strong entry point for mid- to long-term positions.
If the answer is no—if you’re unsure about buying at lower levels or find yourself questioning what to do if prices drop further—refrain from starting a position. In volatile markets, clarity and discipline are essential. Only enter if your strategy is clear and your conviction matches the opportunity!
Good luck,
Vaido

Celsius Holdings (CELH) – Fueling the Wellness Energy RevolutionCompany Snapshot:
Celsius NASDAQ:CELH is a top-tier functional beverage brand, capitalizing on the explosive growth of health-conscious energy drinks. Known for its clean-label, metabolism-boosting formulas, CELH is a favorite among fitness enthusiasts and wellness-driven consumers.
Key Catalysts:
Strategic Acquisition – Alani Nu 🎯
Expands CELH’s reach into the women-centric energy drink market
Enhances brand diversity and strengthens product portfolio
Accelerates penetration into lifestyle & wellness channels
PepsiCo Distribution Partnership 📦
Unlocks massive scale and global shelf visibility
Boosts velocity in convenience, grocery, and fitness retail
Strategic alignment continues to fuel international expansion
Clean Energy Demand on the Rise 🌱
Consumers are actively shifting from sugary and synthetic brands to low-calorie, functional alternatives
Celsius delivers on performance + wellness—a powerful consumer value prop
Brand Loyalty & Community 👟
Strong digital engagement with a cult-like following
Supported by fitness influencers, events, and brand ambassadors
Investment Outlook:
✅ Bullish Above: $30.00–$31.00
🚀 Upside Target: $52.00–$53.00
📈 Growth Drivers: New market segments, global scaling via Pepsi, clean-energy trend momentum
📢 CELH: Redefining energy drinks with purpose, performance, and wellness.
#CELH #FunctionalBeverages #CleanEnergy #WellnessTrend

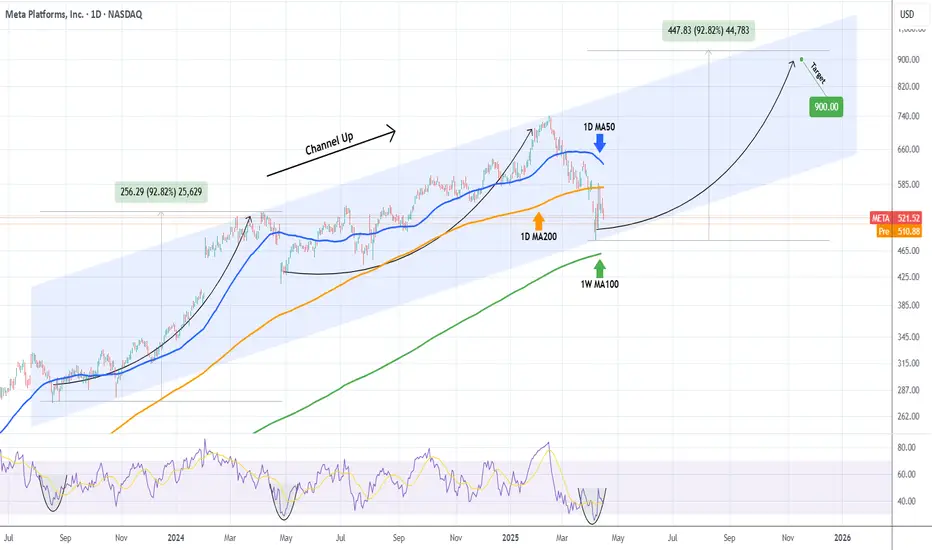
META Slow recovery but $900 possible this yearMeta Platforms (META) had a strong -35% correction in the past two months, dipping even below its 1D MA200 (orange trend-line). By doing so, it reached the bottom (Higher Lows trend-line) of the 2-year Channel Up and rebounded instantly.
The rebound has stopped so far on the 1D MA200 where it got rejected. This keeps the market neutral and the long-term bullish sentiment can only be resumed if the market breaks and closes above its 1D MA50 (blue trend-line). Until then we are neutral but only as long as the 1W MA100 (green trend-line) holds, below it the bearish trend is resumed and the correction can potentially reach -50% to -70%.
If however we close above the 1D MA50, expect a +90% rally, similar to the first Bullish Leg of the Channel Up, slow at start but aggressive after half point. Target $900.
-------------------------------------------------------------------------------
** Please LIKE 👍, FOLLOW ✅, SHARE 🙌 and COMMENT ✍ if you enjoy this idea! Also share your ideas and charts in the comments section below! This is best way to keep it relevant, support us, keep the content here free and allow the idea to reach as many people as possible. **
-------------------------------------------------------------------------------
💸💸💸💸💸💸
👇 👇 👇 👇 👇 👇
US100 - Lots of opportunities unfoldingChart Overview:
This analysis focuses on the US 100 (NAS100) index, sourced from CAPITAL.COM . The chart highlights critical price levels, Fair Value Gaps (FVGs) , and a Buy side liquidity (BSL) , offering actionable insights for traders.
Key Observations:
1. Price Action & Structure:
- The index has shown significant volatility, with a clear Break of Structure (BSL) indicating a potential shift in market sentiment.
- The price is currently navigating between key support and resistance zones , marked by horizontal levels.
2. Fair Value Gaps (FVGs):
- Two prominent FVGs are visible on the chart, representing areas where price may revisit to fill imbalances. These zones often act as magnet levels for price retracements.
- Traders should monitor these FVGs for potential entry or exit opportunities , depending on price reaction.
3. Critical Price Levels:
- Resistance Zones:
- 20,250.0 : A major psychological barrier.
- 19,750.0 - 20,000.0 : Intermediate resistance cluster.
- Support Zones:
- 17,000.0 - 17,250.0 : Strong historical support.
- 16,000.0 : A pivotal level for long-term bias.
Trading Strategy:
- Bullish Scenario: A break above 20,250.0 could signal further upside, targeting 20,500.0 and beyond.
- Bearish Scenario: A drop below 17,000.0 may confirm a deeper correction, with 16,250.0 - 16,000.0 as the next target.
- FVGs as Confluences: Use the identified FVGs alongside volume and momentum indicators to refine entries.
Timeframe & Validity:
This analysis is based on the daily timeframe (Apr 19, 2025) and remains valid until key levels are breached or new structures form.
Final Notes:
Always pair this analysis with risk management (stop-loss, position sizing) and confirm with additional indicators (RSI, MACD, volume). The market may fill FVGs before continuing its trend.
Like, follow, and comment if you found this useful! Happy trading!

Nightly $SPY / $SPX Scenarios for April 16, 2025🔮 🔮
🌍 Market-Moving News 🌍:
🗣️ Federal Reserve Speeches: Federal Reserve Chair Jerome Powell is scheduled to speak at 1:30 PM ET, providing insights into the economic outlook and potential monetary policy adjustments. Additionally, Cleveland Fed President Loretta Mester will speak at 12:00 PM ET, and Kansas City Fed President Jeffrey Schmid and Dallas Fed President Lorie Logan will speak at 7:00 PM ET.
📊 Key Data Releases 📊
📅 Wednesday, April 16:
🛍️ Retail Sales (8:30 AM ET):
Forecast: +1.2%
Previous: +0.2%
Measures the total receipts of retail stores, reflecting consumer spending trends.
🏭 Industrial Production (9:15 AM ET):
Forecast: -0.1%
Previous: +0.7%
Indicates the output of the nation's factories, mines, and utilities.
🏠 Homebuilder Confidence Index (10:00 AM ET):
Forecast: 37
Previous: 39
Assesses the confidence of homebuilders in the market for newly built single-family homes.
⚠️ Disclaimer: This information is for educational and informational purposes only and should not be construed as financial advice. Always consult a licensed financial advisor before making investment decisions.
📌 #trading #stockmarket #economy #news #trendtao #charting #technicalanalysis

DOW JONES Free Signal! Sell!
Hello,Traders!
US30 made a nice bullish
Rebound from the lows it
Plunged towards during the
High volatility of the last weeks
But now that the market seems
To have calmed down a bit we
Are seeing a retest of the
Horizontal resistance of 40,725
And a local pullback so we are
Locally bearish biased, therefore
We can enter a short trade
With the Take Profit of 39,700
And the Stop Loss of 40,956
Sell!
Comment and subscribe to help us grow!
Check out other forecasts below too!
Disclosure: I am part of Trade Nation's Influencer program and receive a monthly fee for using their TradingView charts in my analysis.

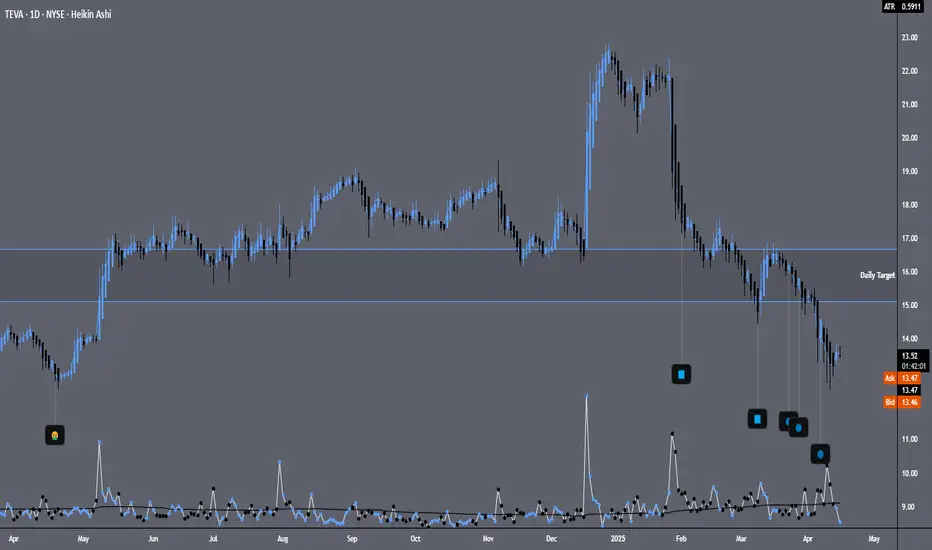
TEVALooks like price is near a support zone dating back to around late April 2024 where the "throw up" emoji is. After the bearish volume spike on 1/29/25 happened, price shot down strong and since then seems to be widening its stance. From March 13th - April 9th bearish volume slowly increased but not with the same authority that happened in January. Bearish volume seems to be simmering down since the 9th and i want to see if we get some consolidation before a test of the nearby daily target zone.
If price continues to shift down and another trade opportunity presents itself, I'll take another look and reassess.
PFEAt the current price, I'm looking for a retest toward the daily target zone located on the chart. On 3/21 PFE announced news about dropping the decision to move forward with the weight loss drug. Since then, price dropped down in spike like fashion. After the big volume spike, on that date, volume cam down and slowly started to build up again for the bears but there may be some weakness here. I wonder if this is a good price range where short sellers are starting to get concerned? I don't care for news and and am mainly a volume trader. So this trade will be interesting and maybe we get some attention at some point.
If price goes lower, we will revisit if another opportunity presents itself.

Daily Price Action: Dow Jones DJI Tuesday 4/15/2025In this video, we are looking into the potential daily price action of DJI.

Daily Price Action: Nasdaq NDX Tuesday 4/15/2025In this video, we are looking into the potential daily price action of NDX.

AMAZON is on its 3rd historic +1000% growth Bull Cycle.Amazon (AMZN) almost has been trading within a multi-year Channel Up pattern since the Housing Bubble bottom in November 2008 and this month almost touched its 1M MA50 (blue trend-line).
With the exception of the 2008 Housing Crisis and the 2022 Inflation Crisis, which bottomed on the 1M MA100 (green trend-line), the 1M MA50 has never been broken. In fact it has been the key Support of every Bull Cycle that surprisingly has so far peaked on a +1051% rise.
As you can actually see by the 1M RSI, such corrections, like the one in the past 3 months, are quite common within the Channel Up and offer excellent long-term buy entries.
So, technically the Inflation Crisis bottom (December 2022) on the 1M MA100 has initiated Amazon's 3rd historic Bull Cycle within this pattern and based on the previous two, it may also peak after a +1051% rally inside 2028. Our projected Target on this is $900.
Would you miss out on such an opportunity in the past?
-------------------------------------------------------------------------------
** Please LIKE 👍, FOLLOW ✅, SHARE 🙌 and COMMENT ✍ if you enjoy this idea! Also share your ideas and charts in the comments section below! This is best way to keep it relevant, support us, keep the content here free and allow the idea to reach as many people as possible. **
-------------------------------------------------------------------------------
💸💸💸💸💸💸
👇 👇 👇 👇 👇 👇
