AMZN LONG/SHORT SET UP(Amazon) If $160.00 holds we can see $200
if we break below$160.00 we could see $140-$120
LONG TRADE
Entry 1 $175.00
Entry 2 $165.00
Stop loss $155.00
Take profit 1- $195.00
(Close 33%)
Take profit 2- $215.00
(Close 66%)
Take profit 3-$230.00
Stocks

Quantum's IWM Trading Guide 4/8/25IWM (iShares Russell 2000 ETF) - Sector: Broad Small-Cap ETF (Russell 2000)
Sentiment:
--Bearish (softening). Pre-market put volume eased, RSI 44 up from 42, X posts overnight hint at an oversold bounce despite tariff fears, suggesting a less dire tone.
Tariff Impact:
--Moderate. Industrials/financials exposure persists.
News/Catalysts:
--Consumer Credit (April 8) could spark a relief rally if strong; X posts on tariff delays offer faint hope, though bearish bias lingers.
Technical Setup
-Weekly Chart:
---HVN above as resistance, weekly low as support.
---Downtrend (8-week EMA < 13-week < 48-week).
---RSI 44 (less weak), MACD below signal (histogram narrowing)
---Bollinger Bands near lower band,
---Donchian Channels below midline,
---Williams %R -70 (easing from -74).
-One-Hour Chart:
---Support at yesterday’s low, resistance at midday high, weekly confluence.
---RSI 42 (up from 40),
---MACD below signal (histogram less negative),
---Bollinger Bands near lower band,
---Donchian Channels below midline,
---Williams %R -72 (up from -76).
-10-Minute Chart:
---Pre-market bounce attempt, 8/13/48 EMAs flat (less steep),
---RSI 42 (up from 38),
---MACD flat near zero.
Options Data:
---GEX: Bearish (softening)—pinning pressure eased slightly overnight.
---DEX: Bearish (softening)—put delta leads but less aggressively.
---IV: Moderate—25–30% vs. 20–25% norm, steady volatility.
---OI: Put-heavy—high OI below close persists.
---Directional Bias: Bearish (softening). GEX’s reduced pinning suggests less dealer-driven downside, DEX’s put delta bias weakens, moderate IV supports some volatility but not extreme moves, and put-heavy OI anchors prices lower—still bearish but with less conviction.
Sympathy Plays:
--TNA (Direxion Small Cap Bull 3X): Falls 3x if IWM dumps, rises if IWM rebounds.
--TZA (Direxion Small Cap Bear 3X): Gains if IWM dumps, fades if IWM rallies.
--Opposite Mover: IWM dumps → TZA rallies; IWM rallies → TNA surges.
Sector Positioning with RRG:
--Sector: Broad Small-Cap ETF (Russell 2000).
--RRG Position: Lagging Quadrant. Tariff/rate drag persists.
Top 5 Movers (Russell 2000): SMCI (+2%), MARA (+1.5%), RIOT (+1%), CVNA (+0.8%), PLUG (+0.5%).
Bottom 5 Movers (Russell 2000): AMC (-3.5%), RKT (-3%), UPWK (-2.5%), ZETA (-2%), RUN (-1.8%).

Nike (NKE) Share Price Falls to Lowest Level Since 2017Nike (NKE) Share Price Falls to Lowest Level Since 2017
The chart for Nike (NKE) shows that the share price has dropped to around $55 – levels last seen in November 2017.
Since the start of 2025, the stock has declined by approximately 27%.
Why Has Nike’s Share Price Dropped?
As noted in our analysis from September 2024, Nike shares had been trending downward for several months due to intense competition. However, President Trump’s tariffs have become the dominant bearish factor.
This is largely because Nike relies heavily on manufacturing operations in Asia – many of which have been directly affected by the newly imposed tariffs.
What’s Next?
According to the Wall Street Journal, manufacturers are taking a wait-and-see approach. They’re reluctant to shift production out of Asia, which could mean higher prices for American consumers. A full return to U.S. production is unlikely due to:
→ a shortage of skilled workers and suppliers;
→ significantly higher wages in the U.S. compared to Asia;
→ relocating production from Asia is a complex business migration, not just a factory move – a process many companies might not be prepared for.
Some firms are reducing their margins or optimising logistics, but most are hoping to weather the storm or delay major changes.
Technical Analysis of Nike (NKE) Shares
The price is forming a downward channel (highlighted in red), with the following characteristics:
→ the median line provided temporary support, but the early April rebound attempt was very weak;
→ the lower boundary of the channel now appears to be acting as support.
The RSI indicator suggests strong oversold conditions. Bulls might take comfort in the proximity of the psychological $50 mark strengthening this support level. However, it seems that only positive developments on the tariff front are likely to reverse sentiment meaningfully.
According to WSJ analysts, Trump’s recent comments hint at possible negotiations. But unless the President changes his stance, Mexico, Brazil, and India – nations well-placed to act as intermediaries between China and the U.S. – could emerge as the main beneficiaries.
This article represents the opinion of the Companies operating under the FXOpen brand only. It is not to be construed as an offer, solicitation, or recommendation with respect to products and services provided by the Companies operating under the FXOpen brand, nor is it to be considered financial advice.

How Can You Use the STRAT Method in Trading?How Can You Use the STRAT Method in Trading?
The STRAT method is a unique trading approach that is supposed to simplify market analysis by breaking price action into clear, actionable scenarios. Developed by Rob Smith, it focuses on candlestick patterns, scenarios, and timeframe alignment to help traders better understand market structure. This article explores the key components of the STRAT method, its practical application, and how it can potentially refine trading strategies.
What Is the STRAT Trading Method?
The STRAT method is a trading strategy created by Rob Smith. It’s designed to simplify technical analysis by focusing on price action and breaking down market movements into clear, actionable steps. At its core, the STRAT strategy categorises price behaviour into three scenarios—inside bars (1), directional bars (2), and outside bars (3)—helping traders identify potential opportunities and understand the market structure.
One of the STRAT’s standout features is its emphasis on timeframe continuity, where traders examine how price movements align across different timeframes, such as daily, weekly, and monthly charts. This alignment helps traders gauge the broader market direction, potentially improving their analysis.
The STRAT trading method also uses specific candlestick patterns to signal potential reversals or continuations. For example, an inside bar (Scenario 1) indicates price consolidation, often preceding a breakout. A directional bar (Scenario 2) suggests trending movement, while an outside bar (Scenario 3) reflects heightened volatility by capturing both higher and lower price ranges.
Unlike some trading approaches that rely heavily on indicators, the STRAT focuses on raw price action, giving traders a clearer, no-nonsense view of market dynamics. It’s an accessible and structured way to analyse charts and make decisions based on what the market is doing right now.
Key Components of the STRAT Trading Strategy
The STRAT trading strategy stands out because of its straightforward approach to breaking down price action. As mentioned above, inside bars, directional bars, and outside bars are central scenarios. These scenarios categorise how the price behaves within a given timeframe, providing a framework for traders to interpret the market. Let’s delve into each component in detail.
Scenario 1: Inside Bar
An inside bar forms when the current candlestick's high and low remain within the range of the previous candlestick. In other words, the market is consolidating, showing no breakout beyond the prior candle’s extremes. Traders often interpret this as a pause or a moment of indecision in the market.
What makes inside bars significant is their potential to precede larger price movements. For example, after a series of inside bars, a breakout often occurs when the price breaks above or below the consolidation range. While this pattern alone doesn’t confirm direction, it signals the market is storing energy for a potential move.
Scenario 2: Directional Bar
A directional bar, also called a “2” in STRAT terminology, occurs when the price breaks either the high or low of the previous candle but not both. This creates a clear directional move—either upward (2 up) or downward (2 down).
These bars are essential because they indicate that the market has picked a direction. A “2 up” shows bullish momentum, while a “2 down” signals bearish activity. These movements are especially useful when aligned with other factors, such as larger trends or support and resistance levels.
Scenario 3: Outside Bar
The outside bar is the most volatile of the three. It forms when the current candlestick's high exceeds the previous candle’s high, and its low breaks below the previous low. Essentially, the price covers both sides of the prior range, capturing significant market activity.
Outside bars often suggest a battle between buyers and sellers, leading to volatility. These bars can provide insights into reversals or continuing trends, depending on their context within the broader market structure.
Expanding and Contracting Markets
The STRAT method also places significant emphasis on understanding the expanding and contracting market phases, which offer critical insights into market dynamics. These phases reflect shifts in volatility and price behaviour, helping traders interpret broader market conditions.
Expanding markets occur when price action creates both higher highs and lower lows compared to previous bars or ranges. This phase often signals heightened volatility as buyers and sellers battle for control, creating larger swings. Scenario 3 (outside bars) typically appears during this phase, capturing the market’s attempt to push in both directions. Expanding markets can provide potential opportunities for traders who are prepared to navigate rapid price movements.
Contracting markets, on the other hand, are characterised by shrinking ranges, with lower highs and higher lows. This consolidation phase often results in inside bars (Scenario 1) and suggests indecision or reduced momentum. Traders frequently watch for potential breakouts as the market transitions out of contraction.
Combining Scenarios and Context
Ultimately, there are many combinations of these bars under the STRAT method, each with names like the 3-2-2 Bearish Reversal, 2-2 Bearish Continuation, 1-2-2 Bullish Reversal, and so on. For traders new to this system, it might be easier to start with a handful of patterns and practice them before adding others to their arsenal.
Some of the basic starting patterns include:
2-1-2 Reversal
3-1-2 Reversal
2-1-2 Continuation
2-2 Continuation
However, each of these scenarios becomes even more meaningful when paired with other market data, such as higher timeframes or candlestick structures. For instance, patterns like hammers or shooting starts often emerge within these scenarios, offering specific signals to traders.
Timeframe Continuity: A Core Pillar
Timeframe continuity is a fundamental aspect when interpreting the STRAT candle patterns, offering traders a way to align their analysis across multiple timeframes. It’s about ensuring that the price action on smaller timeframes complements what’s happening on larger ones. When all timeframes “agree,” it can provide a clearer picture of market direction and potentially improve the decision-making process.
In practice, traders using the STRAT in stocks, forex, commodities, and other assets often look at three primary timeframes: the daily, weekly, and monthly charts. Each represents a piece of the puzzle. For example, if a trader sees a bullish “Scenario 2” (directional bar) on the daily chart, but the weekly chart shows a bearish pattern, this misalignment might signal caution. However, when the daily, weekly, and monthly timeframes all show bullish directional movement, it creates a stronger case for a trend continuation.
Timeframe continuity also helps traders filter out noise. Shorter timeframes, like the 15-minute or hourly charts, can produce conflicting signals, leading to overtrading or confusion. By focusing on the larger timeframes first, traders can ground their analysis in broader market trends and avoid reacting impulsively to minor fluctuations.
Practical Application of the STRAT Method
Applying the STRAT method involves a systematic approach to analysing charts and identifying potential opportunities. While every trader may adapt the method to their own style, the process generally follows a logical flow. Here’s how it can be broken down:
Step 1: Understanding the Current Scenario
Traders typically start by identifying the active scenario (1, 2, or 3) on their chosen timeframe. This initial classification helps to set the context. For instance, in the EUR/USD daily chart above, we initially see an outside bar (Scenario 3), followed by two inside bars (Scenario 1)—a 3-1-1 Bullish Reversal pattern; this transitions into a 1-2 Bullish Reversal before a 2-2 Bullish Continuation. In other words, the market is seen as entering a bullish phase.
Step 2: Aligning Multiple Timeframes
The next step involves assessing how the current scenario fits within the larger market structure by checking higher timeframes. In the EUR/USD example, the monthly chart shows three consecutive bullish directional bars (Scenario 2), also known as a 2-2 Bullish Continuation. This is supported by the weekly chart. Initially, there are two bearish directional bars before a bullish outside bar (Scenario 3) and a bullish directional bar. This indicates an alignment of bullish momentum, indicating a higher probability for the daily chart setup.
Step 3: Identifying Supporting Patterns and Signals
Within the scenario, specific candlestick patterns, like hammers or shooting stars, alongside key support and resistance levels, often provide additional context. These signals are believed to be more effective when they align with the broader market direction and timeframe continuity.
In the EUR/USD example, the weekly chart shows a candle resembling a hammer (the outside bar), while the daily chart shows a pattern resembling a Three Stars in the South formation (the 3, 1, 1 candles). While rare, the three stars in the south pattern can signal sellers are losing momentum, when:
The first candle features a long body and long lower wick.
The second candle has a shorter body and closes above the first candle’s low.
The third candle has another short body with minimal wicks and a range inside the second candle.
While both formations don’t meet the technical criteria for their respective patterns, a trader might consider them to add weight to the bullish idea. The weekly chart also shows the price breaking past a previous resistance level, which adds confluence.
Step 4: Entering and Exiting
A trader would typically enter as the candle on their chosen timeframe closes. A stop loss could be set beyond the entry candle or a nearby swing high/low. Some traders prefer to close the position depending on the next candle close and corresponding scenario, while others might target a particular support/resistance level or use multi-timeframe analysis to find a suitable exit point.
Advantages and Challenges of the STRAT Method
The STRAT method offers a unique, structured approach to trading, but like any strategy, it comes with both advantages and challenges. Understanding these can help traders decide how to integrate it into their approach.
Advantages
- Clarity in Analysis: By categorising price action into simple scenarios, the STRAT’s patterns simplify market behaviour, reducing ambiguity.
- Focus on Price Action: The method relies on raw price data rather than indicators, offering a direct view of market dynamics.
- Adaptability Across Markets: Whether trading equities, forex, or commodities, the STRAT applies universally to any market with candlestick data.
- Improved Consistency: Its rules-based framework helps traders avoid impulsive decisions and stay aligned with their analysis.
Challenges
- Learning Curve: Understanding the nuances of scenarios and timeframe continuity requires time and practice.
- Patience Required: Waiting for alignment across multiple timeframes may lead to fewer trade opportunities, which may frustrate active traders.
- Context Dependency: While structured, the STRAT still requires interpretation, and outcomes depend on how well traders incorporate broader market factors.
The Bottom Line
The STRAT method offers traders a structured way to analyse price action, combining scenarios, candlestick patterns, and timeframe continuity to navigate markets with confidence. While it requires discipline to master, its clear framework can potentially improve decision-making.
FAQ
What Is the STRAT Strategy by Rob Smith?
Rob Smith developed the STRAT strategy, a trading method that simplifies technical analysis by categorising price action into three STRAT candle scenarios: inside bars, directional bars, and outside bars. It focuses on understanding market structure, using timeframe continuity and actionable signals to interpret trends and reversals.
What Is the STRAT Method of Trading?
The STRAT method is a rules-based approach to trading that prioritises price action over indicators. It uses specific candlestick patterns and scenarios to identify potential trading opportunities and aligns multiple timeframes to provide a cohesive market view.
What Is a Rev Strat?
According to Rob Smith, a “rev strat” refers to particular setups. First is a 1-2-2, initially with an inside bar, then a directional bar in one direction, and finally a directional bar in the opposite direction, marking a possible reversal. The second is a 1-3 setup, with an inside bar followed by an outside bar. This signals an expanding market in the STRAT, meaning a period of heightened volatility, and is considered bullish or bearish based on the outside bar’s direction.
This article represents the opinion of the Companies operating under the FXOpen brand only. It is not to be construed as an offer, solicitation, or recommendation with respect to products and services provided by the Companies operating under the FXOpen brand, nor is it to be considered financial advice.

Coinbase Global, Inc. Goes Bullish —The Correction Is Over!COIN's bearish volume peaked November 2024. Ever since this date, peak bearish volume continued to drop. As we approached today, the lowest price since February 2024, COIN ended up closing with a green bar rather than a red one; the bears are gone.
I am giving you technical analysis in a very simple way. When volume and price produce a divergence, it means that we are on the verge of a change of trend.
Coinbase found support just below the September 2024 low. This support is also a long-term higher low compared to February 2024.
The correction was big and strong. Lasting more than 4 months and reaching almost 60%. A huge drop, but the market never drops forever, it never moves in one single direction, it moves in waves.
Did you enjoy the bearish wave? Did you suffer through this wave?
No problem, after a bearish wave comes a bullish wave. The good news is that the bearish wave lasted 4 months but the bullish wave will go for 8-12. That's a great deal. Go down 4 months and then growth for 8 months straight.
Coinbase is preparing to grow, together with Bitcoin, NVIDIA and the Stock market.
The bears are out. We will gain control of the market. It is the bulls turn. We are going up.
Namaste.

Nightly $SPY / $SPX Scenarios for April 8, 2025🔮 🔮
🌍 Market-Moving News 🌍:
🇺🇸📊 NFIB Small Business Optimism Index Release: The National Federation of Independent Business (NFIB) will release its Small Business Optimism Index for March at 6:00 AM ET. This index provides insights into the health and outlook of small businesses, which are vital to the U.S. economy.
🗣️ Federal Reserve Speeches:
San Francisco Fed President Mary Daly is scheduled to speak at 8:00 AM ET.
Chicago Fed President Austan Goolsbee will deliver remarks at 7:00 PM ET.
📊 Key Data Releases 📊
📅 Tuesday, April 8:
📈 NFIB Small Business Optimism Index (6:00 AM ET):
Forecast: 100.7
Previous: 102.8
Assesses the health and outlook of small businesses, which are vital to the economy.
⚠️ Disclaimer: This information is for educational and informational purposes only and should not be construed as financial advice. Always consult a licensed financial advisor before making investment decisions.
📌 #trading #stockmarket #economy #news #trendtao #charting #technicalanalysis

SoFi Technologies (SOFI) – Prepping for Liftoff?Analysis Overview:
The chart suggests that SOFI may be setting up for a major bullish reversal, but confirmation is still needed. Let’s break it down:
Key Bullish Factors:
✅ Optimal Trade Entry (OTE)
Price is currently sitting at an OTE level, a premium zone for long setups often used by smart money. These zones historically mark powerful reversal points.
✅ Monthly Fair Value Gap (FVG) Respected
The stock tapped into a monthly FVG—a high-probability demand zone—suggesting institutional interest. A break and close above this zone would strengthen the bullish case significantly.
✅ 30 Moving Average (MA) as Confirmation
Price is still below the 30MA. A clear break and close above the 30MA would serve as the first strong confirmation that buyers are regaining control.
✅ Massive Upside Potential
If this plays out, the first target is the previous buy-side liquidity at $18.33, and if momentum sustains, we could even see a long-term move toward the all-time high at $28.54—a potential 228% gain from current levels.
What We Want to See Before Full Confidence:
🔹 Price to break and close above the 30MA
🔹 Clear displacement through the Monthly FVG
🔹 Sustained bullish volume stepping in
Conclusion:
SOFI could be gearing up for a powerful upside run, but let the market confirm it. Watch the 30MA and how price behaves around the FVG. If those get respected and price pushes higher—this could be a sleeper play to watch in 2025.
🧠 As always... DYOR (Do Your Own Research)!

BIG 1,100% from $4 to $48 $JNVRBIG 1,100% 🚀 from $4 to $48 🤯 Another stock not caring about what overall market does NASDAQ:JNVR
I posted it in chat premarket while it was still 200% on the day, then mentioned in few times again. Hope you saw it on time!
There are ALWAYS stocks that go up no matter the overall market!

NIKKEI Long From A Massive Support! Buy!
Hello,Traders!
NIKKEI stock index has
Lost almost 27% from the ATH
Which means it is clearly oversold
And the index is about to retest
A massive horizontal support level
Of 30,000 which is a great spot
For going long on the index
And even if the support gets
Broken I would still hold the
Position expecting a rebound
Buy!
Comment and subscribe to help us grow!
Check out other forecasts below too!
Disclosure: I am part of Trade Nation's Influencer program and receive a monthly fee for using their TradingView charts in my analysis.

HERTZ (HTZ) SEES BULLISH MOVEMENT DESPITE TARIFFSHertz (HTZ) saw a bullish open this morning. Conversely many other assets saw a bearish open. Will Hertz continue this bullish movement, or could this be just a sell off that leads to a stronger downtrend?

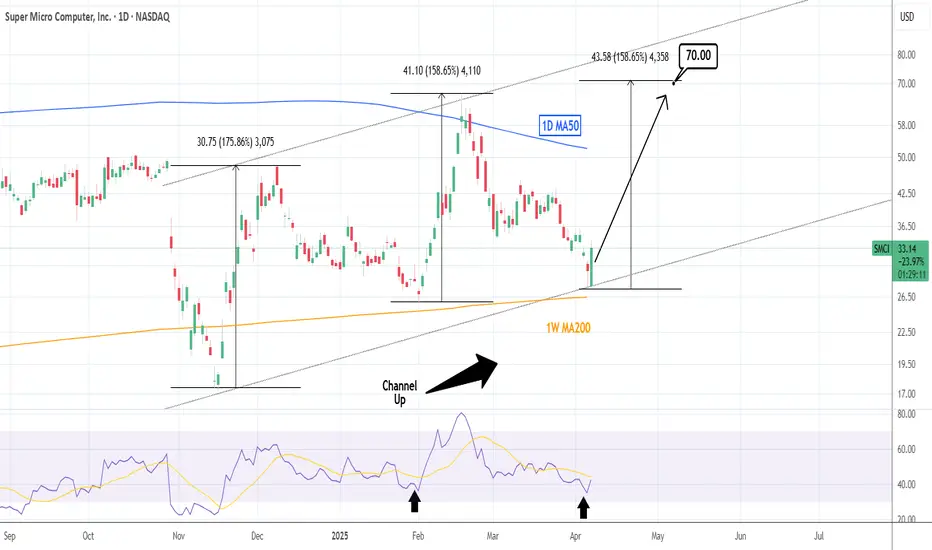
SMCI: Enormous buy opportunity for a $70 Target.Super Micro Computer went from oversold to almost neutral on its 1D technical outlook (RSI = 42.789, MACD = -2.030, ADX = 39.343) as it is having an enormour turnaround on the 1W MA200 and the bottom of the Channel Up today. This is so far the biggest 1D green candle since January 19th 2024. The 1D RSI is on the same rebound as the February 3rd bottom was, so at least a +158.65% bullish wave is to be expected. Go long, TP = 70.00.
## If you like our free content follow our profile to get more daily ideas. ##
## Comments and likes are greatly appreciated. ##
Bitcoin Retests 77k Neckline Support! This is huge!Traders,
As we watch the tariff FUD destroy traders everywhere, I want you to be aware that we have just landed on something extremely critical for support, the neckline of our long-standing CUP and HANDLE that began forming at the end of 2021. The neckline currently stands at an approximate price of 76-77k. If you'll remember in my last post a couple of days ago regarding the SPY, I suggested that SPY could drop as low as 467 and Bitcoin could hit 76k. Bitcoin has arrived at it's 76k support and if this doesn't hold, crypto is in serious trouble. I am not trying to be an alarmist here. You all know that I am an eternal optimist when it comes to crypto, but in this case we have to prepare our trades accordingly. The break of 76k support could send Bitcoin and crypto down as far at 50k. I know this is hard to believe. Even as I am typing this I am having a hard time grasping that we'd get there, but this is what I am seeing and I have to inform you all accordingly. If we're lucky, that neckline holds. But plan accordingly.
✌️Stew

Some stocks do +1,650% verticals while the rest of market dropsNot all stocks follow overall market direction, just 80% of them. NASDAQ:AREB wasn't one of them.
We focus on the other 20% which are having massive verticals no matter the overall market or economy situation.
TOTAL Week: +121.4% realized profit from alerts posted in chat 💯
To good to be true?
Been doing it for 20+ years.
When should one beat the market with perfected strategy if not after 2 decades and nearly 100k hours invested?
Ever heard of 10,000 hours invested to master something.
Then what does 100k make you?
Master Jedi?
Sure feels like it if your 2 stocks are doing +70% +300% in a day while the world is crashing 🤷🏻♂️
All fully verified with timestamps, feel free to check and verify.

ITS TIME , FINAL WAVE FOR BITCOIN HAS BEGAN The final wave for Bitcoin has officially started; 200k by September 2025 is the call. So far, since October 2024, we have been getting every macro move correct. Going to avoid repeating a lot of content from the previous two TAs; check it out below.
The lower high on the RSI called the momentum shift on this one; it was clear.
December 17th, 2024, calling for a pullback down to 82k for wave 4 to complete; it hit 77k, pretty close.
So last time, I was wrestling with two different dates for a cycle top; the first one was May 2025, and the second was September 2025.
It is clear to me now that mid to late September 2025, Bitcoin will peak at around 200k. It could go slightly higher, but the 185-200k region has a higher outcome.
So, I've been using this small-time Fib, and last time when we hit the 0.618, it was the breakout week for Bitcoin from the long range. We're here again; this week is the big pivot and start of wave 5.
The hash ribbon has confirmed a buy signal, and more importantly, it flashed buy in my Time Fibonacci week. Amazing. If you've been with me for years, you already know that this is the best signal for Bitcoin there is. It is so damn good; this gives so much more weight to my thesis.
Stars seem to align again. They constantly try to shake you out; this is the game. Who is going to fade the hash ribbon buy? It's been the easiest play time and time again.
Seriously, though, for just a moment—are you really going to fade the hash ribbon? :)

Nas100 - Huge bear trap or further downside?The Nasdaq 100 has recently broken a critical rising trendline that has supported its bullish trajectory for an extended period. This break signifies a potential shift in market sentiment, suggesting that the prior uptrend may be losing steam. When an established trendline is breached, it often signals a change in the market's direction, indicating that buyers are losing control and sellers are starting to assert dominance.
In addition to the trendline break, the Nasdaq 100 has now fallen below all of its key moving averages—namely, the 50-day, 100-day, and 200-day moving averages. These moving averages are widely followed indicators of trend strength, and their loss is typically a bearish sign. When prices drop below these averages, it signals weakening momentum, and it becomes harder for the index to regain upward traction without strong buying pressure.
The weekly timeframe shows a beautiful support level if the bulls fail to reclaim all the key moving averages.
Together, the break of the rising trendline and the loss of key moving averages suggest that the Nasdaq 100 could be entering a phase of increased volatility and downward pressure. Traders should closely monitor the index for potential further declines or a failure to reclaim these key technical levels, as they could signal deeper market corrections.
Thanks for your support.
- Make sure to follow me so you don't miss out on the next analysis!
- Drop a like and leave a comment!

Cleveland-Cliffs (CLF) BUY SETUPlooking for a strong recovery on us steel sector in 2025 and 2026.
trade carefully.
good luck.

CAN INTEL JOIN THE TRILLION DOLLAR COMPANY CLUB? last couple years business was bad for intel and hammoraging money.
but if 18A and 14A succeeds , their foundry will provide lot of income.
i think in the long term intel also can be a trillon dollar worth company.

SPX POSSIBLE RECOVERY UP TO 7000-7500first quarter wasn't bright for spx. but it can recover at moderate phase.

Quantum's BAC Ultimate Weekly OutlookBAC (Bank of America Corporation) - Sector: Financials (Banking)
Sentiment: Bearish. Put volume rises, RSI 45 weakens, X posts note banking fears from tariffs/economic uncertainty.
Tariff Impact: Moderate. Tariffs may slow growth, impacting loans, but domestic focus softens the blow. Sentiment drives more than fundamentals.
News/Catalysts: Banking sentiment shifts on X. Consumer Credit (April 8) could signal credit trends.
Technical Setup:
Weekly Chart: HVN above as resistance, weekly low as support. Downtrend (8-week EMA < 13-week < 48-week). RSI 45 (neutral, fading), MACD below signal (negative histogram widening), Bollinger Bands near lower band, Donchian Channels below midline, Williams %R -68 (nearing oversold).
One-Hour Chart: Support below, resistance near highs, weekly alignment. RSI 42, MACD below signal (negative histogram growing), Bollinger Bands at lower band, Donchian Channels below midline, Williams %R -74 (close to oversold).
10-Minute Chart: Bearish breakdown, 8/13/48 EMAs down, RSI 42 weakening, MACD flat near zero.
Options Data:
GEX: Bearish—pinning below close, dealers hedge puts to resist upside.
DEX: Bearish—put delta leads, selling bias.
IV: Moderate—slightly above norm (e.g., 25–30% vs. 20–25%), uncertainty raising prices. Supports GEX pinning, boosts DEX bearish bias.
OI: Put-heavy—high OI at lower strikes, capping downside.
Sympathy Plays:
JPM (JPMorgan Chase): Moves in sync—rises if BAC takes off, falls if BAC dumps.
C (Citigroup): Correlates via banking—gains with BAC rallies, drops with sell-offs.
Opposite Mover: BAC dumps → defensive stocks like JNJ may rally; BAC rallies → JPM/C surge.
Sector Positioning with RRG:
Sector: Financials (Banking).
RRG Position: Weakening Quadrant. BAC’s economic sensitivity fades vs. XLF as tariffs/rates weigh.
Targets: Bullish +3% (hourly resistance); Bearish -5.1% (weekly support).
Trade Idea: Weekly put (exp. April 11) on 10-min breakdown, target support, stop above close.

Weekly $SPY / $SPX Scenarios for April 7–11, 2025🔮 🔮
🌍 Market-Moving News 🌍:
🇺🇸📈 New U.S. Tariffs Begin April 9: Trump’s “Liberation Day” tariffs — 10% on all imports, 25%+ on key sectors — could stir volatility.
🇨🇳📦 China Retaliates April 10: A 34% retaliatory tariff on U.S. goods raises trade war fears and inflation concerns.
🏦💰 Big Bank Earnings Kick Off: JPMorgan, Wells Fargo, and BlackRock will report. Markets will watch closely for financial health signals.
📉📊 March CPI Report Coming April 10: Inflation data could sway the Fed’s rate path. Forecasts call for a 0.1% increase.
⚠️ Volatility Alert: Piper Sandler projects a possible 5.6% move in the S&P 500 this week — up or down.
📊 Key Data Releases 📊
📅 Monday, April 7:
🗣️ Fed Gov. Kugler Speaks (10:30 AM ET)
💳 Consumer Credit (3:00 PM ET) — Forecast: $15.5B | Prev: $18.1B
📅 Tuesday, April 8:
📈 NFIB Small Biz Optimism (6:00 AM ET) — Forecast: 100.7
🗣️ Fed’s Mary Daly Speaks (8:00 AM ET)
📅 Wednesday, April 9:
📦 Wholesale Inventories (10:00 AM ET) — Forecast: 0.4% | Prev: 0.8%
🗣️ Fed’s Barkin Speaks (11:00 AM ET)
📝 FOMC Minutes (2:00 PM ET)
📅 Thursday, April 10:
📉 Jobless Claims (8:30 AM ET) — Forecast: 219K
📊 CPI (8:30 AM ET) — Forecast: 0.1% | Prev: 0.2%
🗣️ Fed Gov. Bowman Testifies (10:00 AM ET)
📅 Friday, April 11:
🏭 PPI (8:30 AM ET) — Forecast: 0.2% | Prev: 0.0%
🗣️ Fed’s Musalem Speaks (10:00 AM ET)
⚠️ Disclaimer: This information is for educational and informational purposes only and should not be construed as financial advice. Always consult a licensed financial advisor before making investment decisions.
📌 #trading #stockmarket #economy #news #trendtao #charting #technicalanalysis

Quantum's Premium IWM Weekly OutlookSentiment
Overall Sentiment: Bearish with potential for reversal.
Options Activity: Recent data shows elevated put volume over calls (e.g., 8 puts Ascending Triangle DEX suggests a bearish directional bias. Posts on X indicate traders are eyeing short setups, reinforcing this sentiment.
1 OTM Premiums:
0DTE (April 7 expiration):
Call: $182 strike, premium $1.20 (moderate IV, ~35%).
Put: $180 strike, premium $1.35 (moderate IV, ~35%).
Weekly (April 11 expiration):
Call: $182 strike, premium $1.45 (moderate IV, ~32%).
Put: $180 strike, premium $1.40 (moderate IV, ~32%).
Notes: Premiums are kept under $1.50 for cost efficiency in 0DTE and weekly trades. IV levels are moderate, reflecting recent volatility spikes but not extreme conditions, making these contracts attractive for short-term plays.
Technical Indicators:
Weekly EMAs (8/13/48): The 8-week EMA ($198.50) is below the 13-week ($202.10) and 48-week ($208.30), confirming a downtrend.
RSI (14-week): 32, nearing oversold territory, hinting at a possible bounce.
Market Context: Small-cap stocks like IWM have been under pressure due to tariff fears and a hawkish Fed stance. However, oversold conditions and seasonal strength in April could signal a relief rally.
Potential: Continuation of the downtrend is likely unless a catalyst reverses sentiment, but a short-term bounce to $185–$190 is plausible given oversold readings.
Tariff Impact
Exposure: Moderate to severe.
Analysis: IWM tracks the Russell 2000, comprising small-cap U.S. companies, many of which are domestically focused (e.g., manufacturing, retail). A 10% universal tariff, 25% on Canada/Mexico, or 46% on Vietnam could raise input costs for these firms, squeezing margins. Sectors like industrials (20% of IWM) and consumer discretionary (15%) are particularly vulnerable. However, tariff impact may be overstated—rising interest rates and a strong dollar are likely stronger drivers of recent weakness. Critically, the narrative around tariffs often amplifies fear beyond fundamentals, offering contrarian opportunities if panic subsides.
News/Catalysts
Recent News: Trump’s tariff rhetoric intensified last week, with small-caps hit hardest (IWM down 9.5% in 1M). The Fed’s hawkish December stance continues to weigh on risk assets.
Upcoming Events:
April 8: Consumer Credit data release—could signal consumer health, critical for small-cap earnings.
Mid-week: Potential tariff policy updates—speculative but impactful.
Speculative Catalysts: X posts highlight short interest in IWM and oversold conditions, suggesting a squeeze potential. A surprise Fed pivot or tariff rollback could spark a massive rally.
Alignment: Small-caps are sensitive to economic data and policy shifts, making IWM a prime candidate for volatility-driven moves.
Technical Setup
Weekly Chart:
Key Levels:
High Volume Node (HVN): $195–$199 (prior support, now resistance).
Monthly Open: $199.78 (resistance).
Weekly Low: $176.67 (support).
Trend: Downtrend since March peak ($208.52), testing year-lows.
One-Hour Chart:
Support: $179–$180 (confluence with weekly low).
Resistance: $182.50–$184 (prior consolidation zone).
10-Minute Chart:
Entry/Exit:
Bullish: Break above $181.50 (8-EMA) with a hammer candle for a long to $183.
Bearish: Breakdown below $180 with volume for a short to $177.
EMAs (8/13/48): 8 ($181.20) > 13 ($181.00) < 48 ($182.30)—choppy, no clear trend intraday.
Indicators:
RSI (14): 38 (10-min), neutral but rising—watch for divergence.
MACD: Near zero line, flat—momentum stalling.
Options Data Weekly Overview
Gamma Exposure (GEX): Bearish—pinning near $180–$182, dealers hedging accelerates downside below $180.
Delta Exposure (DEX): Bearish—put-heavy activity signals directional selling.
Vega Exposure (VEX): Neutral—moderate volatility potential, no extreme IV spike expected.
Implied Volatility (IV): Moderate (~32–35%)—elevated but manageable, favoring sellers over buyers.
Open Interest (OI): Bearish—high OI at $180 put and $185 call strikes, capping upside.
Potential Price Targets
Bullish: $185 (+2.2%)—tests weekly HVN; $190 (+5%) if momentum builds.
Bearish: $177 (-2.3%)—revisits year-low; $170 (-6.2%) on tariff escalation.
Trade Idea
Bullish 0DTE (April 7):
Trade: Buy $182 Call @ $1.20.
Entry: Break above $181.50.
Target: $183 (profit $0.80, +66%).
Stop: $180.50 (loss $0.70, -58%).
Bearish 0DTE (April 7):
Trade: Buy $180 Put @ $1.35.
Entry: Breakdown below $180.
Target: $178 (profit $0.65, +48%).
Stop: $181 (loss $0.85, -63%).

SNP500 / SPX🔍 SPX/USDT Analysis: Daily Timeframe 📉
SELL IT!
The SPX chart on a daily timeframe highlights significant upcoming dates where price movements may present trading opportunities. These should be analyzed in conjunction with higher timeframes for a comprehensive market view.
• September 3, 2024 - Red Line: This date marks a potential local peak. Traders might consider this as a moment to take profits or reduce exposure, as the price could encounter resistance or a downturn.
• December 6, 2024 - Red Line: This date is another potential local peak, signaling a possible moment to exit positions before a downturn.
When working with this daily timeframe, remember to evaluate these movements within the context of the broader market trend, considering higher timeframes for a more global perspective.
Note: The exact timing of these phases can vary by +/- a few days. All times are based on UTC-7 (Los Angeles).

S&P - Will we follow 2020/2021?The S&P has been trading in a rising pattern for over 700 days, similar to the rising pattern observed in 2020 and 2021. In that instance, the price of the S&P broke below the support trendline and lost all SMA support, while also making a lower low. This has not occurred since the start of the current pattern. Could a deeper correction follow?
Blue line = 50-day MA
Red line = 100-day MA
Yellow line = 200-day MA
Analysis of the 2020/2021 Price Action
We can conclude the following five points:
1. The rising wedge lasted for nearly 700 days.
2. The price consistently made higher highs and higher lows.
3. The S&P found support on the SMAs and never broke below the 200-day MA.
4. After approximately 700 days, the S&P broke below the rising wedge, lost all key SMA support, and made a lower low.
5. During the retest of the rising wedge and key SMAs (which had turned into resistance), a bearish cross (50-day SMA below the 100-day SMA) occurred, leading to a downtrend.
How Does the 2020/2021 Price Action Correlate to 2023/2024?
We can conclude the following five points:
1. The rising wedge lasted for approximately 750 days.
2. The price continued making higher highs and higher lows.
3. The S&P found support on the SMAs and never broke below the 200-day SMA.
4. After around 750 days, the S&P broke below the rising wedge, lost all key SMA support, and made a lower low.
5. A bearish cross between the 50-day SMA and the 100-day SMA is currently forming.
When we overlay the bar pattern of the 2021 bearish price action onto the current chart, it suggests that a revisit to 4,750 is possible. This level is both a technical support and the point where the S&P started its downtrend in 2021.
Conclusion
Will the S&P follow the 2021 price action, resulting in a sustained downtrend, or will it reclaim all lost SMA levels and continue its uptrend? The price action suggests that there is a real possibility of weakness in the coming months.
