SNP500 / SPX🔍 SPX/USDT Analysis: Daily Timeframe 📉
SELL IT!
The SPX chart on a daily timeframe highlights significant upcoming dates where price movements may present trading opportunities. These should be analyzed in conjunction with higher timeframes for a comprehensive market view.
• September 3, 2024 - Red Line: This date marks a potential local peak. Traders might consider this as a moment to take profits or reduce exposure, as the price could encounter resistance or a downturn.
• December 6, 2024 - Red Line: This date is another potential local peak, signaling a possible moment to exit positions before a downturn.
When working with this daily timeframe, remember to evaluate these movements within the context of the broader market trend, considering higher timeframes for a more global perspective.
Note: The exact timing of these phases can vary by +/- a few days. All times are based on UTC-7 (Los Angeles).
Stocks

S&P - Will we follow 2020/2021?The S&P has been trading in a rising pattern for over 700 days, similar to the rising pattern observed in 2020 and 2021. In that instance, the price of the S&P broke below the support trendline and lost all SMA support, while also making a lower low. This has not occurred since the start of the current pattern. Could a deeper correction follow?
Blue line = 50-day MA
Red line = 100-day MA
Yellow line = 200-day MA
Analysis of the 2020/2021 Price Action
We can conclude the following five points:
1. The rising wedge lasted for nearly 700 days.
2. The price consistently made higher highs and higher lows.
3. The S&P found support on the SMAs and never broke below the 200-day MA.
4. After approximately 700 days, the S&P broke below the rising wedge, lost all key SMA support, and made a lower low.
5. During the retest of the rising wedge and key SMAs (which had turned into resistance), a bearish cross (50-day SMA below the 100-day SMA) occurred, leading to a downtrend.
How Does the 2020/2021 Price Action Correlate to 2023/2024?
We can conclude the following five points:
1. The rising wedge lasted for approximately 750 days.
2. The price continued making higher highs and higher lows.
3. The S&P found support on the SMAs and never broke below the 200-day SMA.
4. After around 750 days, the S&P broke below the rising wedge, lost all key SMA support, and made a lower low.
5. A bearish cross between the 50-day SMA and the 100-day SMA is currently forming.
When we overlay the bar pattern of the 2021 bearish price action onto the current chart, it suggests that a revisit to 4,750 is possible. This level is both a technical support and the point where the S&P started its downtrend in 2021.
Conclusion
Will the S&P follow the 2021 price action, resulting in a sustained downtrend, or will it reclaim all lost SMA levels and continue its uptrend? The price action suggests that there is a real possibility of weakness in the coming months.

Institutional Demand: SP500 longsHey,
Trump’s April 2025 tariffs triggered a global market crash, with the Dow plunging and the Nasdaq entering a bear market. China retaliated, raising recession fears. News warns of rising unemployment, inflation, and a major economic slowdown.
So what does this mean for us as traders and investors?
Volatility equals opportunity.
The S&P 500 is approaching a strong demand zone and trendline. I’m not a fan of trying to catch the exact bottom — just have a consistent plan to scale in, buy once at the zone or do it in chunks. But with prices this low, it’s a great time to consider adding more. Data shows, every major crash has rebounded sooner than expected for the past 100 years.
Great opportunities where fear makes people miss it.
Kind regards,
Max

Cryptocurrency and Stocks will DecoupleI still remember the AI saying that NVDA was going to 320 "in the near future." This was back in June 2024. No matter when you asked the AI, its only prediction would be up, it couldn't make an analysis based on the data coming from the chart. The program wasn't very intelligent, that's what I concluded.
I disagreed. NVDA is going down and this is now fully confirmed.
We are seeing a very long distribution phase and the crash is now taking place.
Ok, but what about Bitcoin?
Bitcoin will decouple from traditional markets, just look at the news.
While Cryptocurrency is due a generational bullish wave, the stock market is due a generational retrace.
I honestly don't know how the stock market will perform but I can look at individual charts. NVDA is bearish and going down strong.
NVDA, TSLA, the SPX, the NDX and Crypto are not the same. These are two completely different monsters.
The SPX and NDX is landline.
Crypto is free wireless internet for all.
The SPX and the NDX is centralization and control.
Bitcoin is decentralization, innovation, technology and freedom.
Times change.
The stock market will recover and it is sure to continue growing long-term.
Will the establishment let it crash or will they jump in and pump it up?
I don't know. But NVDA is bearish and going down. What one does, the rest follows.
But, what about Bitcoin? Bitcoin is going up.
It is very simple. They will decouple, they will not move together anymore. Many, many Altcoins are trading at bottom prices, many stocks are trading high up.
The giant stocks will crash, while the Cryptocurrency market goes up. This is one more of the reasons why we are about to experience the biggest bull-market in the history of Crypto.
People are evolving, the world is changing. We are changing from centralized monopoly money, to a free decentralized technology that is available for all.
Money is not the paper, the shiny stone or the codes; money is what we decide to use for the purpose of exchanging value.
At one time, salt used to be money as well as cows. Sea shells, glass and cacao are also on the list. People used to use these things as money.
The argument that Bitcoin has no value is obviously flawed. If you want to buy a Bitcoin you have to pay a price, that's value, nothing more.
If we decide to use something as money, it becomes money.
Bitcoin is money for the new generation.
The old generation dies out and a new one takes its place.
Life will continue to evolve and money will do the same.
Now it is Bitcoin, later down the road it will be something else. But Bitcoin has value, it is really expensive and it will continue to grow.
After the crash, NVDA will recover for sure.
Namaste.

S&P 500 Daily Chart Analysis For Week of April 4, 2025Technical Analysis and Outlook:
During this week's trading session, the Index experienced lower openings, completing the Outer Index Dip at 5403, as highlighted in the previous week's Daily Chart analysis. This development lays a foundation for a potential decline targeting the Outer Index Dip at 5026, with the possibility of further extension to the subsequent target of the next Outer Index Dip, 4893. An upward momentum may materialize at either completed target level, with the primary objective being the Mean Resistance level of 5185.

levels to watch It's clear that analysts, the media, and others who seek the spotlight often try to explain why the markets moved in a certain direction. The irony, however, is that these explanations usually come after the market has already moved, making it obvious that they’re just linking the moves to some news event.
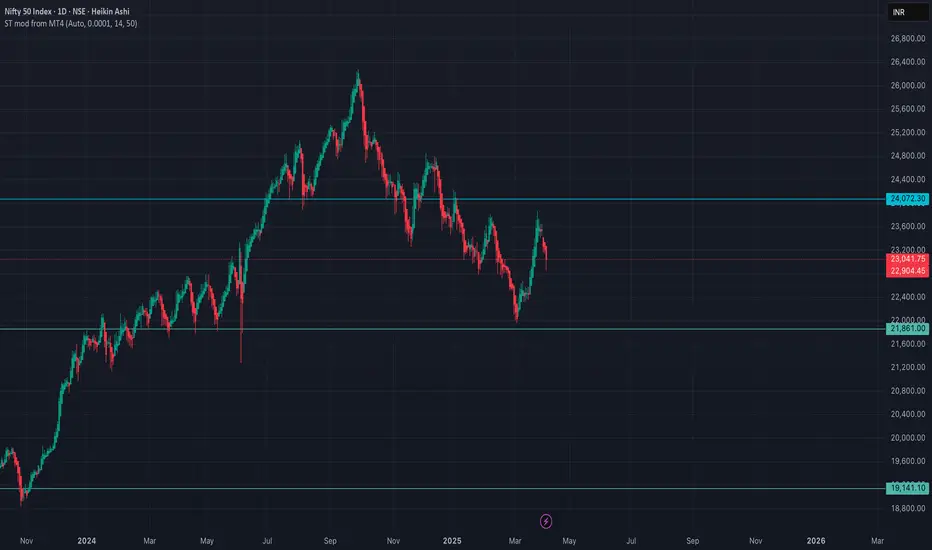
If you pay close attention, you'll realize that technical tools can provide valuable insights ahead of time, helping you predict how the market will behave and where it’s likely headed. For those who’ve read my past articles, you’ll notice I’ve already highlighted key levels for the Nifty index and the potential targets it could reach.
Whether there were tariffs or not, the market was bound to drop. But as I pointed out, the crash is being blamed on the tariffs.
As long as the markets remain below the 24,000 level, we can expect them to target 21,800 and possibly even lower in the coming weeks.
I had booked profits for some of my stocks around the 21,800 level and re-entered short positions at 23,800.
$OBLG #OBLG BUY ALERT FOAT IS LOCKED, $17.6+ then $60+ INCOMING!NASDAQ:OBLG #OBLG NASDAQ:OBLG My name is Landon Wogalter & this is the next NYSE:GME #GME NYSE:GME / NYSE:HKD #HKD NYSE:HKD type move, I am also the reason that NASDAQ:CHSN #CHSN NASDAQ:CHSN went to $44 that I called & locked the float from <1.80 & called for $30+, & even emailed the company in August 24’ stating that their stock would see $30+.
Oblong price targets are as follows:
17.6+ , 60+, 150+, 2900 past 404< #FLOAT IS #LOCKED THERE IS NO OTHER SET UPS LIKE THIS ON THE MARKET AND NEVER HAS BEEN. #ZERO #DEBT OBLG wants #parabolic (This is not promotion nor/or financial advice😘) I’m your daddy forever & ever.

SPOT Eiffel Tower CAUTION!This is a very simple setup of an Eiffel Tower pattern that should be respected. Bulls do not want to be long with this setup.
The Eiffel Tower patterns are rare, hence not much talked about or understood. But they are very powerful when the conditions are right.
CAUTION!!

Tariff FUD is reking ports. SPY 505 First Stop. 460 Second.Trading Fam,
It's no surprise that Trump's implementation of high tariffs would cause initial FUD. This can be observed in the massive spikes on the $VIX. What is unknown and has caught many traders by surprise, myself included, is how substantial of a drop would be incurred by investor uncertainty.
Initially, it did appear that 500 might hold. That was a huge support. I knew if it broke, the sell-off would be deep. But I held hope that the market would hold above this trendline. It did not. So, yesterday and today, investors who held are incurring substantial losses.
For those who were smarter than me and sold at or near the top, congratulations! You've saved yourself some duress and cash. Now, some are calling this the beginning of a longer bear market. I still don't see it that way. Honestly (and I know this will be hard to believe), I still see the SPY hitting my target #3 at 670-700 before 2026 comes to an end. Longer-term we still remain in a massive secular bull market since 2009 and to break this long-term trend, the SPY would actually have to break below 300. That is a long way down and I just don't see that happening, though as always, I definitely could be wrong.
Shorter-term I am seeing two prominent areas of support. The first has almost been reached at 505. If I would have played this correctly, I'd be DCA'ing in my first load of cash here. The second area of support is at around 460 and slightly rising daily. This would be where I DCA'ed in another load of cash. However, if that broke, I'd exit immediately and reassess the charts. 300 is a long way down, but over the past 5 years we have seen some extraordinary market price action and volatility. TBH, even the best of us technicians are struggling to understand the larger macro-economic picture, but I'd wager to say that tariff fears may be overexaggerated as market reactions often tend to be.
One interesting note is that crypto price action no longer seems to correlate and prices have help up surprisingly well. Could this be our first indicator that the markets are due to turn up again in a few weeks/months? Unknown. But I can promise you I'll be watching this all closely.
✌️Stew

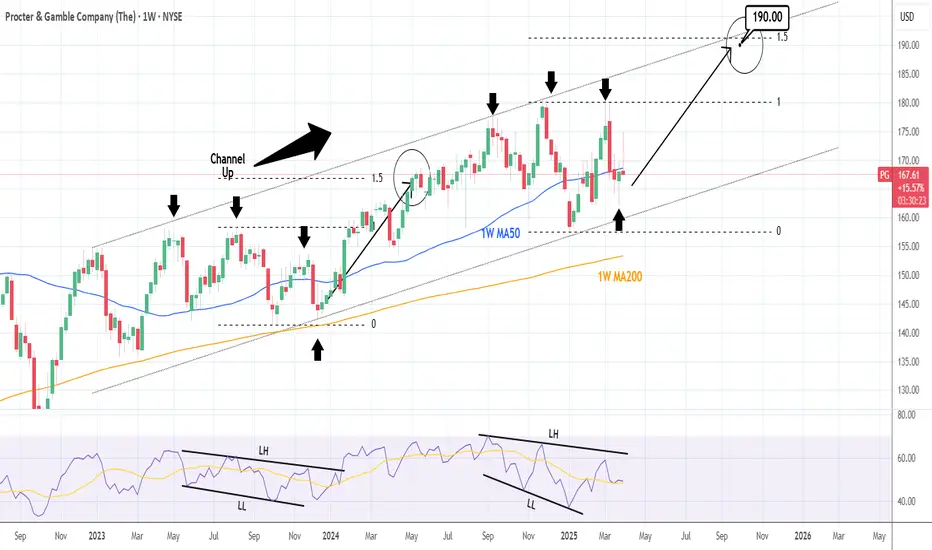
PROCTER & GAMBLE: This volatility implies a major market bottom.Procter & Gamble is neutral on both the 1D (RSI = 47.822, MACD = 0.180, ADX = 17.832) and 1W (RSI = 49.820, MACD = 0.340, ADX = 20.781) technical outlooks as despite last week's rebound and this ones early strong rise, it pulled back and is about to close the 1W candle flat. We are exactly on the 1W MA50, which inside the 2 year Channel Up has always been a fair level to go long. The 1W RSI indicates that last week's low may be the symmetric low to December 11th 2023. This kickstarted a rally that hit the 1.5 Fibonacci extension. Consequently we are bullish long term, aiming at just under the new 1.5 Fib (TP = 190.00).
## If you like our free content follow our profile to get more daily ideas. ##
## Comments and likes are greatly appreciated. ##
$1.42 to $8.14, another day another 400% runner $AREB$1.42 to $8.14 💪🏼 another day another 400% runner 🚀
Early buy message sent in chat with 2 buy alerts following
Max take profit alerted at $8.30 so profits were being locked into vertical as planned before crack 🎯 NASDAQ:AREB

Nintendo Co., Ltd. (NTDOY) – Powering Up for the Next Level Company Snapshot:
Nintendo OTC:NTDOY continues to dominate global entertainment with iconic franchises, cross-platform expansion, and the highly anticipated Switch 2 in 2025.
Key Catalysts:
Switch 2 Launch in 2025 🚀
150M+ Switch units sold → massive installed base
Backward compatibility + hardware upgrades could drive a super-cycle in hardware/software sales.
Franchise Diversification 💡
Digital Pokémon card game gaining momentum → strong in-app revenue potential
The Super Mario Bros. Movie surpassed SEED_TVCODER77_ETHBTCDATA:1B + in global box office 🍿
Expanding theme park partnerships (Universal Studios) enhance recurring brand engagement
Multi-Channel Monetization 📱🎢
Transitioning beyond consoles: movies, mobile, merchandise, and theme parks
Reinforces IP value and opens new revenue verticals
Investment Outlook:
✅ Bullish Above: $15.50–$16.00
🚀 Upside Target: $27.00–$28.00
📈 Growth Drivers: Switch 2 super-cycle, diversified IP monetization, and brand strength
🍄 Nintendo – Not just gaming, but a global entertainment powerhouse. #NTDOY #Switch2 #Nintendo

HOLY MOLY! ARE WE IN A RECESSION? $TSLA $120 BEAR FLAG PATTERNA bear flag trading pattern is a technical analysis formation that features a downward-sloping flagpole, followed by a consolidation phase forming a parallel channel. This pattern suggests a potential sharp decline or continuation of the downward trend
I also notice a head and shoulders pattern, as well as an inverse cup and handle.
Everything points to $120.
Sell/Short NASDAQ:TSLA right now with fact check:
+brand reputation risk, high competition, loss of EV market leadership, cyber truck/ product recalls, declining sales with lower margin, stock volatility concern, insider selling, investors buy it based on expected future earnings rather than its current profitability.
+ potential stagflation, tariff war, slow economic growth, inflation, rising public debt, geopolitical tensions, ai bubble, and more

$SOXL $SOXX BOTTOMED (ASCENDING TRIANGLE)An ascending triangle is a bullish breakout pattern that occurs when the price breaks through the upper horizontal trendline with increasing volume. The upper trendline is horizontal, showing nearly identical highs that create a resistance level. Meanwhile, the lower trendline slopes upward, indicating higher lows as buyers gradually increase their bids. Eventually, buyers become impatient and push the price above the resistance level, triggering further buying and resuming the uptrend. The upper trendline, which previously acted as resistance, then becomes a support level.
Semiconductors NASDAQ:SOXX are crucial to the United States for several reasons:
Technological Backbone: Semiconductors power essential technologies like smartphones, computers, cars, and medical devices. They are integral to almost everything with an on/off switch. The semiconductor industry aka NASDAQ:SOXX significantly contributes to the U.S. economy. It supports millions of jobs and drives innovation in various sectors, including artificial intelligence, biotechnology, and clean energy.
Semiconductors are vital for national security. They are used in military systems, aircraft, weapons, and the electric grid, making them critical for defense and infrastructure. Maintaining a strong semiconductor industry helps the U.S. stay competitive globally so BUY AMEX:SOXL , $SOXX. The CHIPS and Science Act, for example, aims to revitalize the U.S. semiconductor industry, create jobs, and support American innovation. Strengthening the domestic semiconductor supply chain reduces dependency on foreign sources, enhancing the resilience and security of supply chains.
BUY NOW AND HOLD

S&P 500 - Elliott Wave Bearish BreakdownThis S&P 500 E-mini Futures (ES) daily chart highlights a potential bearish Elliott Wave structure following rejection from a key resistance zone.
- The market encountered strong resistance near the 5,600 level, leading to a sharp decline.
- A five-wave impulsive bearish structure appears to be forming, with Waves (1) and (2) already completed.
- If this pattern continues, Waves (3), (4), and (5) could drive prices lower, targeting key support levels in the coming weeks.
Traders should watch for confirmation of Wave (3) acceleration, as it is typically the strongest wave in an impulse. A break below recent lows could confirm further downside, while a strong bounce from lower levels may indicate a correction or trend reversal.
Risk management remains crucial, as volatility can increase during corrective and impulsive waves. Keep an eye on macroeconomic factors and technical confluences for additional confirmation.

Agape ATP's $24 Billion Breakthrough! In a market landscape clouded by macroeconomic uncertainty and weakening sentiment, Agape ATP Corporation (NASDAQ: ATPC) has emerged as a countercyclical outlier with its recent announcement of two landmark Sales and Purchase Agreements (SPAs) worth approximately USD 24 billion. Signed with Swiss One Oil & Gas AG, these agreements mark a bold step forward for ATPC, setting the stage for an ambitious entry into the refined fuels distribution market on a global scale.
The SPAs follow a successful Initial Corporate Purchase Order (ICPO) completed in February 2025, which served as a proving ground for initial trial shipments. Under the terms of the agreements, ATPC will initially supply 200,000 metric tonnes of EN590 10PPM diesel and 2 million barrels of Jet Fuel A1 in March 2025. Following successful execution of this validation phase, the contracts are structured to scale rapidly to weekly deliveries of 500,000 metric tonnes of diesel and 2 million barrels of Jet Fuel A1 — an exponential increase that underscores the strategic ambition of both parties.
All deliveries will be conducted using Free on Board (FOB) procedures at major international ports, with product quality certified by SGS or equivalent agencies in accordance with ASTM/IP standards. This not only enhances transparency and credibility but also signals ATPC's commitment to international compliance and operational rigour.
What makes this deal truly transformative is the sheer scale of the undertaking. If executed to full potential, weekly deliveries of 2 million barrels of jet fuel would translate into an annual supply of roughly 104 million barrels — equivalent to around 2% of total annual U.S. jet fuel consumption. Such volume would position ATPC as a serious contender within the global energy trade ecosystem, shifting its profile from a relatively obscure player to a recognisable force in refined fuel logistics and supply.
The structural staging of the agreement — trial, validation, then full-scale execution — reveals a commercially astute strategy. It reduces upfront risk and capital exposure while providing room for operational ramp-up and systems optimisation. However, the magnitude of the weekly delivery requirements suggests that ATPC must urgently enhance its logistical capabilities, secure dependable supply sources, and establish robust quality assurance and compliance frameworks.
From a financial standpoint, the implications are staggering. The USD 24 billion value of the agreements stands in stark contrast to ATPC's current market capitalisation of just USD 5.17 million — a disconnect representing a multiple of over 4,600 times. While such disparity is not uncommon in early-stage high-growth stories, it highlights the importance of scrutinising the company’s readiness to scale operationally and financially.
Under FOB terms, ATPC will bear the cost of acquiring and transporting the fuel to the port of loading, thereby requiring significant working capital. Timely financing and cash flow management will be paramount, especially as delivery volume scales. Questions surrounding margin structure, procurement reliability, and commodity price hedging strategies will need to be addressed to fully appreciate the risk-return profile of this venture.
Yet, amid broader market softness and investor caution, ATPC’s bold strategic execution stands out. If the company successfully navigates the complex logistics, financial demands, and operational scale-up, this agreement has the potential to redefine its financial trajectory and long-term shareholder value.
In an era where execution is everything, Agape ATP’s audacious move could very well prove prescient. Investors will be watching closely — not just for signs of progress, but for proof of delivery.
Article inspired by Stock Titan.

Apple (AAPL) Shares Plummet Over 9% Following Trump's TariffApple (AAPL) Shares Plummet Over 9% Following Trump's Tariff Announcement
Many stock indices declined after the US President announced the introduction of tariffs for multiple countries, as we reported yesterday morning. During yesterday’s trading session, the sell-off in equities intensified.
According to media reports, market participants had hoped that the tariff threats were mere rhetoric and a negotiation tactic. However, many were shocked by both the number of countries affected and the scale of the imposed tariffs. Several well-known technology companies led the market downturn.
How Do Trump's Tariffs Impact Big Tech Companies?
Significant tariffs were imposed on Chinese imports, yet Apple manufactures around 90% of its iPhones in China. Many affordable products sold on Amazon are also set to become more expensive, as they are sourced from China.
Meta Platforms' advertising business could suffer considerable losses as companies worldwide cut advertising budgets. Nvidia and Broadcom may also struggle, given that the tariffs apply to many electronic devices incorporating their chips.
As a result, shares of Apple (AAPL), Amazon (AMZN), Meta Platforms (META), Broadcom (AVGO), and Nvidia (NVDA) fell by approximately 9% by the close of trading yesterday.
Microsoft (MSFT) shares, however, proved more resilient, dropping just 2.3%, as software products are not easily subject to tariffs. Moreover, software developers do not rely on international supply chains.
Technical Analysis of AAPL Chart
Apple’s stock price fluctuations have formed a trend channel (shown in blue), with:
→ The upper boundary acting as resistance since last autumn, although bulls managed to push the price above it during the Christmas rally. We previously highlighted Apple’s overbought condition and the possibility of a correction on 27 December 2024.
→ New data indicates that resistance has now shifted to the median at around $225.
This puts the lower boundary of the trend channel at risk of a bearish breakout. In the coming days, AAPL’s chart may see a bearish assault on the psychological $200 level, which proved significant in August 2024.
This article represents the opinion of the Companies operating under the FXOpen brand only. It is not to be construed as an offer, solicitation, or recommendation with respect to products and services provided by the Companies operating under the FXOpen brand, nor is it to be considered financial advice.

IAG Additional Price Levels • LSE • Airlines Group Stock • FTSE⚠️ IAG Going to plan, looks like it's a TRUMP DUMP 🤣
Now is the TIME TO HUNT the stocks for your PORTFOLIO.
ℹ️ When TRUMP causes a DUMP I accumulate SIT BACK and just WAIT fornthe PUMP...🚀
These additional price levels will be used as an additional filter to TIME an ENTRY ONLY IF the BIDS come in 🟢SeekingPips🟢 NEEDS to see some VOLUME🚀🚀🚀

Nightly $SPY / $SPX Scenarios for April 4, 2025🔮 🔮
🌍 Market-Moving News 🌍:
🇺🇸📊 March Employment Report Release: The Bureau of Labor Statistics will release the March employment report, with forecasts predicting an addition of 140,000 nonfarm payrolls and an unemployment rate holding steady at 4.1%. This data will provide insights into the labor market's health and potential implications for Federal Reserve policy.
🇺🇸💬 Federal Reserve Chairman Powell's Address: Federal Reserve Chairman Jerome Powell is scheduled to speak at 11:25 AM ET. Investors will be closely monitoring his remarks for any indications regarding future monetary policy, especially in light of recent market volatility.
🇺🇸📈 Market Reaction to 'Liberation Day' Tariffs: Following President Donald Trump's announcement of new tariffs, dubbed "Liberation Day" tariffs, the markets experienced significant declines. The S&P 500 dropped 4.8%, and the Nasdaq Composite fell 6%, marking the worst trading day since 2020. Investors are bracing for continued volatility as the market digests the potential economic impacts of these tariffs.
📊 Key Data Releases 📊
📅 Friday, April 4:
👷♂️ Nonfarm Payrolls (8:30 AM ET):
Forecast: +140,000
Previous: +151,000
Indicates the number of jobs added or lost in the economy, excluding the farming sector.
📈 Unemployment Rate (8:30 AM ET):
Forecast: 4.1%
Previous: 4.1%
Represents the percentage of the total workforce that is unemployed and actively seeking employment.
💵 Average Hourly Earnings (8:30 AM ET):
Forecast: +0.3%
Previous: +0.3%
Measures the month-over-month change in wages, providing insight into consumer income trends.
⚠️ Disclaimer: This information is for educational and informational purposes only and should not be construed as financial advice. Always consult a licensed financial advisor before making investment decisions.
📌 #trading #stockmarket #economy #news #trendtao #charting #technicalanalysis

BULLISH RSI DIVERGENCE ON REZOLVE AI (RZLV) 1D CHARTA bullish RSI divergence appeared to gather more strength on the 1 hour chart today. This could possibly signal a bullish up trend. The London based company provides AI solutions for commerce. Rezolve recently closed an acquisition of GroupBy, an ECommerce company, and has recently been featured favorably in articles by Nasdaq and others.

Apple - All This Was Expected!Apple ( NASDAQ:AAPL ) perfectly plays out:
Click chart above to see the detailed analysis👆🏻
Just a couple of months ago, Apple perfectly retested the rising channel resistance trendline and has been creating the expected bearish rejection. This could perfectly form the next all time high break and retest, which would eventually lead to another significant move higher.
Levels to watch: $190
Keep your long term vision,
Philip (BasicTrading)

COSTCO: Massive rebound on the 1W MA50 can go for +45% profit.Costco has just turned bullish on its 1D technical outlook (RSI = 56.966, MACD = -6.590, ADX = 35.211) as it's on the 3rd straight green week ever since it touched and held the 1W MA50. This rebound, though not an absolute bottom on the 2 year Channel Up, is the new technical bullish wave of the pattern. We've had so far 2 main +45.14% price surges in the past two years. We estimate that to be the 3rd and last up until the end of the year. Go long, TP = 1,270.
See how our prior idea has worked out:
## If you like our free content follow our profile to get more daily ideas. ##
## Comments and likes are greatly appreciated. ##

UPS looking DOWNSNice head and Shoulders on the United Parcel Service
#UPS and FEDEX are the new dow transport indicator.
An underlying determinant of how the consumer is faring
Since the US is a consumer economy and Online shopping is the majority of retail
if we see new highs on the Indicies, and the home delivery carriers continue to deteriorate
it would give your non confirmation Top
Similar to Dow theory of new High's in the Industrials , but the transports lagging and indeed falling.
