$NDX 3rd Bearish EngulfingSlowly but surely we are seeing deteriorating conditions in every major indices.
NASDAQ:NDX closed and formed the 3rd BEARISH engulfing in 2 weeks, RARE!
Light volume so it's not definitive, but alarming.
TVC:DJI keeps weakening.
SP:SPX many RED candles & bearish engulfing as well.
Light volume though.
Stocks

META : Old Peak can be TestedMeta platform has lost altitude from the channel it has formed since 2023, but has gained momentum and re-entered the channel. The possibility of testing the old peak contains a good RR rate.Of course, with a stop-loss close to the 200-period moving average.( Risk/Reward Ratio : 2.48)
Stop-Loss: 605.47
Target : 740.10

VRT : Long Position Vertiv Holdings is trading above the 50 and 200-period moving averages.
It has overcome the resistances one by one without being exposed to a very high IV.
It has started to draw a cup.
However, it is much better to focus on the big gap rather than the cup formation because with good chances it can encounter a big resistance there.
Targeting the 50-period ema and the 0.5 level of the short-term Fibonacci retracement levels as a stop point gives us the opportunity to try trading at a not bad risk/reward ratio.
With a small position size or small portfolio percent :
Risk/Reward Ratio : 2.54
Stop-Loss : 103.77
Take-Profit : 145.32

UNH : Are Bad Days Over ? (Cautious)UNH shares have moved above the 50-period moving average but are trading below the 200-period moving average.
For now, since the 200-period moving average is very high, a small trade can be tried by keeping the stop-loss level a little tight.
A few weak movements may pull the average down and the price may break the average.
Therefore, small position sizes are ideal.
NOTE : If we can maintain persistence on 376(Which will take a few days),
then we will look at the other gaps.
Risk/Reward Ratio : 2.39
Stop-Loss : 274.99
Take- Profit Level : 376.38
Regards.

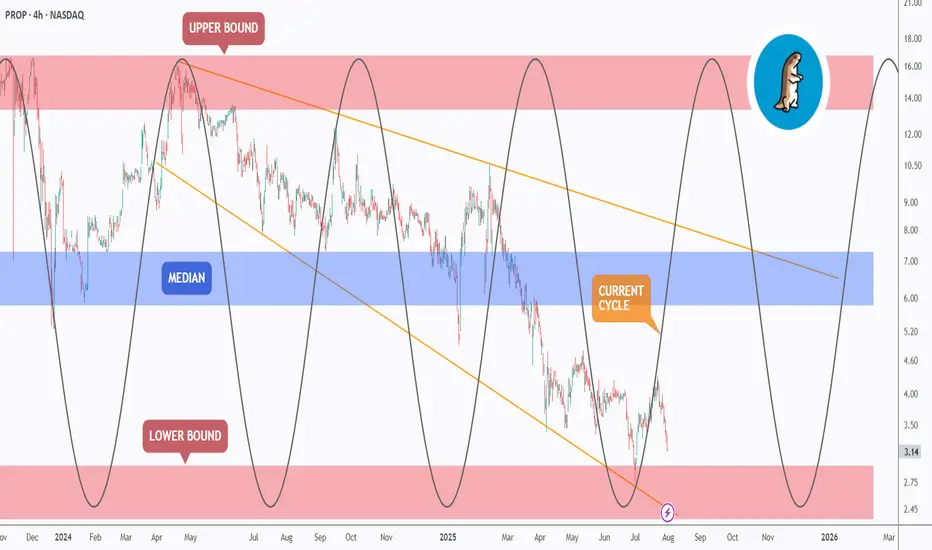
PROP - Riding the Cycle? The Next Wave May Just Be Starting!Markets move in cycles; and PROP is no exception.
If you’ve been following our previous analyses, you’ll recognize the accumulation zone we highlighted earlier. Well, this updated chart adds another layer: the cyclical rhythm of price action.
🔁As shown, PROP has been moving in clearly defined waves, bouncing between key zones with consistency. The current cycle appears to have bottomed — once again — inside the lower bound, where strong demand continues to hold.
We’re now in the early phase of what could be a fresh bullish cycle. If the rhythm plays out as before, the path of least resistance could take us toward the median zone ($6.5 - $7.5) and possibly all the way back to the upper bound ($15 - $17) by late 2025 or early 2026.
🔍 Supporting Fundamentals
While the chart speaks volumes, the fundamentals back it up:
Energy demand is surging globally, fueled by AI, data centers, and electric infrastructure — all of which require massive power capacity.
Oil and gas remain essential in this transition phase, especially with renewable infrastructure still years away from matching base-load demand.
PROP (Prairie Operating Co.) controls 65,000 acres in the DJ Basin — one of the most productive oil regions in the U.S. With advanced drilling tech and low-cost operations, PROP is well-positioned to ride out volatility and capitalize on rising demand.
🎯 Key Zones to Watch
- Support: $2.5–$3
- Median target: $6.5–$7.5
- Macro resistance: $15–$17
📌 We’re not just seeing structure — we’re seeing rhythm, confluence, and timing align.
If this cycle continues to play out, PROP might just be preparing for its next major wave.
Are you ready to catch it?
🧠 Previous posts and technical breakdowns are attached for full context.
➡️ As always, speak with your financial advisor and do your own research before making any investment decisions.
📚 Always follow your trading plan => including entry, risk management, and trade execution.
Good luck!
All strategies are good, if managed properly.
~ Richard Nasr
Amazon (AMZN) Shares Rise Ahead of Earnings ReportAmazon (AMZN) Shares Rise Ahead of Earnings Report
Today, 31 July, Amazon is set to release its quarterly earnings after the close of the regular trading session. Available data show that Amazon (AMZN) shares are exhibiting bullish momentum, reflecting positive market expectations:
→ In July, AMZN shares have outperformed the S&P 500 index (US SPX 500 mini on FXOpen);
→ Yesterday, following the end of the regular session, AMZN shares surged by approximately 3% in after-hours trading.
The rise in AMZN comes amid strong earnings reports from other tech giants, such as Microsoft (MSFT) and Meta Platforms (META). For example, MSFT shares rose by more than 8% in post-market trading. Their success has likely fuelled optimism that Amazon’s upcoming report will also impress.
All of this has brought noticeable changes to the technical outlook for the AMZN stock price.
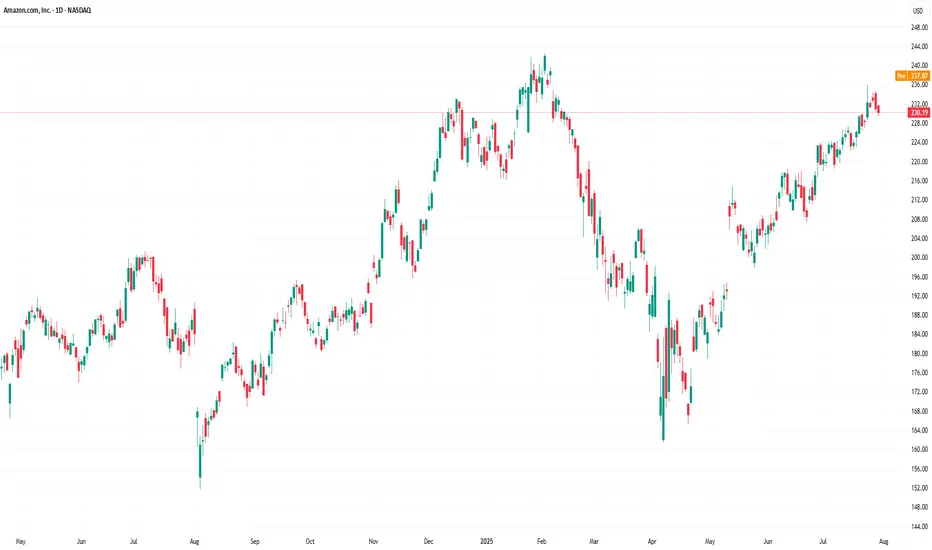
Technical Analysis of the Amazon (AMZN) Chart
Following the release of the previous earnings report, price movements have formed an upward channel, as indicated by the Regression Trend tool. However, in recent days, a series of bearish signals emerged:
→ On Thursday, AMZN broke above the $230 level (marked by an upward arrow), but the session closed well below the highs – a sign of selling pressure;
→ Friday and Monday’s sessions produced candles with small bodies, indicating market indecision;
→ On Tuesday, bears took the lead (marked by a downward arrow), with a relatively long candle closing near the session low.
Thus, the chart gave reason to assume that optimistic sentiments were waning. However, today’s session is likely to open near the $237.30 level, effectively negating the bearish interpretation of the previous five candles and shifting momentum back in favour of the bulls.
In this context:
→ Support could be provided by the $230 level as well as the median of the Regression Trend channel;
→ Key resistance could be found at the previous high of $242.23 and the psychological level of $250.
Whether AMZN can surge to a new all-time high will largely depend on the company’s performance in AI – a theme that remains highly relevant in 2025.
This article represents the opinion of the Companies operating under the FXOpen brand only. It is not to be construed as an offer, solicitation, or recommendation with respect to products and services provided by the Companies operating under the FXOpen brand, nor is it to be considered financial advice.
Nifty 24780 Pullback possible on next 1-2 days On 31 July, if someone watch closely price action he could capture Today up move coz Nifty gave almost same price action as 13 June let's try to find what is the Same thing: -
(A)31 July 2025: gap down is (-70%)
volume around 97 million
Bounce Back after gap down around +1%
(B) 13 June: gap down was (-80%)
Volume around 93 million
Bounce back after gap down around +1
On 13 June Nifty faced resistance of 24980 level then retraced. Due to such similarities, we can conclude that it could be pullback around 24780 level although I don't say market will behave same as before, I know every second of market is very dynamic and different from past days, but technical analysis always based on historical data. so, this is just assumption. take the trade on your own analysis & research.

GME 1W: when the memes fade, the structure speaksGameStop is once again testing the lower boundary of its long-term consolidation, bouncing off the 21.53 zone - a level that aligns with the 0.79 Fib retracement and historical support. This zone also intersects with a key trendline on the weekly chart, and just recently, a golden cross (MA50 crossing MA200 weekly) printed - a rare but technically significant signal. The stock continues to trade inside a broad descending channel, and if this support holds, the natural next step is a move back toward the mid-range at 37.42 (0.5 Fib), followed by a possible push toward 64.92. The tactical setup favors a confirmation entry near current levels, with a stop under 21.00. Risk/reward here is among the cleanest GME has offered in months.
On the fundamental side, GameStop remains in a transitional phase. The company is shutting down unprofitable segments, reducing costs, and doubling down on e-commerce and digital distribution. Financial results are still slow to recover, but the latest Q2 2025 report showed positive operating cash flow and narrowing losses. This isn't a value play in the traditional sense - it's more about the potential for renewed retail-driven momentum if technical conditions align.
If there’s still power behind the crowd - this might be one of the most technically compelling entry zones of 2025.

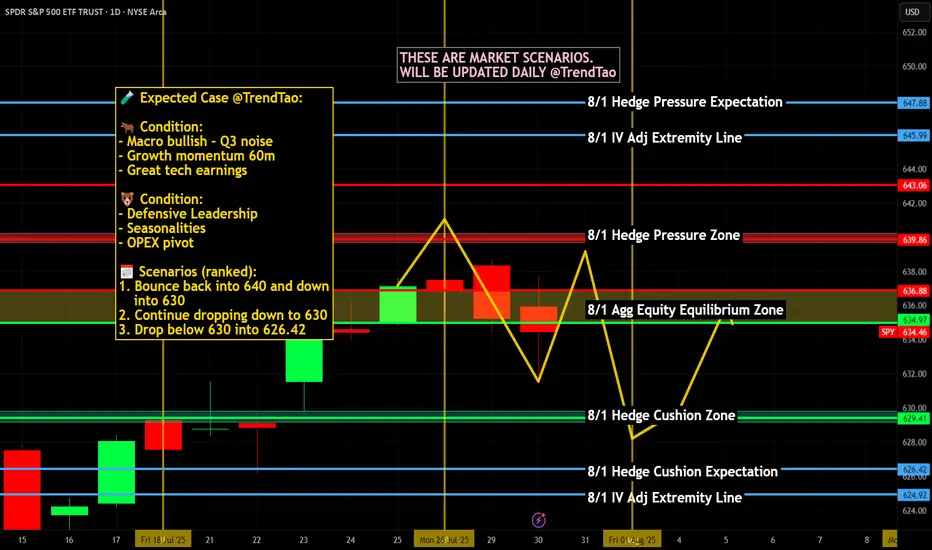
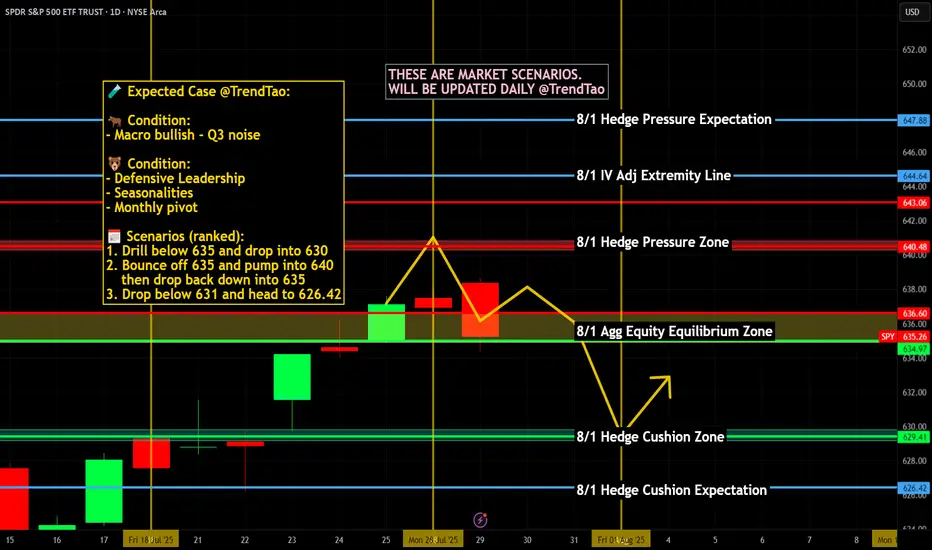
Nightly $SPY / $SPX Scenarios for July 31, 2025🔮 Nightly AMEX:SPY / SP:SPX Scenarios for July 31, 2025 🔮
🌍 Market-Moving News 🌍
🏦 Fed Holds Rates — Dissent Indicates Division
The Federal Reserve maintained its benchmark rate at 4.25%–4.50%. Notably, two governors—Christopher Waller and Michelle Bowman—dissented in favor of a 25 bp rate cut, underscoring internal divisions amid growing political pressure
📈 Strong Q2 Growth, But No Rate-Cut Signal
U.S. GDP expanded at a 3.0% annualized rate in Q2, rebounding sharply from Q1's contraction. Despite this, Powell emphasized persistent inflation, particularly from tariffs, reinforcing the Fed’s cautious policy stance
🛢️ Oil Climbs as Tariff Tensions Rise
Brent crude rose to ~$73.51 and WTI to ~$70.37 on fears of supply disruptions tied to President Trump’s threats of new tariffs on Russian oil and new tariffs imposed on Brazil and South Korea
📊 Key Data Releases & Events 📊
📅 Thursday, July 31:
8:30 AM ET – Initial Jobless Claims (week ending July 26)
Initial claims rose to 222,000, up from 217,000 previously—an early gauge of labor-market trends
8:30 AM ET – Employment Cost Index (Q2)
Quarterly growth in labor costs edged lower to 0.8%, down from 0.9%—a signal of moderate wage pressures
8:30 AM ET – Personal Income (June)
Data released on household income and spending patterns—crucial for assessing consumer resilience heading into Q3
⚠️ Disclaimer:
This information is for educational and informational purposes only and should not be construed as financial advice. Always consult a licensed financial advisor before making investment decisions.
📌 #trading #stockmarket #economy #Fed #inflation #jobs #technicalanalysis
CVX & XOM: The Bull case for OilI review the the Daily and Weekly charts on CVX & XOM, showing tradable patterns that they have formed since 2022. These are longer term trading patterns but are still active and fun to watch.

NIKE Confirms A Bullish Reversal With An Impulsive RecoveryWe talked about Nike on July 10 with our members, where we mentioned and highlighted a completed higher degree ABC correction in wave IV on the monthly and weekly charts.
Today we want to represent a closer view, as we see a five-wave impulsive recovery away from the lows on a daily chart. It actually confirms the bottom and bullish reversal, but since it can be trading in 5th wave that can stop around 80-85 area, we should be aware of a three-wave corrective setback soon. It can slow down the price back to the open GAP, so ideal buy zone is in the 70-60 area. Invalidation level is at 52.
Highlights:
Direction: Up, but watch out for a correction
Structure: Impulse, Wave 5 in final stages
Support: 70 / 60

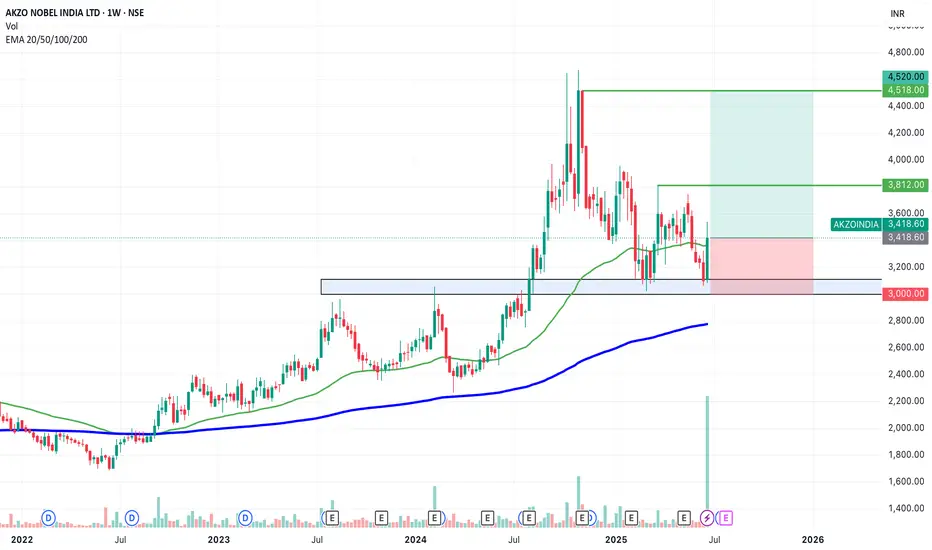
SWING IDEA - AKZO NOBEL INDIA Akzo Nobel India , a subsidiary of the global paints and coatings giant AkzoNobel N.V., is a leading player in India’s decorative and industrial paints market. Known for its premium brand Dulux , the company has strong brand recall, a wide distribution network, and consistent profitability.A strong brand, steady margins, and a bullish chart make this a candidate to watch for a short- to medium-term swing trade.
Reasons are listed below :
Bullish engulfing candle spotted on the weekly timeframe, signaling a potential trend reversal.
Accompanied by the highest-ever volume spike, adding strong conviction to the move.
Price is bouncing off the golden Fibonacci support (0.618), a classic retracement zone where strong reversals often occur.
The level of 3100 acted as a solid support.
The stock is trading above its 50 & 200 EMA on the weekly chart — a sign of long-term strength.
Target - 3812 // 4520
Stoploss - weekly close below 3000
DISCLAIMER -
Decisions to buy, sell, hold or trade in securities, commodities and other investments involve risk and are best made based on the advice of qualified financial professionals. Any trading in securities or other investments involves a risk of substantial losses. The practice of "Day Trading" involves particularly high risks and can cause you to lose substantial sums of money. Before undertaking any trading program, you should consult a qualified financial professional. Please consider carefully whether such trading is suitable for you in light of your financial condition and ability to bear financial risks. Under no circumstances shall we be liable for any loss or damage you or anyone else incurs as a result of any trading or investment activity that you or anyone else engages in based on any information or material you receive through TradingView or our services.
@visionary.growth.insights
UnitedHealth (UNH) Shares Plunge Following Earnings ReportUnitedHealth (UNH) Shares Plunge Following Earnings Report
Yesterday, prior to the opening of the main trading session, UnitedHealth released its quarterly results along with forward guidance. As a result, UNH shares dropped by over 7%, signalling deep disappointment among market participants. According to media reports:
→ Earnings per share came in at $4.08, missing analysts’ expectations of $4.48.
→ Revenue guidance was set at $445.5–448 billion, falling short of the anticipated $449.07 billion.
→ Concerns were further fuelled by rising costs and declining profitability, which the company attributed to the continued impact of Medicare funding cuts.
Consequently, the UNH share price dropped to its lowest level of 2025, last seen on 15 May.
Technical Analysis of UNH Stock Chart
In our end-of-May analysis, we updated the descending channel on the UNH stock chart and highlighted that following the recovery from the May low (marked by arrow 1), sellers could regain control. Since then:
→ Throughout June, the share price exhibited signs of supply-demand equilibrium around the psychological $300 level.
→ However, after an unsuccessful rally that formed peak A (which now resembles a bull trap), the balance shifted in favour of the bears. The price began to slide lower along the median line of the descending channel (illustrated by arrow 2).
This pattern was a red flag, particularly against the backdrop of a broadly rising equity market since the beginning of summer. Even if the bulls had hope, yesterday's candle could have completely extinguished it:
→ The session opened with a wide bearish gap.
→ During the day, bulls attempted a recovery, but failed — the candlestick closed at the daily low, leaving a long upper wick, a classic sign of selling pressure.
In this context, we could assume that:
→ Bears may seek to extend their advantage and test the year’s low;
→ The bearish gap area (highlighted in purple), reinforced by the descending channel’s median line, could act as resistance during any potential recovery.
At the same time, the $250 psychological level appears to be a strong support zone. This is backed by the 15 May bullish pin bar formed on record trading volumes — a potential sign of institutional interest in accumulating shares of this healthcare giant in anticipation of a long-term recovery.
This article represents the opinion of the Companies operating under the FXOpen brand only. It is not to be construed as an offer, solicitation, or recommendation with respect to products and services provided by the Companies operating under the FXOpen brand, nor is it to be considered financial advice.

EURUSD – Will the bullish parallel channel hold?The EUR/USD currency pair is currently trading within a clearly defined bullish parallel channel, as shown on the 4-hour chart. This channel has provided consistent directional structure over recent weeks, with price respecting both its upper resistance and lower support boundaries. At present, the pair is approaching the lower end of this channel, raising the critical question: will it bounce off support and continue the bullish trajectory, or will it decisively break down, opening the door to lower price targets?
Bullish parallel channel
On the 4-hour timeframe, the EUR/USD has been consistently moving within a bullish parallel channel, characterized by higher highs and higher lows. This price structure suggests sustained upward momentum, with the top of the channel acting as dynamic resistance and the bottom as reliable support. Today, price action is testing the lower boundary of the channel once again. A successful hold at this level could confirm continued bullish structure and open the door for a potential rebound.
Bullish scenario
In the bullish scenario, the EUR/USD holds its ground at the support region around 1.164, where the lower boundary of the channel intersects with price. For upward continuation, it must overcome the short-term resistance posed by the 4-hour Fair Value Gap (FVG) between 1.169 and 1.174. A reclaim and close above this zone could signal a shift in short-term momentum and lead to a move back toward the upper boundary of the channel. However, the path upward is not without resistance , price must navigate through potential supply zones and maintain higher lows to preserve the bullish structure.
Bearish scenario
On the other hand, a break and close below the channel support could indicate a change in market sentiment and invalidate the bullish pattern. In this bearish case, we would expect a structure break confirmation followed by a possible retest of the broken trendline and the 4-hour FVG. If this retest fails to reclaim the trendline, bearish continuation becomes more likely. The next significant area of interest lies around the 1.150 level, where a bullish 4-hour FVG exists. This zone could act as a potential short-term support and serve as a target for the downside move before any meaningful bounce occurs.
Final thoughts
The EUR/USD pair is currently at a technical crossroads. Traders should watch closely for price behavior around the lower channel boundary to determine whether bullish momentum will resume or whether a bearish breakout will set the tone for deeper retracement. Confirmation, either through a bounce or a breakdown with a retest, will be key in validating the next directional move.
-------------------------
Disclosure: I am part of Trade Nation's Influencer program and receive a monthly fee for using their TradingView charts in my analysis.
Thanks for your support. If you enjoyed this analysis, make sure to follow me so you don't miss the next one. And if you found it helpful, feel free to drop a like 👍 and leave a comment 💬, I’d love to hear your thoughts!

MPWR 1D: shoulders are squared and the battery's still fullMonolithic Power Systems broke out of a long-term descending trendline after completing a clean inverse head and shoulders. Now the price is pulling back into the 705–688 zone — a textbook retest area that combines the neckline, the 0.705–0.79 Fib levels, and a major volume shelf. Add to that a golden cross (EMA50 crossing EMA200 from below) and we have a solid technical foundation for continuation. Volume on the pullback is low, indicating no panic, just rotation. If 688 holds, the next levels to watch are 755.66 and 952.17 — the latter being the 1.618 Fib extension. Tactical setup: look for a reversal signal between 705–688, with a stop just below 661. As long as price holds this zone, the bullish structure remains intact.
Fundamentally, MPWR remains one of the strongest names in the semiconductor space. With over $1.5B in annual revenue and industry-leading margins, the company continues to see strong demand from data center and EV sectors. In its latest report, management highlighted accelerating orders from Tier‑1 manufacturers. The balance sheet is clean, with zero debt, and ongoing buybacks provide downside support. In a sector full of volatility, MPWR stands out with both structural reliability and technical clarity - making it a strong candidate for long-term positioning.
If this textbook pattern plays out, the train’s just leaving the station. The best seat is usually the one taken before the doors close.

OSCR: back to support and now it’s decision timeAfter the recent impulse move, OSCR has pulled back to a key support zone around 13.65. That area aligns with the 0.79 Fib retracement, a horizontal level from spring, and a rising trendline that has already triggered reversals in the past. The structure is still intact, and buyers are testing the level again. If support holds and we get a bullish confirmation, the next target is 17.01, followed by a potential breakout toward the high at 22.81.
Volume remains elevated, the overall structure is healthy, and the correction is controlled. A break below 13.00 would invalidate the setup - until then, it’s a clean, high-reward zone with tight risk.
Fundamentally, Oscar Health has revised its 2025 guidance: revenue is expected in the $12–12.2B range, with operating losses projected between $200M and $300M. Despite softening topline growth, earnings per share are improving, and investor sentiment has been shifting. Technical strength is also reflected in the recent rise in RS Rating to 93, confirming that the stock is showing relative leadership even as the market cools.
This is one of those setups where both technicals and narrative are aligning - now we just need confirmation from the chart.

Nightly $SPY / $SPX Scenarios for July 30, 2025🔮 Nightly AMEX:SPY / SP:SPX Scenarios for July 30, 2025 🔮
🌍 Market‑Moving News 🌍
🧭 Fed Holds Steady Amid Uncertainty
As the FOMC enters its July 29–30 meeting, the Fed is expected to keep rates unchanged at 4.25%–4.50%, even as one or two governors may dissent in favor of rate cuts amid mixed economic data. Recent strength in consumer spending contrasts with weakness in housing and construction.
🌐 U.S.–China Trade Talks Resumed in Stockholm
Talks are under way aimed at extending the tariff truce before the August 12 deadline. Both sides described progress as constructive, though analysts remain cautious on the timeline and potential outcomes.
🛢️ Oil Up / Dollar Firmer, But Risks Remain
Brent crude hit ~$72.50/barrel (+3.5%) while WTI rose to ~$69.20 on a mix of geopolitical tension (possible new Russia tariffs) and trade optimism. The U.S. dollar edged higher following the U.S.–EU trade agreement.
📈 IMF Revises Up Global Growth—but Flags Tariff Risks
The IMF raised its 2025 growth forecast to 3.0% and maintained 3.1% for 2026, citing pre-emptive consumer demand—but warned that ongoing U.S. tariffs and policy inconsistency could dampen momentum.
📊 Key Data Releases & Events 📊
📅 Wednesday, July 30:
FOMC Rate Decision & Powell Press Conference
The Fed is expected to hold interest rates steady. Powell’s remarks will be closely watched for signals on the timing of future cuts and views on inflation and labor markets.
Advance Q2 U.S. GDP Estimate
The first look at Q2 growth is expected around +1.9% YoY, potentially validating a rebound after Q1’s contraction.
June PCE & Core PCE (Personal Consumption Expenditures Index)
The Fed's preferred inflation gauge. Markets will monitor if core inflation remains elevated, which may reinforce policy caution.
⚠️ Disclaimer:
This summary is for educational and informational purposes only—it is not financial advice. Always consult a licensed financial advisor before making investment decisions.
📌 #trading #stockmarket #economy #Fed #GDP #inflation #trade #tariffs #markets
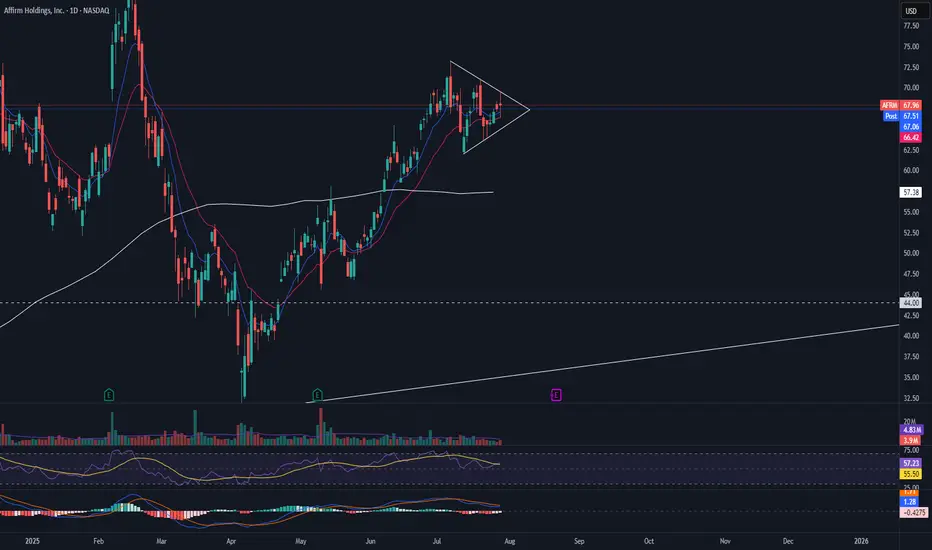
AFRM pre earnings triangleAFRM is currently in a symmetrical triangle with RSI and MACD beginning to show the pattern may come to an end. I would want to see this triangle break with volume before entering a long position.
DUOL Bear Flag Break
DUOL has broken the bear flag down and continuing its move towards the 786 FIB level. I would want to see a bounce off this level and then a following close above the 9 EMA on the daily chart.

Hindustan Unilever looks strong. Hindustan Unilever Ltd. engages in the manufacture of consumer goods. It operates through the following segments: Home Care, Beauty and Personal Care, Foods and Refreshments, and Others. It is one of leading company in FMCG sector.
Hindustan Unilever Closing price is 2453.60. Dividend Yield @CMP = 1.78%. The positive aspects of the company are Stocks Outperforming their Industry Price Change in the Quarter, Companies with Zero Promoter Pledge, Company able to generate Net Cash - Improving Net Cash Flow for last 2 years, FII / FPI or Institutions increasing their shareholding and MFs increased their shareholding last quarter. The Negative aspects of the company are high Valuation (P.E. = 53.9), Increasing Trend in Non-Core Income, Declining Revenue every quarter for the past 2 quarters and PEG greater than Industry PEG.
Entry can be taken after closing above 2460 Historical Resistance in the stock will be 2498 and 2534. PEAK Historic Resistance in the stock will be 2571 and 2601. Stop loss in the stock should be maintained at Closing below 2391 or 2369 depending upon your risk taking ability.
Disclaimer: The above information is provided for educational purpose, analysis and paper trading only. Please don't treat this as a buy or sell recommendation for the stock or index. The Techno-Funda analysis is based on data that is more than 3 months old. Supports and Resistances are determined by historic past peaks and Valley in the chart. Many other indicators and patterns like EMA, RSI, MACD, Volumes, Fibonacci, parallel channel etc. use historic data which is 3 months or older cyclical points. There is no guarantee they will work in future as markets are highly volatile and swings in prices are also due to macro and micro factors based on actions taken by the company as well as region and global events. Equity investment is subject to risks. I or my clients or family members might have positions in the stocks that we mention in our educational posts. We will not be responsible for any Profit or loss that may occur due to any financial decision taken based on any data provided in this message. Do consult your investment advisor before taking any financial decisions. Stop losses should be an important part of any investment in equity.

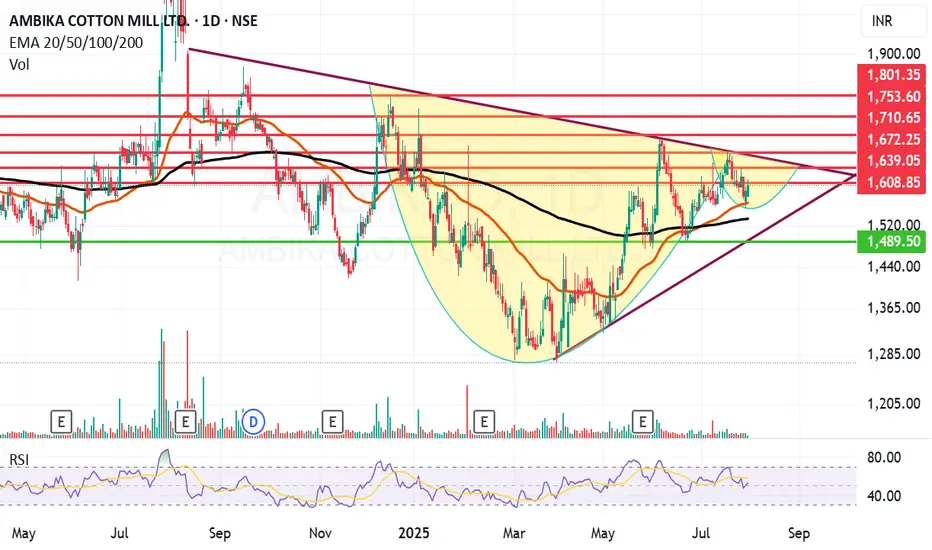
Ambika Cotton looking ambitious on the charts and fundamentally.Ambika Cotton Mills Ltd. engages in the provision of manufacturing and selling of cotton yarn catering to the needs of manufacturers of premium branded shirts and t-shirts.
Ambika Cotton Mills Ltd. Closing price is 1603.20 Dividend Yield @CMP = 2.35%. The positive aspects of the company are attractive Valuation (P.E. = 13.9), Stocks Outperforming their Industry Price Change in the Quarter, Companies with Zero Promoter Pledge, Companies with Low Debt, Rising Net Cash Flow and Cash from Operating activity and FII / FPI or Institutions increasing their shareholding. The Negative aspects of the company are Increasing Trend in Non-Core Income, Fall in Quarterly Revenue and Net Profit (YoY) and Companies with growing costs YoY for long term projects.
Entry can be taken after closing above 1609 Historical Resistance in the stock will be 1631, 1672 and 1710. PEAK Historic Resistance in the stock will be 1753 and 1801. Stop loss in the stock should be maintained at Closing below 1533 or 1489 depending upon your risk taking ability.
Disclaimer: The above information is provided for educational purpose, analysis and paper trading only. Please don't treat this as a buy or sell recommendation for the stock or index. The Techno-Funda analysis is based on data that is more than 3 months old. Supports and Resistances are determined by historic past peaks and Valley in the chart. Many other indicators and patterns like EMA, RSI, MACD, Volumes, Fibonacci, parallel channel etc. use historic data which is 3 months or older cyclical points. There is no guarantee they will work in future as markets are highly volatile and swings in prices are also due to macro and micro factors based on actions taken by the company as well as region and global events. Equity investment is subject to risks. I or my clients or family members might have positions in the stocks that we mention in our educational posts. We will not be responsible for any Profit or loss that may occur due to any financial decision taken based on any data provided in this message. Do consult your investment advisor before taking any financial decisions. Stop losses should be an important part of any investment in equity.
Nightly $SPY / $SPX Scenarios for July 29, 2025🔮 Nightly AMEX:SPY / SP:SPX Scenarios for July 29, 2025 🔮
🌍 Market‑Moving News 🌍
U.S.–EU Trade Deal Sparks Optimism
The U.S. and EU signed a trade framework allowing a 15% tariff rate on most EU imports, averting harsher penalties. The S&P 500 and Nasdaq both closed at fresh record highs, supported by upbeat tech earnings sentiment—Tesla advanced on a new $16.5B AI chip deal with Samsung—while U.S.–China trade talks resume in Stockholm.
Fed Likely to Hold Rates; Political Pressure Mounts
The Fed is expected to leave its benchmark rate at 4.25%–4.50% at the July 29–30 FOMC meeting. Chair Powell faces growing political pressure from President Trump to cut rates and concerns about central bank independence remain elevated.
Trade Talks Extension to Avoid Tariff Hike Deadline
The August 1 tariff deadline looms. Markets are watching to see if trade deals with China, Canada, and the EU extend the pause or risk new tariffs. Volume in AI/chip stocks and industrials reflects sensitivity to trade developments.
📊 Key Data Releases & Events 📊
📅 Tuesday, July 29
FOMC Meeting Begins — All eyes on Fed rate decision and updated projections.
GDP (Advance Q2 Estimate) — Expected around +1.9% on signs of economic rebound.
⚠️ Disclaimer:
This summary is for educational and informational purposes only—it is not financial advice. Always consult a licensed financial advisor before making investment decisions.
📌 #trading #stockmarket #economy #Fed #trade #tariffs #PCE #jobs #technicalanalysis

CMG entering a stage 4 downtrendCMG may have entered a stage 4 downtrend.The price has reflected sharply off the 200 daily moving average and busted rapidly on enormous volume to the low of the previous volume base formed from the week of March 10th to the week of June 9th. The 200 daily moving average has turned over and is sloping downward, alongside the 50 daily moving average. CMG has demonstrated poor relative strength (SPX). The consumer services sector remains in generally good condition, and there are large market caps that are showing strength and performing well in it. There are also many large market caps in the sector that have transitioned out of their respective stage 2 advances, and have started stage 3 distributions and stage 4 declines. Although MCD, the largest market cap in the restaurant industry, continues to perform very well- most of the stocks in the industry have begun to roll over into stage 3 distribution ranges and stage 4 declines. A short entry in CMG was made at ~$55, and more will be added to this position between $47.50 to $50 if the price corrects back to this level.
