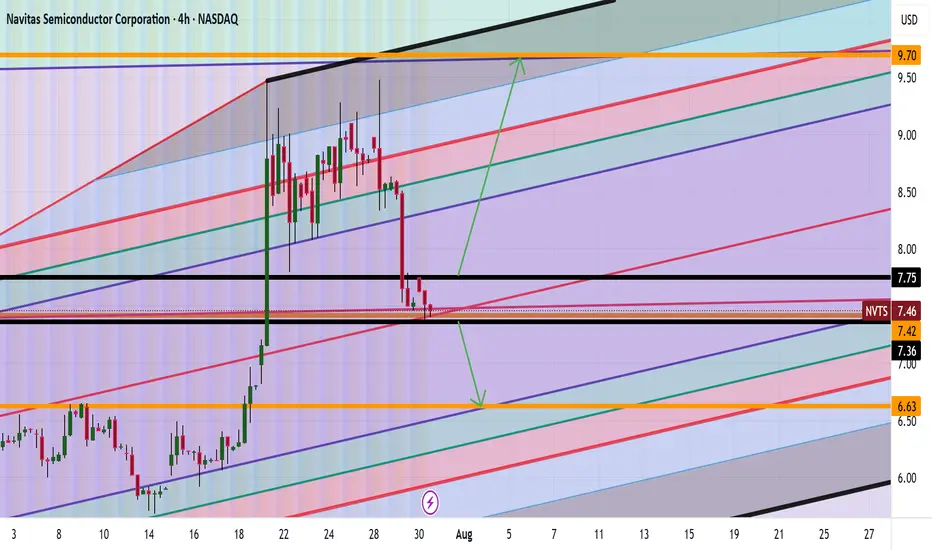
NVTS Analysis Are we Heading to $9+ Good afternoon Trading Family
Based on what we currently see with NVTS are two scenarios happening:
1) Above 7.80 highs we will thus be heading to the 9-9.7 range
2) Below 7.30 lows then we will be heading to the 6 dollar range
Happy Trading
Trade Smarter/ Live Better
Kris
Stocksanalysis
UNH How Far Down Are We Going $32 ? Based on the current class action lawsuit sentiment is negative and if it continues we can see levels of 258 being hit again. However if we break that level down then 163-150 level can possibly get hit followed by the 32-49 dollar range.
However despite all the negative news which does affect the market, if for whatever reasons we can break the high of 326 be prepared for a run up to 535 low probability but it is possible.
Trade Smarter Live Better
Kris/ Mindbloome Exchange

ADM 1D: 10-Month Channel Says Goodbye?Since July 18, 2024, ADM had been locked in a clean downward channel — well-behaved, well-respected. But in May 2025, the structure finally cracked: price broke out, crossed above the 50-day MA, and pulled back for a textbook retest right on the channel’s upper edge. So far, the breakout is holding. The next targets sit at 50.6 (0.618), 53.5 (0.5), and 56.5 (0.382). As long as price stays outside the channel, the bullish structure remains intact.
Connor’s RSI down below is quietly doing its job — already bounced from deep oversold, now curling up with momentum. It’s not flashy, but in this context it signals early strength before the crowd notices.
Fundamentally, ADM is still cleaning up after the early-2024 accounting scandal that nuked investor trust. But management moved fast: reinstated buybacks, tightened guidance, and Q1 2025 came in strong — $22.6B revenue, $0.88 EPS, both beating expectations. ADM remains a pillar of the U.S. ag sector, and in an era of global food anxiety, that means structural demand isn’t going anywhere.
Вот адаптированный перевод финального блока под **английский пост**, в том же живом и профессиональном стиле:
Enjoyed the idea? Like, share, and drop your thoughts in the comments.
It helps keep the content visible, free, and accessible to everyone.
Got your own charts or takes? Let’s discuss them below.

SMCI LONG IDEASMCI broke out of a downtrend and support level with a strong weekly bullish candle. This is a signal that the stock is ready for appreciating in value. The first signal was in November 2024 when there was a divergence on awesome oscillator. This was followed by a breakout of down trend line in February 2025, which made price to move from around 36 to around 66.
Currently, price is showing a strong momentum to rally up again. With a pullback to the key level, the best time to buy the stock is at current price or between 38 and 40. An aggressive trader/investor could have when the previous weekly candle closed bullish, while a conservative trader/investor would have waited for the pullback to the key level which is what's happening at the moment.
The entry is around 38 and 40 while the stop could be 25 and the target can be 66 and 119.
Confluences for the signal:
1. Price broke out of a down trend line and closed with a strong weekly bullish candle.
2. Price also closed above a support level.
3. Price was coming from a strong support level.
4. Awesome oscillator is still below 0 and it's just resuming bullish region.
Disclaimer: this is not a financial advice. The outcome maybe different from the projection. If you can't accept the risk, don't take the signal.

GME LONG IDEA GME has been in a downtrend for a while. The first signal for long was in April 2024 when price was in an oversold region and there was a divergence on the awesome oscillator. This was followed by a breakout of downtrend. From around 16, price went up to 64.
The current price action shows that price is about to rally up again. A weekly bullish candle closing above 30 is a good signal for a long. Price has broken out of a downtrend and support level, closing above these key levels is a good signal to target the high. An aggressive trader or investor may buy at a current price. While a conservative trader may wait for price to close and buy the following week or wait for price to retrace to the support level before placing the buy. To spread risk, one can buy at the current price, add more positions when price retraces to the key level. This will save from missing out and also balance the risk.
Entry could be at current price or 30 while the target can be 48 or 65.
The confluences for the buy are as follows:
1. Downtrend breakout with a weekly bullish candle closing above it.
2. Price respecting uptrend
3. Awesome oscillator resuming bullish momentum
4. Price breaking out of support level.
Disclaimer: this is not a financial advice. The outcome maybe different from the projection. If you can't accept the risk, don't take the signal.

AMD LONG IDEAAMD stock has been in a downtrend for a while. This is also confirmed with the awesome oscillator being in oversold region. However, there's a breakout of the downtrend. This is also supported with price breaking and closing above a support level. An aggressive trader or investor can buy at the current market price. While a conservative trader or investor can wait for price to pull back to the support level before buying.
The entry will be 101.70 while the stop will be 76.05 and the final target will be 226.77.
Confluence for this signal are as follows:
1. Awesome oscillator in oversold region
2. Awesome oscillator divergence
3. Downtrend breakout
4. Weekly bullish candle closing above down trend line and support level.
5. Price respecting uptrend
Disclaimer: This is not a financial advice. The outcome maybe different from the projection. If you can't accept the risk, don't take the signal.

Buy Agnico Eagle Mines LimitedShort Term Trading Advice by Naranj Capital
Buy Agnico Eagle Mines Limited
● Buy Range- 108.5 - 112
● Target- 116 - 118
● StopLoss- 104.5
● Potential Return- 4-5%
● Duration- 14-15 Trading Days
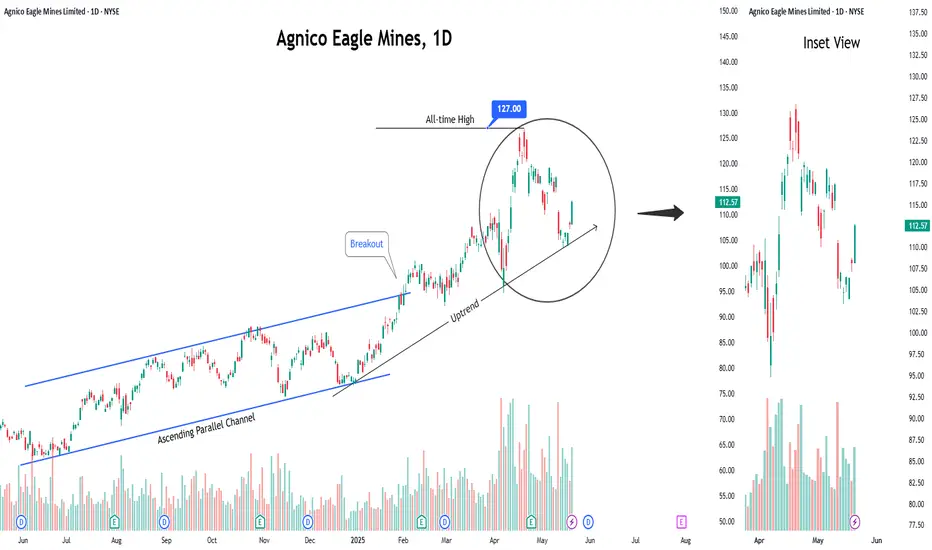
Buy Agnico Eagle Mines LimitedShort Term Trading Advice by Naranj Capital
Buy Agnico Eagle Mines Limited
● Buy Range- 116 - 119
● Target- 125 - 126
● StopLoss- 112
● Potential Return- 5-6%
● Duration- 14-15 Trading Days

Kotak Bank: Impulse formationStock is rising in an impulsive manner and currently trading under wave-4 correction. This correction is likely to conclude in the zone of 2215-2200 zone and then we can expect another rally on the upside under wave-5 towards 2350 zone.

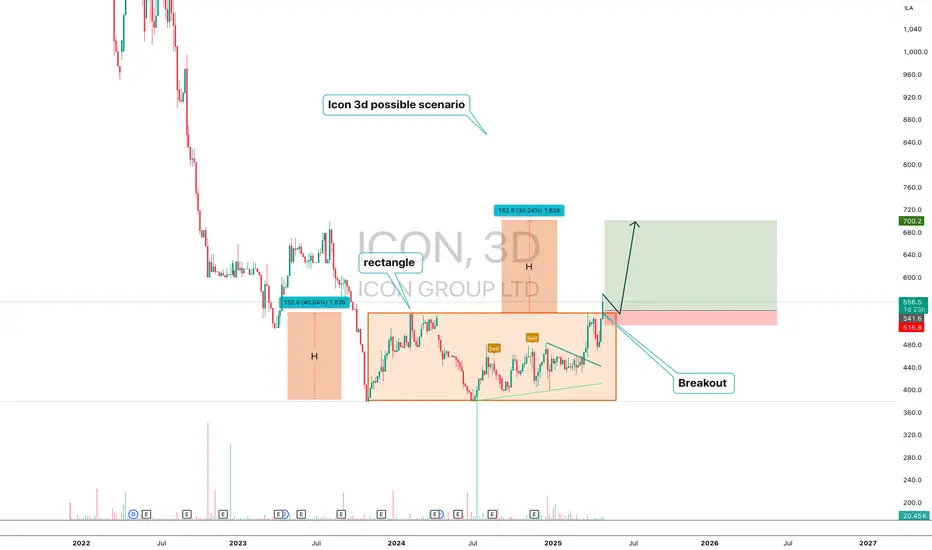
ICON — Breakout from Rectangle with H Projection Targeting $700ICON (3D) — Technical Structure Analysis
ICON has broken out from a prolonged horizontal rectangle pattern ($380–$540). The move activated a measured move structure with two H-sized waves. The first H was completed. The second H projects a move to the $700 area.
Key points:
-Confirmed breakout from range
-First H = 153 pts, completed
-Second H = 162 pts, targeting $700
-Price holding above breakout zone ($515–$541)
ICON has moved out of accumulation and entered trend expansion. As long as the support holds, the scenario remains valid. The technical model targets the $700 area.
Ford (F) Share Price Drops Following Trump's TariffsFord (F) Share Price Drops Following Trump's Tariffs
President Trump has fulfilled his promise to impose tariffs on foreign car manufacturers, introducing a 25% tariff on all cars and light trucks not made in the United States, as well as on "certain auto parts."
As reported by Yahoo Finance: "This will continue to drive growth like you've never seen before," Trump stated from the White House on Wednesday while signing the tariff order. The 25% tariffs are set to take effect on 2 April, adding to existing duties. The White House announced that $100 billion in annual tariffs would be collected.
Why Have Ford (F) Shares Fallen?
Trump’s decision has led to a sharp drop in car manufacturers’ share prices, particularly in Europe. However, shares of American automakers have also declined. Ford (F) shares, according to the price chart, fell by approximately 4% yesterday.
This decline is due to the fact that Ford (as well as GM and Stellantis) has manufacturing facilities in Canada, Mexico, and China, which now means higher costs due to the impact of tariffs on supply chains.
Technical Analysis of Ford (F) Share Price Chart
As we noted when analysing Ford (F) shares on 6 March, Trump's tariff policy previously helped the price recover from a four-year low.
However, it now seems that “the pendulum has swung the other way.” Examining the price chart, we can identify three levels that actively interact with the price (some key reversals are marked with an arrow), with the middle level appearing to act as a median for the "pendulum" of market sentiment.
From this perspective, we can reasonably assume that:
→ The $10.25 level continues to act as resistance;
→ The $9.66 level, acting as a median for Ford (F) price fluctuations, may "attract" the price.
This article represents the opinion of the Companies operating under the FXOpen brand only. It is not to be construed as an offer, solicitation, or recommendation with respect to products and services provided by the Companies operating under the FXOpen brand, nor is it to be considered financial advice.

Buy Brinker InternationalShort Term Trading Advice by Naranj Capital
Buy Brinker International
● Buy Range- 151 - 156
● Target- 166 - 169
● StopLoss- 145
● Potential Return- 6-8%
● Duration- 14-15 Trading Days

Adobe (ADBE) Shares Plunge, Holding Near 22-Month LowsAdobe (ADBE) Shares Plunge, Holding Near 22-Month Lows
Last week, Adobe Inc. (ADBE) reported its quarterly financial results:
→ Earnings per share: Actual = $5.08, Expected = $4.97
→ Gross revenue: Actual = $5.71 billion, Expected = $5.66 billion
Additionally, according to CNBC, the design software giant announced plans to double its AI revenue by the end of the financial year. However, despite these positive figures, Adobe Inc. (ADBE) shares plummeted by approximately 13%, returning to price levels last seen in May 2023.
This decline may reflect investor concerns over Adobe’s AI monetisation strategy and the potential loss of its competitive edge in generative AI.
Technical Analysis of Adobe Inc. (ADBE) Shares
Price movements have established key points (marked with circles) forming a downward channel, which has remained relevant for over a year:
→ The price has fallen to the lower boundary, which previously acted as support in June 2024.
→ It remains below the psychological level of $400 but has not dropped significantly further.
→ The price has not fallen below the 13 January low, recorded after the earnings report.
These factors suggest that demand is preventing further declines in ADBE shares. If positive catalysts emerge, buyers may attempt to push the price back above the $400 level, potentially opening the path towards the channel’s median.
This article represents the opinion of the Companies operating under the FXOpen brand only. It is not to be construed as an offer, solicitation, or recommendation with respect to products and services provided by the Companies operating under the FXOpen brand, nor is it to be considered financial advice.

QMCO: 19.24 Holds or Crashes to 18? #BullRun to 25.61? It appears if we can hold 19.24 and price action continues bulish we can see levels of 25.61 being hit. However if we hold below 21 dollars next level down is 18. Let me know what you think love to hear your thoughts below

Intel (INTC) Shares Surge by Approximately 14%Intel (INTC) Shares Surge by Approximately 14%
As shown in the Intel (INTC) stock chart:
→ Trading opened yesterday with a strong bullish gap.
→ By the end of the session, shares had risen by approximately 14% compared to the previous day's closing price.
According to Dow Jones Market Data, INTC shares recorded their largest percentage gain since 13 March 2020, making them the top-performing stock in the S&P 500 index (US SPX 500 mini on FXOpen) on Thursday.
Why Did Intel (INTC) Shares Rise?
The surge followed the company's announcement of a new CEO appointment. Lip-Bu Tan, a former board member, has been named the new Chief Executive Officer, set to assume the role on 18 March. Investors reacted positively to the decision, as Tan previously achieved significant success as CEO of Cadence Design Systems.
As the Wall Street Journal put it:
"Lip-Bu Tan is Intel’s best hope for a turnaround—if Intel can be fixed at all."
Technical Analysis of Intel (INTC) Stock
In our previous analysis of INTC price movements, we identified an upward channel (marked in blue), which remains relevant.
The current bullish momentum may lead to a breakout above the long-term downward trendline (marked in red). If this happens, it could pave the way for a move towards the psychological level of $30, which served as support last year.
Intel (INTC) Stock Price Forecasts
"We really like the new CEO appointment," wrote BofA Securities analyst Vivek Arya in a note, upgrading Intel’s rating from "Underperform" to "Neutral" and raising the target price from $19 to $25.
According to TipRanks:
→ Only 1 out of 23 analysts surveyed recommends buying INTC shares.
→ The average 12-month target price for INTC is $23.
This article represents the opinion of the Companies operating under the FXOpen brand only. It is not to be construed as an offer, solicitation, or recommendation with respect to products and services provided by the Companies operating under the FXOpen brand, nor is it to be considered financial advice.

TTD LONG SET UP (The Trade Desk)Entry 1 $60.50
Entry 2 $45.50
Stop loss $30.50
Take profit 1- $80.50
(Close 25%)
Take profit 2- $100.50
(Close 50%)
Take profit 3-$120.00
(Close 75%)
Take profit 4-$140.00
(Close 100%)

Nvidia’s Sell-Off Deepens: How to Capitalize on the Decline?📉 Nvidia’s Technical Breakdown:
● Nvidia’s stock has been caught in a storm of selling pressure over the past month.
● The recent breach of critical trendline support levels suggests the downward trend could gain momentum in the days ahead, opening the door for savvy traders to capitalize on the bearish momentum.
🔄 NVDS: The Perfect Inverse Play for Nvidia’s Slide
● For those looking to navigate this decline, an inverse ETF like NVDS NASDAQ:NVDS offers a compelling opportunity.
● Designed to move in the opposite direction of Nvidia’s stock, NVDS has shown a chart pattern that almost perfectly inverse Nvidia’s price action.
● This makes it a strategic tool to potentially profit from the stock’s anticipated slide.

Buy Visa Inc.Short Term Trading Advice by Naranj Capital
Buy Visa Inc.
● Buy Range- 347 - 351
● Target- 361 - 364
● StopLoss- 342
● Potential Return- 3-4%
● Duration- 14-15 Trading Days

Buy Costco Wholesale CorporationShort Term Trading Advice by Naranj Capital
Buy Costco Wholesale Corporation
● Buy Range- 1035 - 1050
● Target- 1101 - 1110
● StopLoss- 1010
● Potential Return- 5-6%
● Duration- 12-14 Trading Days

Finolex Cables: Unveiling the Bullish Momentum Beyond Resistancewww.tradingview.com
Current Market Overview
Finolex Cables Ltd. has exhibited significant price movements recently, indicating potential future trends. The stock is currently priced at 914.95, with notable highs and lows. Analyzing key technical indicators and historical data, we can formulate a well-rounded prediction.
Technical Indicators
Price Levels:
--------------
-> Support Levels: 800, 700
-> Resistance Levels: 1,090, 1,345.75, 1,577
Volume Profile:
------------------
Strong volume around 11,757,413 suggests significant interest and potential support at this level.
Break of Structure (BOS):
-----------------------------
Multiple BOS annotations indicate significant trend changes, highlighting key reversal points.
Order Blocks and D-Key Levels:
-------------------------------------
Order blocks (OB) and D-Key levels mark areas of high trading activity and potential reversal zones.
Historical Performance
The chart showcases several Break of Structure (BOS) points, signaling critical trend reversals. The recent price action around the 800 support level suggests a potential rebound, while resistance levels at 1,090, 1,345.75, and 1,577 indicate possible challenges ahead.
Future Projections
Based on the current analysis, we can outline three potential scenarios:
Bullish Scenario:
-------------------
-> Minimum Projection: 1,090 (+17.38%)
-> Average Projection: 1,345.75 (+47.08%)
-> Maximum Projection: 1,577 (+72.36%)
If the stock breaks above the 1,090 resistance level and sustains this momentum, it may target higher levels. This would require strong buying pressure and favorable market conditions.
Bearish Scenario:
---------------------
If the stock fails to break above 1,090 and instead breaks below the 800 support level, it could decline further towards 700. This would indicate continued bearish pressure and lack of buying interest.
Conclusion
-------------
The technical analysis suggests a potential bullish trend for Finolex Cables Ltd. The support levels around 800 and 700 provide a strong foundation, while the resistance levels at 1,090, 1,345.75, and 1,577 offer potential targets. Traders should monitor these levels closely and consider the projections when making trading decisions.

Super Micro Computer (SMCI) Shares Surge 13%Super Micro Computer (SMCI) Shares Surge 13%
The Super Micro Computer, Inc. (SMCI) stock chart shows:
→ Friday’s closing price rose over 13% from Thursday’s close;
→ The stock has surged more than 80% from its February low;
→ Friday’s close marked the highest level since late October 2024.
SMCI’s rally comes despite an 11 February quarterly report that missed expectations:
→ EPS: $0.59 vs. expected $0.60;
→ Revenue: $5.65bn vs. expected $5.72bn.
Bullish sentiment is driven by (according to media reports):
→ A forecasted $40bn revenue for FY2026, 70% higher than projected FY2025 revenue;
→ Reports indicate that SMCI shares are unlikely to be delisted from NASDAQ due to financial reporting issues (which we previously discussed when analysing the SMCI stock chart on 3 December);
→ Investor enthusiasm for AI and rapid data centre construction to support it.
Technical Analysis of SMCI Stock
The price has reached the key psychological level of $50 per share:
→ Historical price action at this level has often triggered significant reversals;
→ A bullish cup-and-handle pattern is forming.
A higher second low suggests growing demand strength, potentially leading to a bullish breakout above $50.
SMCI Stock Price Forecast
Analysts remain cautious. According to Yahoo Finance:
→ Only 2 of 6 analysts recommend buying SMCI shares;
→ The 12-month average price target is $47.91.
Trade on TradingView with FXOpen. Consider opening an account and access over 700 markets with tight spreads from 0.0 pips and low commissions from $1.50 per lot.
This article represents the opinion of the Companies operating under the FXOpen brand only. It is not to be construed as an offer, solicitation, or recommendation with respect to products and services provided by the Companies operating under the FXOpen brand, nor is it to be considered financial advice.

Costco Wholesale: Robust Earnings Support Bullish Trend◉ Technical Observation
● The stock price is exhibiting a strong uptrend, moving within an ascending parallel channel.
● A recent breakout from a rounding bottom pattern has propelled the price higher, nearing the upper boundary of the channel.
◉ Two Possible Scenarios
1. Rejection and Pullback: The price may face resistance at the upper end of the channel, leading to a potential decline.
2. Breakout and Continuation: Alternatively, the price may break through the upper boundary, sustaining the uptrend and driving the stock higher.
◉ Q1 FY25 Result Highlights
● Net Income: Up 13.1% to $1.79 billion, compared to $1.58 billion in Q1 FY24.
● Comparable Sales: Increased by 5.2% in the US and 5.8% in Canada.
● E-commerce: Comparable sales soared by 13%, with adjusted e-commerce comparable sales rising to 13.2%.
● Membership Revenue: Grew by 7.8% to $1.166 billion, reflecting strong customer loyalty.
● Gross Margin: Improved by 24 basis points to 11.28%.

Investing in US Construction & Engineering: PWR vs FIX vs PRIM◉ Abstract
The U.S. construction and engineering sector is experiencing a significant boom, driven by infrastructure investments, rapid urbanization, and the rise of renewable energy projects. Leading companies such as Quanta Services NYSE:PWR , Comfort Systems USA NYSE:FIX , and Primoris Services Corporation NYSE:PRIM are capitalizing on these trends, each demonstrating strong performance. Among them, PRIM stands out with exceptional financial health and attractive valuation metrics, positioning it as a compelling choice for investors. PWR and FIX are also performing well, benefiting from the sector's growth momentum.
With substantial government spending and ongoing urbanization fueling demand, the sector presents promising opportunities for long-term investors. However, thorough research, clear investment goals, and effective risk management remain crucial to navigating this dynamic landscape successfully.
◉ Introduction
The U.S. construction and engineering sector is a vital component of the nation's economy, driving infrastructure development, urbanization, and economic growth. It encompasses various activities, including residential, commercial, industrial, and infrastructure construction, as well as engineering services for design, planning, and project management. Recent trends shaping the sector include urbanization, sustainability, technological advancements, and government investments in infrastructure.
◉ Key Drivers of Growth
1. Infrastructure Investments: $1.2 trillion allocated for roads, bridges, railways, and clean energy infrastructure.
2. Renewable Energy: Funding boost for solar and wind farms driving demand for construction services.
3. Urbanization: Rapid urbanization fueling demand for residential and commercial construction.
4. Sustainability: Emphasis on green building, energy efficiency, and renewable energy projects.
5. Technological Advancements: Adoption of BIM, drones, and automation improving efficiency and reducing costs.
6. Resilience and Disaster Recovery: Demand for resilient infrastructure and disaster recovery projects due to natural disasters.
◉ Key Players in the Sector
1. Fluor Corporation NYSE:FLR : A global leader in engineering and construction, focusing on energy, chemicals, and infrastructure projects.
2. AECOM NYSE:ACM : A multinational firm providing design, consulting, and construction services for infrastructure, transportation, and environmental projects.
3. Quanta Services NYSE:PWR : A leading provider of specialized infrastructure services for the electric power, oil, and gas industries, including renewable energy projects.
4. Comfort Systems USA NYSE:FIX : A major player in mechanical, electrical, and plumbing (MEP) services for commercial and industrial buildings.
5. Primoris Services Corporation NYSE:PRIM : Provides construction services for energy, utilities, and infrastructure projects, with a growing focus on renewable energy.
This report provides a comparative analysis of Quanta Services, Comfort Systems USA, and Primoris Services Corporation, examining their competitive dynamics in the U.S. construction and engineering sector.
◉ Technical Standings
➖ The charts for PWR, FIX, and PRIM exhibit similar trends, with stock prices currently experiencing a strong uptrend.
➖ Based on this momentum, it is expected that this trend will persist, driving prices even higher in the near future.
◉ Revenue & Profit Analysis
● PWR
➖ Q3 FY24 sales: $6.493 billion, up 16% sequentially and 15.5% YoY.
➖ Q3 EBITDA: $619 million, a significant increase from $463 million in Q2 and $542 million in Q3 FY23.
● FIX
➖ Q3 sales: $1.812 billion, flat sequentially but up 30% YoY.
➖ Q3 EBITDA: $238 million, up from $223 million in Q2 and $155 million in Q3 FY23.
● PRIM
➖ Q3 sales: $1.649 billion, an 8% YoY increase and the highest quaterly sales ever.
➖ Q3 EBITDA: $123 million, up from $112 million in Q2.
◉ Valuation
● P/E Ratio
➖ PWR stands at a P/E ratio of 54.2x.
➖ FIX is at a P/E ratio of 32.3x.
➖ PRIM shows a P/E ratio of 24.3x.
◾ These numbers indicate that PRIM is considerably undervalued when compared to its competitors.
● P/B Ratio
➖ PWR's P/B ratio stands at 6.2x.
➖ FIX's P/B ratio is 9.5x.
➖ On the other hand, PRIM's P/B ratio is significantly lower at 3x.
● PEG Ratio
➖ PWR boasts a PEG ratio of 3.54.
➖ FIX’S PEG ratio is recorded at 0.66.
➖ PRIM, meanwhile, has a PEG ratio of 0.90.
◾ Analyzing the PEG ratios reveals that FIX is currently undervalued relative to its peers.
◉ Cash Flow Analysis
All three companies have reported significant improvements in operating cash flow for Q3 FY24:
➖ PWR saw an 82% increase to $740 million (LTM), up from $391 million (LTM) in Q3 FY23.
➖ FIX reported a 41% rise to $302 million (LTM), compared to $214 million (LTM) in Q3 FY23.
➖ PRIM achieved a 133% increase to $416 million (LTM), up from $178 million (LTM) in Q3 FY23.
◉ Debt Analysis
➖ PWR has a Debt to Equity ratio of 0.6.
➖ FIX shows a Debt to Equity ratio of 0.19.
➖ In contrast, PRIM has a Debt to Equity ratio of 0.73.
◾ FIX boasts the lowest debt-to-equity ratio, indicating a stronger balance sheet and reduced reliance on debt financing compared to its peers.
◉ Top Shareholders
● PWR
➖ The Vanguard Group - 11.4%
➖ BlackRock - 7.62%
● FIX
➖ The Vanguard Group - 10.5%
➖ BlackRock - 14%
● PRIM
➖ The Vanguard Group - 11.5%
➖ BlackRock - 10.4%
◉ Conclusion
After a comprehensive analysis of the major players in the U.S. Construction & Engineering sector, including an in-depth review of technical capabilities and financial performance, Primoris Services Corporation NYSE:PRIM emerges as a standout candidate. The company’s robust financial health, supported by strong cash reserves, positions it well to navigate challenges such as debt concerns.
The sector as a whole is poised for significant growth, driven by massive government spending on infrastructure and the ongoing trend of rapid urbanization. For investors, this presents a compelling opportunity. However, it is essential to conduct thorough research, establish clear investment objectives, and maintain a long-term perspective to capitalize on this growth while effectively managing risks.
