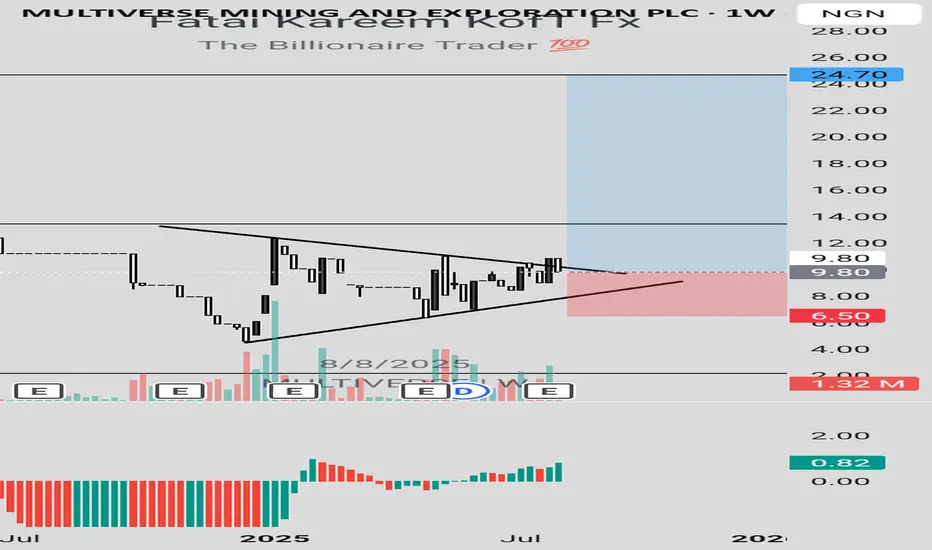
MULTIVERSE LONG IDEAMULTIVERSE just broke out of a trendline with a bullish engulfing candlestick. This happened within the discount level. Hence, this is an indication that price is ready to rally up targeting the high.
To take advantage of this long opportunity, you can buy at the current market price. The stop can be at N6.50 (-33.67%) while the targets are N12.30 (25.51%) and N24.70 (152.04%).
Confluences for the long idea:
1. Trendline breakout
2. Discount level
3. Uptrend
Disclaimer: This is not a financial advice. The outcome maybe different from the projection. Don't take the signal if you're not willing to accept the risk.
Stocksignals
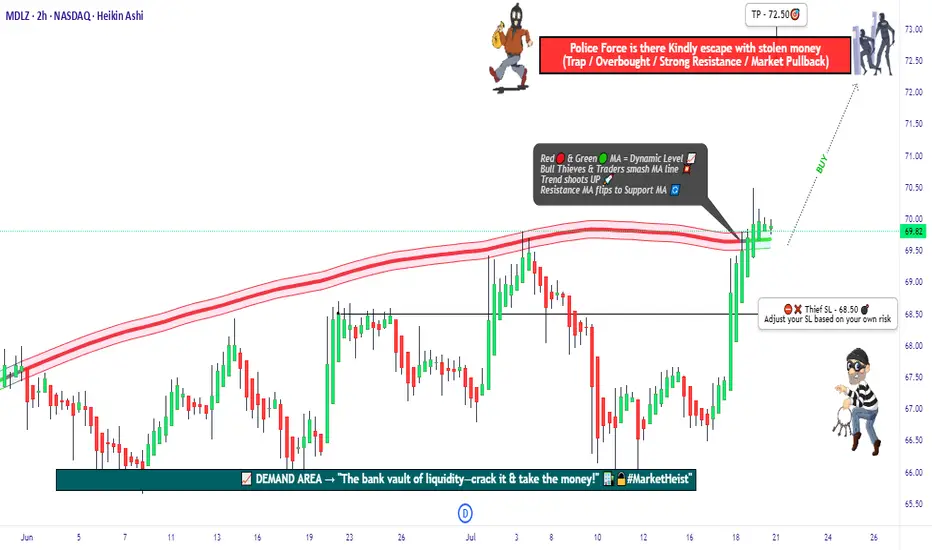
"MDLZ Heist LIVE! Quick Profit Grab Before Reversal!"🚨 MONDELEZ HEIST ALERT: Bullish Loot Zone! (Swing/Day Trade Plan) 🚨
Thief Trading Strategy | High-Risk, High-Reward Play
🌟 Greetings, Market Pirates! 🌟
Hola! Oi! Bonjour! Hallo! Marhaba!
To all Money Makers & Strategic Robbers 🤑💸—this is your blueprint to plunder "MONDELEZ INTERNATIONAL, INC" with precision.
🔎 THIEF TRADING ANALYSIS (Technical + Fundamental)
The Vault is Open! Bullish momentum detected, but caution—this is a high-risk police barricade zone (resistance level).
Overbought? Consolidation? Reversal? Yes. Bears lurk here, but we’re stealing profits before the trap snaps.
🎯 Target: 72.50 (or escape earlier if momentum fades).
🚨 Scalpers: Long-only! Use trailing stops to protect gains.
📈 ENTRY: How to Swipe the Loot
"Buy the Dip" Strategy: Optimal entries on pullbacks (15m/30m timeframe).
DCA/Layering Tactics: Spread limit orders for better risk control.
Aggressive Robbers: Enter now. Patient Thieves: Wait for retests.
🛑 STOP LOSS: Survival Rules
SL at 68.50 (nearest swing low wick on 2H chart).
Adjust based on risk/lot size—protect your capital!
⚡ CRITICAL ALERTS
📰 News Volatility: Avoid new trades during major releases. Lock profits with trailing stops!
📊 Fundamental Drivers: Check COT reports, macro trends, and sector sentiment Klick the 🔗.
⚠️ Reminder: This is NOT financial advice. DYOR and manage risk!
💥 BOOST THE HEIST!
Like 👍 + Boost 🔄 to fuel our next market robbery plan. Together, we trade smarter, steal bigger, and profit faster!
🚀 Stay tuned—more heists coming soon! 🤑🔥
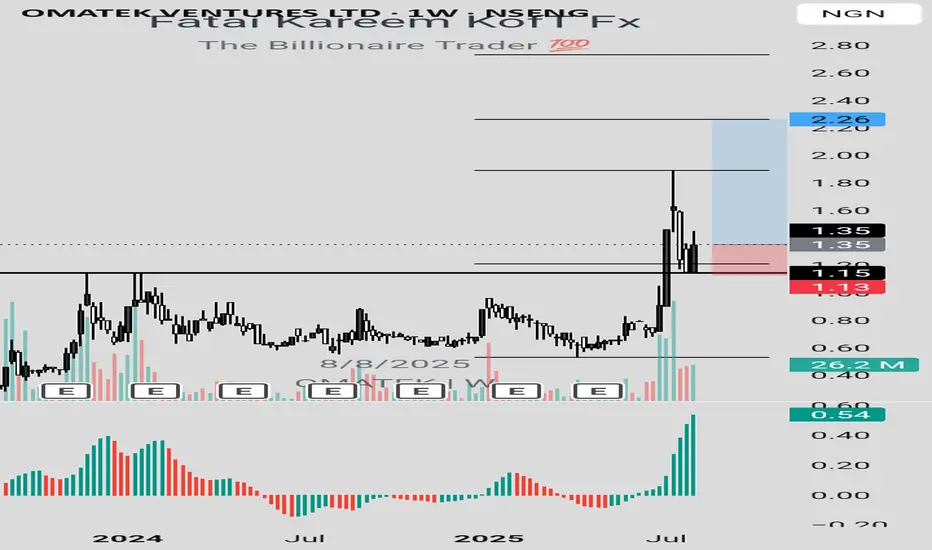
OMATEK LONG IDEAAfter getting to a resistance turned support within the discount level, bullish engulfing candlestick was formed on OMATEK stock. This is a signal that price is ready to go higher.
To take advantage of the long opportunity, you can buy at the current market price. The stop can be at N1.13 (-16.30%) while the targets are N1.89 (40%) and N2.26 (67.41%).
Confluences for the long idea:
1. Key level (resistance turned support)
2. Bullish engulfing candlestick
3. Uptrend
Disclaimer: This is not a financial advice. The outcome maybe different from the projection. Don't take the signal if you're not willing to accept the risk.
NSLTECH LONG IDEALast week, I gave a buy signal on NSLTECH stock, but price didn't get to the area where I expected the buy. However, a bullish engulfing candlestick was formed, showing that price is ready to buy at the current market price. You can buy at the current market price. The stop can be at N0.74 (-24.49%) while the targets are N1.33 (35.71%) and N1.51 (60.20%).
Confluences for the long idea:
1. Key level (Resistance turned Support level)
2. Fibonacci level (0.5)
3. Bullish engulfing candlestick
4. Uptrend
Disclaimer: This is not a financial advice. The outcome maybe different from the projection. Don't take the signal if you're not willing to accept the risk.

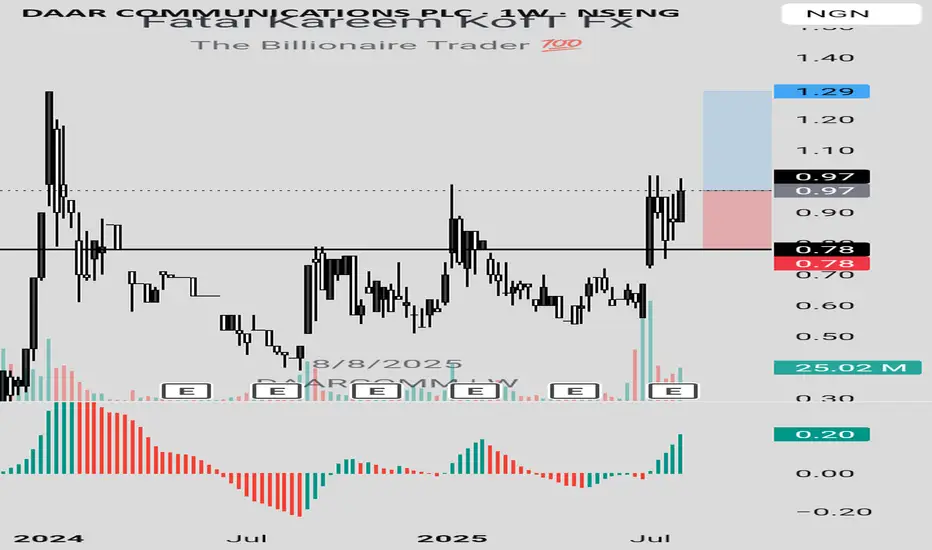
DAARCOMM LONG IDEA DAARCOMM stock, after breaking out of a trendline and retesting a support level, a bullish engulfing candlestick was formed. This is an indication that price is ready to go higher.
To take advantage of this long opportunity, you can buy at the current market price. The stop can be at N0.78 (-19.59%) while the target can be at N1.29 (32.99%).
Confluences for the long idea:
1. Trendline breakout
2. Support level
3. Bullish engulfing candlestick
Disclaimer: This is not a financial advice. The outcome maybe different from the projection. Don't take the signal if you're not willing to accept the risk.
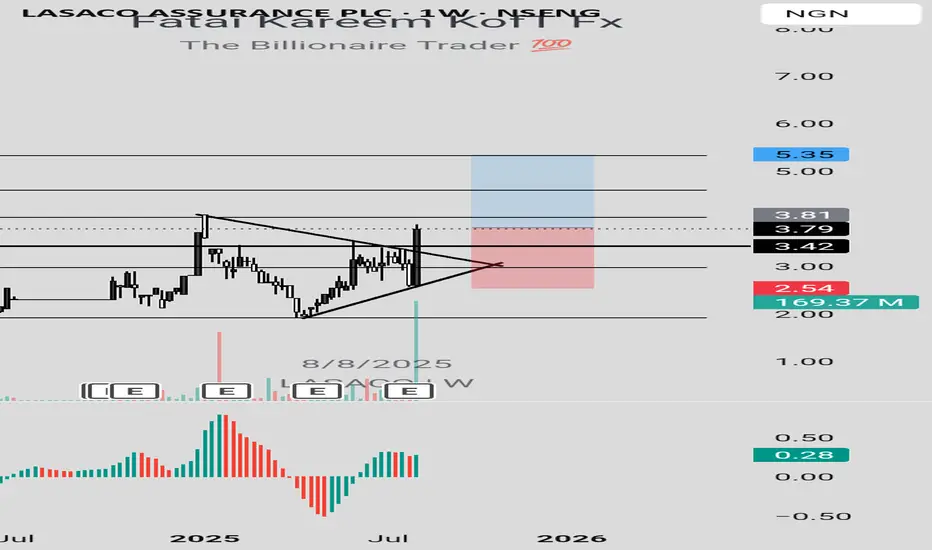
LASACO LONG IDEALASACO stock just broke out of a trendline with a strong bullish engulfing candlestick. In addition to the trendline breakout, the candle also broke a resistance level, respecting the uptrend.
To take advantage of this long opportunity, you can buy at the current market price or wait for price to drop to the resistance turned support level at N3.42. the stop can be at N2.54 (-33.33%) while the target can be at N5.35 (40.16%).
Confluences for the long idea:
1. Trendline breakout
2. Bullish engulfing candlestick
3. Strong volume momentum
4. Uptrend
Disclaimer: This is not a financial advice. The outcome maybe different from the projection. Don't take the signal if you're not willing to accept the risk.
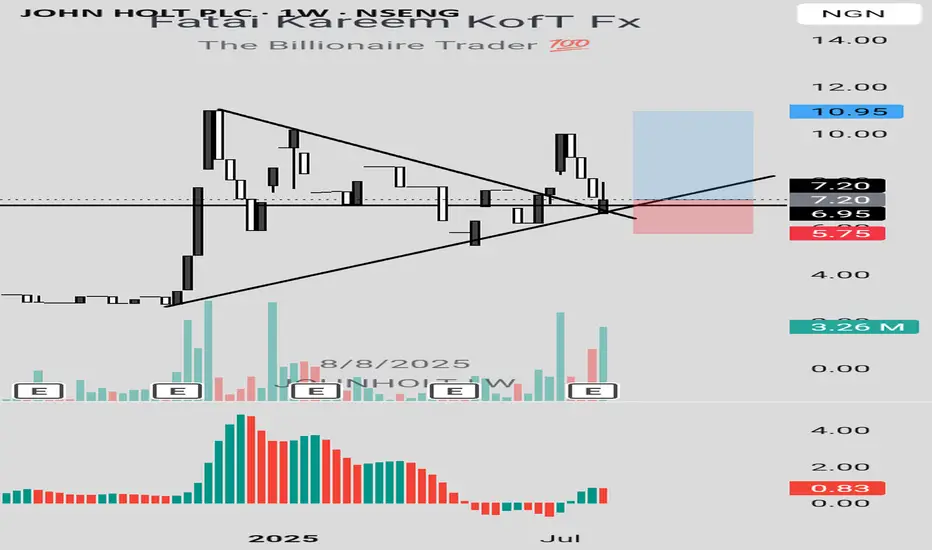
JOHN HOLT LONG IDEAJOHN HOLT stock retested a support level and trendline last week and closed above these key levels, showing the readiness of buyers to push price higher. This was confirmed with a strong volume momentum.
To take advantage of this long signal, you can buy at the current market price. The stop can be at N5.75 (-20.14%) while the targets are N10 (38.89%) and N10.95 (52.08%).
Confluences for the long idea:
1. Breakout and retest of a trendline
2. Uptrend
3. Strong volume momentum
4. Support level
Disclaimer: This is not a financial advice. The outcome maybe different from the projection. Don't take the signal if you're not willing to accept the risk.
DEAPCAP LONG IDEADEAPCAP stock, after breaking out of a trendline and retesting the trendline and support level, it formed a bullish engulfing candlestick, confirming that it's ready to continue the rally.
To advantage of this long signal, you can buy at the current market price. The stop can be at N1.10 (-19.12%) while the targets are N1.60 (17.65%), N1.94 (42.65%) and 2.36 (73.53%).
Confluences for the long idea:
1. Breakout and retest of a trendline
2. Bullish engulfing candlestick confirmation
3. Support level
Disclaimer: This is not a financial advice. The outcome maybe different from the projection. Don't take the signal if you're not willing to accept the risk.

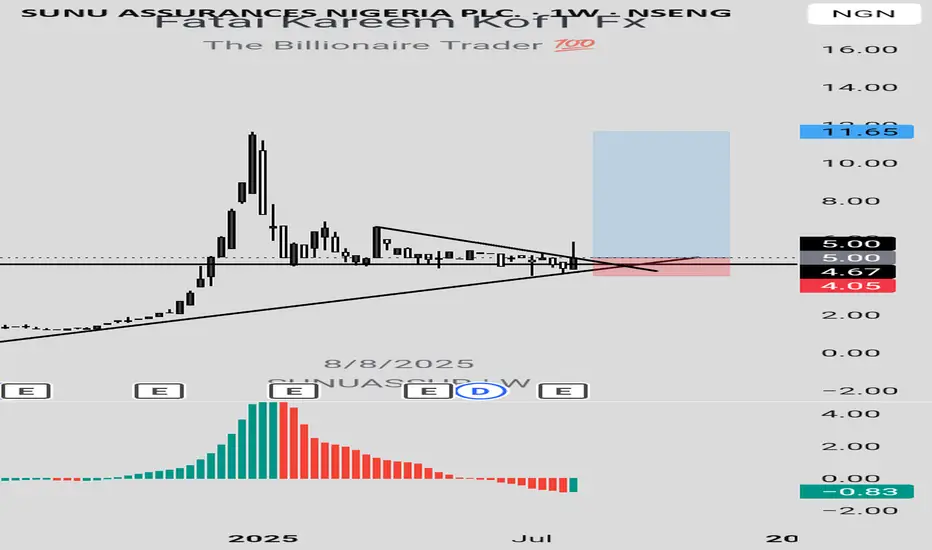
SUNUASSUR LONG IDEASUNUASSUR stock just broke out of a down trendline with a bullish engulfing candlestick confirmation. This happened at a support level in confluence with a trendline. In addition, awesome oscillator shows that the stock is in oversold region, having the potential to go higher.
To take advantage of this long signal, you can buy at the current market price. The stop can be at N4.05 (-19%) while the targets are N6.90 (38%) and N11.65 (133%).
Confluences for the long idea:
1. Bullish engulfing candlestick confirmation
2. Trendline breakout
3. Support level
4. The stock is oversold (Awesome oscillator)
Disclaimer: This is not a financial advice. The outcome maybe different from the projection. Don't take the signal if you're not willing to accept the risk.
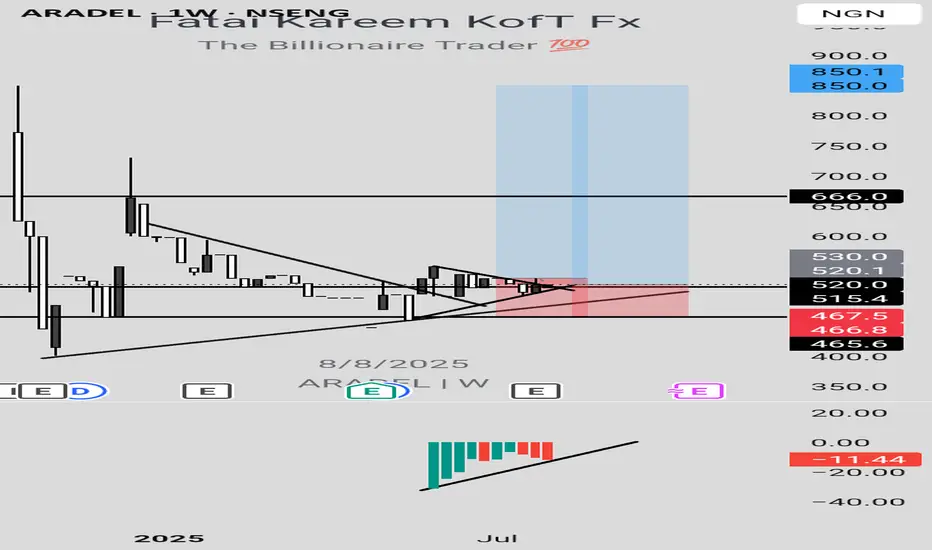
ARADEL LONG IDEAARADEL stock is giving a long signal by having bullish divergence on awesome oscillator using the weekly timeframe. Last week candle closed as a bullish candle after a bullish engulfing candlestick formed in the previous week. This happened at a support level which also has a trendline. In addition, there was a breakout of a down trendline. Confirming that buyers are ready to push the price higher.
To take advantage of this long signal, you can buy at the current market price. Stop can be at N467.5 (-10.11%) while the targets are N666 (27.92%) and 850 (63.43%).
Confluences for the long idea:
1. Awesome oscillator bullish divergence
2. Bullish engulfing candlestick confirmation
3. Support
4. Trendline breakout
Disclaimer: This is not a financial advice. The outcome maybe different from the projection. Don't take the signal if you're not willing to accept the risk.
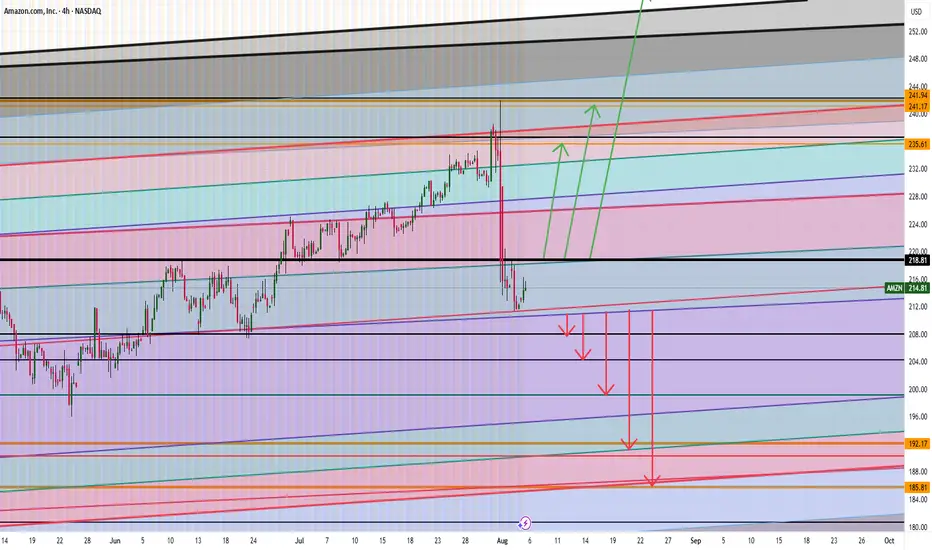
AMAZON ARE WE HEADING TO $258 ? HERE IS THE FULL ANALYSIS Hi Trading fam
So we have Amazon and based on what we are seeing we see two scenarios playing out:
Bullish:
If we can break and hold above 219 then we can see levels of : 235,241,and 258 being hit
Bearish:
If break the low of 210 then we hit 207,204, 199, 190 and then 185
Trade Smarter Live Better
Kris
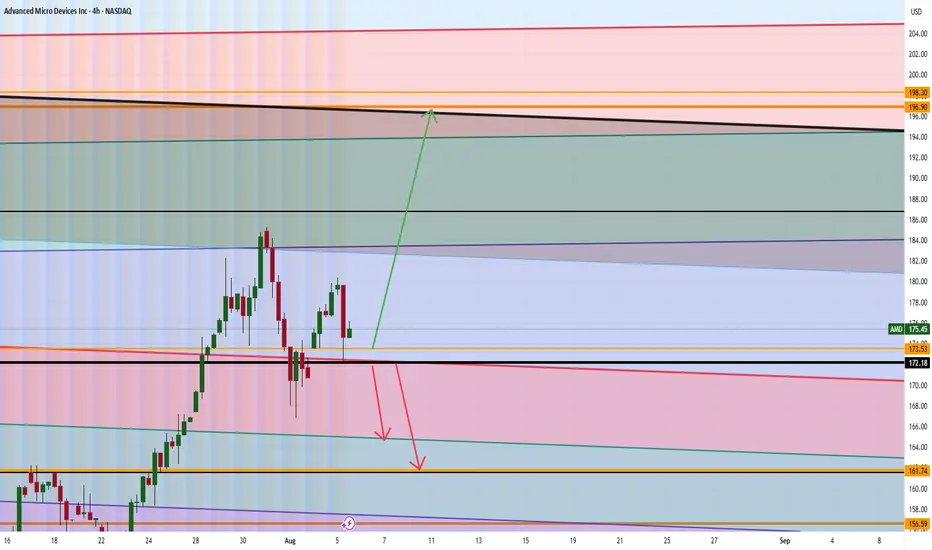
AMD Analysis Are WE GOING TO $199? Good morning trading fam
Currently we a strong bull run for AMD on the Monthly time frame.
Currently if we can hold above 172 then we will see a nice run up to 196-199 territory or higher.
If we break below the 172 we can a quick short down to the orange level we marked out.
Happy Trading
Trade Smarter Live Better
Kris
Ashok Leyland looking attractive on charts. Ashok Leyland Ltd. engages in the manufacture and sale of commercial, defense vehicles, and power solutions.
Ashok Leyland’s Closing price is 121.97. Dividend Yield @CMP = 2.60%. The positive aspects of the company are Companies with decreasing Promoter pledge, Annual Net Profits improving for last 2 years, MFs increased their shareholding last quarter and FII / FPI or Institutions increasing their shareholding. The Negative aspects of the company are High Valuation (P.E. = 23.2), Companies with High Promoter Pledge, Declining Net Cash Flow : Companies not able to generate net cash, Companies with High Debt and Companies with growing costs YoY for long term projects.
Entry can be taken after closing above 123.5 Historical Resistance in the stock will be 126 and 131. PEAK Historic Resistance in the stock will be 142 and 150. Stop loss in the stock should be maintained at Closing below 114 and 100 depending upon your risk taking ability.
Disclaimer: The above information is provided for educational purpose, analysis and paper trading only. Please don't treat this as a buy or sell recommendation for the stock or index. The Techno-Funda analysis is based on data that is more than 3 months old. Supports and Resistances are determined by historic past peaks and Valley in the chart. Many other indicators and patterns like EMA, RSI, MACD, Volumes, Fibonacci, parallel channel etc. use historic data which is 3 months or older cyclical points. There is no guarantee they will work in future as markets are highly volatile and swings in prices are also due to macro and micro factors based on actions taken by the company as well as region and global events. Equity investment is subject to risks. I or my clients or family members might have positions in the stocks that we mention in our educational posts. We will not be responsible for any Profit or loss that may occur due to any financial decision taken based on any data provided in this message. Do consult your investment advisor before taking any financial decisions. Stop losses should be an important part of any investment in equity.

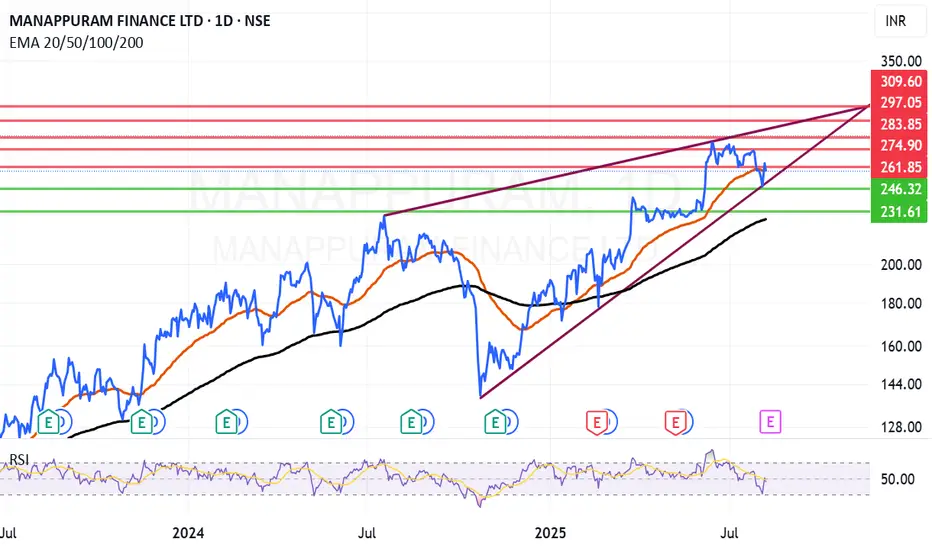
Manappuram can bounce again from Mother line? Manappuram Finance Ltd. is a non-banking financial company, which engages in the provision of financial services, including gold loans, foreign exchange services, and remittances. The firm offers cash loan against gold pledge and also offers customers money transfers and foreign exchange services. It operates through Gold Loan and Others and Microfinance segments.
Manappuram Finance Ltd. Closing price is 258.9. Dividend Yield @CMP = 1.41%. The positive aspects of the company are Stocks Outperforming their Industry Price Change in the Quarter, Companies with Zero Promoter Pledge, Dividend yield greater than sector dividend yield, Rising Net Cash Flow and Cash from Operating activity and FII / FPI or Institutions increasing their shareholding. The Negative aspects of the company are Increase in Provisions in Recent Results, Increasing Trend in Non-Core Income, Declining profits every quarter for the past 2 quarters and Insiders sold stocks.
Entry can be taken after closing above 262 Historical Resistance in the stock will be 274 and 283. PEAK Historic Resistance in the stock will be 297 and 309. Stop loss in the stock should be maintained at Closing below 246 or 231 depending upon your risk taking ability.
Disclaimer: The above information is provided for educational purpose, analysis and paper trading only. Please don't treat this as a buy or sell recommendation for the stock or index. The Techno-Funda analysis is based on data that is more than 3 months old. Supports and Resistances are determined by historic past peaks and Valley in the chart. Many other indicators and patterns like EMA, RSI, MACD, Volumes, Fibonacci, parallel channel etc. use historic data which is 3 months or older cyclical points. There is no guarantee they will work in future as markets are highly volatile and swings in prices are also due to macro and micro factors based on actions taken by the company as well as region and global events. Equity investment is subject to risks. I or my clients or family members might have positions in the stocks that we mention in our educational posts. We will not be responsible for any Profit or loss that may occur due to any financial decision taken based on any data provided in this message. Do consult your investment advisor before taking any financial decisions. Stop losses should be an important part of any investment in equity.
S&P500’s Bullish Island Turns Risky: Elliott Wave Says “Top”The S&P500 Index( SP:SPX ) started to rise and even created a new All-Time High(ATH=$6,428) with the help of the Bullish Long Island Pattern , as I published in my previous idea on May 14, 2025 .
The S&P500 Index is currently moving near the Potential Reversal Zone(PRZ) , upper line of the ascending channel , the Important Resistance line , and the Yearly Resistance(1) .
In terms of Elliott Wave theory , the S&P500 Index appears to be completing microwave 5 of microwave 5 of the main wave 5 .
Also, we can see the Regular Divergence(RD-) between Consecutive Peaks .
I expect the S&P500 Index to correct at least -4% and fall to the lower line of the ascending channel .
First Target: $6,233
Second Target: $6,033
Note: Stop Loss(SL) $6,513
Do you think S&P500 Index can create a new ATH above $6,500 !?
Please respect each other's ideas and express them politely if you agree or disagree.
S&P 500 Index Analyze (SPX500USD), Daily time frame.
Be sure to follow the updated ideas.
Do not forget to put a Stop loss for your positions (For every position you want to open).
Please follow your strategy and updates; this is just my Idea, and I will gladly see your ideas in this post.
Please do not forget the ✅' like '✅ button 🙏😊 & Share it with your friends; thanks, and Trade safe.

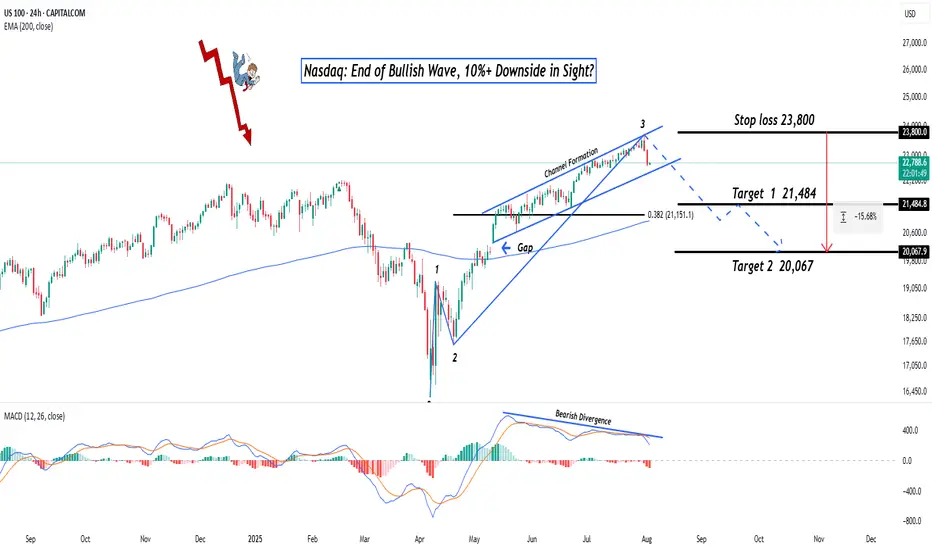
Nasdaq: End of Bullish Wave, 10%+ Downside in Sight?Hey Realistic Traders!
Has CAPITALCOM:US100 (Nasdaq) Finally Peaked? A Reversal Signal Just Flashed. Is This the Turning Point Toward a Deeper Pullback?
Let’s dive into the technicals to see what the chart is really telling us.
Technical Analysis
On the daily chart, the Nasdaq is starting to show signs of weakness. A bearish divergence has formed between the MACD and price movement , which is a classic signal that bullish momentum may be fading. This often indicates the potential for a trend reversal or a deeper correction.
A recent drop, confirmed by a strong bearish full-body candlestick, suggests that selling pressure is increasing. If this continues, we expect a breakdown from the current bullish channel.
In this scenario, the extended Wave 3 may have reached its peak. A correction could follow, with the first target at 21484, which lines up with the 0.382 Fibonacci retracement level. If the decline continues, the next downside target would be around 20067, where a previous gap may be filled.
This bearish outlook remains valid as long as the price stays below 23800 . A move above that level would invalidate the setup and return the outlook to neutral.
Support the channel by engaging with the content, using the rocket button, and sharing your opinions in the comments below.
Disclaimer: "Please note that this analysis is solely for educational purposes and should not be considered a recommendation to take a long or short position on Nasdaq.
TANTALIZER LONG IDEATANTALIZER stock is looking promising. There was a bullish divergence on the awesome oscillator (daily timeframe), which was followed by a bullish change of character. This is a confirmation that the stock is ready to go higher. Price has recently dropped to the demand zone confluenced with trendline and support level, which is a good point to take a long position. After mitigating the demand zone, there was a rejection showing that buyers are willing to push price higher.
To take advantage of this long opportunity, one can buy at the current market price. The first target is N2.99 (24.58%) and the final target is N3.45 (43.75%). The stop can be at 2.10 (-12.50%).
Confluences for the long idea:
1. Bullish market structure
2. Trendline
3. Awesome oscillator divergence
4. Rejection candle
5. Support level
Disclaimer: This is not a financial advice. The outcome maybe different from the projection. Don't take the signal if you're not willing to accept the risk.

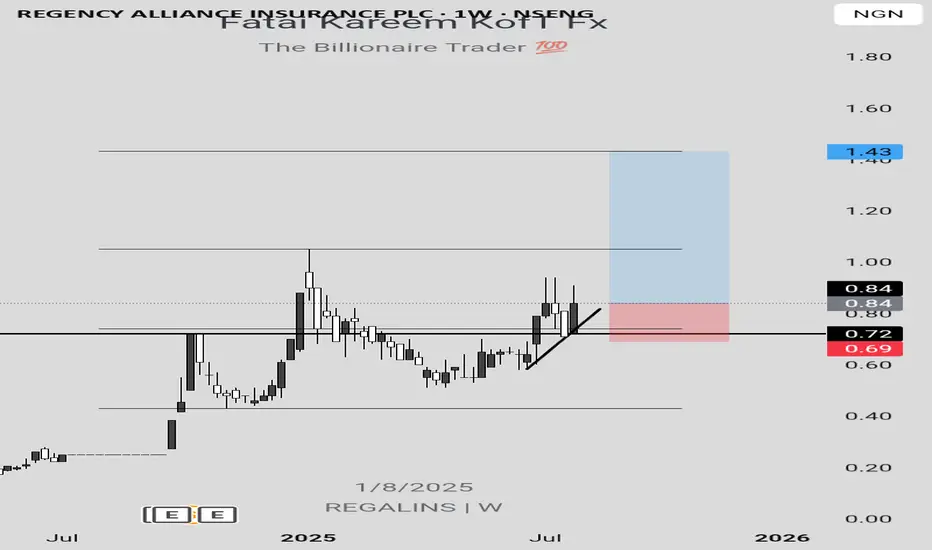
REGALINS LONG IDEA REGALINS stock is yet to take out the recent high which is the target for the current move. Hence, this serves as a long opportunity as confirmed by the bullish engulfing candlestick formation after testing resistance turned to support level. To take advantage of this long opportunity, one can buy at the current market price. The first target is N1.05 (25%) while the final target is N1.43 (70.24%). The stop can be at N0.69 (17.86%) below the support level.
Confluences for the long idea:
1. Bullish engulfing candlestick confirmation
2. Resistance turned to support level
3. Bullish market structure
4. Trendline
Disclaimer: This is not a financial advice. The outcome maybe different from the projection. Don't take the signal if you're not willing to accept the risk.
GUINEAINS LONG IDEA GUINEAINS stock presents a long opportunity based on trendline and support level. To take advantage of this opportunity, there's a need to wait for price to drop to the support level around N75 and N73. An aggressive approach is to enter a long position at that price while a conservative approach is to wait for a candlestick confirmation such as bullish engulfing or hammer. The last high around N1.23 (68.49%) can be the target while the stop can be around N0.57 (21.92%).
Confluences for the long idea:
1. Bullish trendline
2. Support level
3. Bullish market structure.
Disclaimer: this is not a financial advice. The outcome maybe different from the projection. Don't take the signal if you're not willing to accept the risk.

Insiders are selling Roblox ! Heres the levels you need to knowIn this video I lay out a solid plan for a move to the downside for Roblox after a 100% move to the upside since April of this year .
I demonstrate why I believe we will take a 30% retracement and provide confluent evidence to support this theory.
There are some fundamental reasons that I also did include alongside the technical analysis which is not my regular style but important given the context.
Tools used in the video 0.382 Fib , Standard Fib pull, Trend based fib and pivots .

Narayana Hrudayalaya can turnaround from trendline. Narayana Hrudayalaya Ltd. engages in the provision of medical and health care services. It also provides services in the areas of cardiac surgery, cardiology, diabetes and endocrinology, gastroenterology, general surgery, neurosciences, facial surgery, nephrology, obstetrics and gynecology, orthopedics, oncology, pediatrics, transplant, urology, and vascular surgery; and other specialty services, such as dental, dermatology, emergency medicine, ears, nose, and throat, family medicine, general medicine, and genetic.
NH Closing price is 1945.50. The positive aspects of the company are Companies with Zero Promoter Pledge, Company able to generate Net Cash - Improving Net Cash Flow for last 2 years and FII / FPI or Institutions increasing their shareholding. The Negative aspects of the company are high Valuation (P.E. = 50.6), Stocks Underperforming their Industry Price Change in the Quarter, Increasing Trend in Non-Core Income, PEG greater than Industry PEG and MFs decreased their shareholding last quarter
Entry can be taken after closing above 1950 Historical Resistance in the stock will be 2015, 2063 and 2098. PEAK Historic Resistance in the stock will be 2148, 2195 and 2269. Stop loss in the stock should be maintained at Closing below 1863 or 1648 depending upon your risk taking ability.
Disclaimer: The above information is provided for educational purpose, analysis and paper trading only. Please don't treat this as a buy or sell recommendation for the stock or index. The Techno-Funda analysis is based on data that is more than 3 months old. Supports and Resistances are determined by historic past peaks and Valley in the chart. Many other indicators and patterns like EMA, RSI, MACD, Volumes, Fibonacci, parallel channel etc. use historic data which is 3 months or older cyclical points. There is no guarantee they will work in future as markets are highly volatile and swings in prices are also due to macro and micro factors based on actions taken by the company as well as region and global events. Equity investment is subject to risks. I or my clients or family members might have positions in the stocks that we mention in our educational posts. We will not be responsible for any Profit or loss that may occur due to any financial decision taken based on any data provided in this message. Do consult your investment advisor before taking any financial decisions. Stop losses should be an important part of any investment in equity.

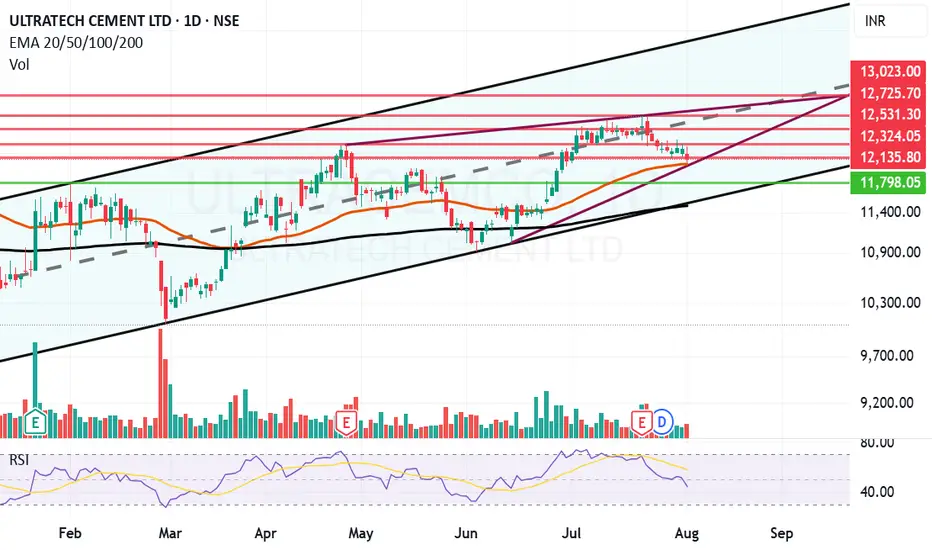
Ultratech can bounce back from Motherline support. UltraTech Cement Ltd. is a holding company, which engages in the provision of manufacture and sale of cement and cement related products.
UltraTech Cement Ltd. Closing price is 12113. The positive aspects of the company are Companies with Zero Promoter Pledge, Companies with Low Debt, FII / FPI or Institutions increasing their shareholding and MFs increased their shareholding last quarter. The Negative aspects of the company are high Valuation (P.E. = 51), Stocks Underperforming their Industry Price Change in the Quarter, RSI indicating price weakness, Increasing Trend in Non-Core Income and Declining Net Cash Flow : Companies not able to generate net cash.
Entry can be taken after closing above 12136 Historical Resistance in the stock will be 12324 and 12531. PEAK Historic Resistance in the stock will be 12725 and 13023. Stop loss in the stock should be maintained at Closing below 11798 or 11492 depending upon your risk taking ability.
Disclaimer: The above information is provided for educational purpose, analysis and paper trading only. Please don't treat this as a buy or sell recommendation for the stock or index. The Techno-Funda analysis is based on data that is more than 3 months old. Supports and Resistances are determined by historic past peaks and Valley in the chart. Many other indicators and patterns like EMA, RSI, MACD, Volumes, Fibonacci, parallel channel etc. use historic data which is 3 months or older cyclical points. There is no guarantee they will work in future as markets are highly volatile and swings in prices are also due to macro and micro factors based on actions taken by the company as well as region and global events. Equity investment is subject to risks. I or my clients or family members might have positions in the stocks that we mention in our educational posts. We will not be responsible for any Profit or loss that may occur due to any financial decision taken based on any data provided in this message. Do consult your investment advisor before taking any financial decisions. Stop losses should be an important part of any investment in equity.
Quantum's Missed IWM Short 8/1/25Well had a moment where I backed out of a A+++ setup. IWM had a ton of -gex pull down to 206. Would have been a massive short to end the week. I canceled my order instantly for no reason at all and missed it. Overall had a great day but this is what separates the elite from the average trader. Will work on this next week.
