KRBL can climb..KRBL Ltd. operates as a holding company which engages in the export of rice miller and basmati rice. It operates through the following segments: Agro and Energy. The Agro segment supplies rice, Furfural, seed, bran and bran oil. The Energy segment comprises of power generation from wind turbine, husk based power plant and solar power plants.
KRBL Ltd. CMP is 300.65. The positive aspects of the company are Attractive Valuation (P.E. = 15.7), Company with Low Debt, Company with Zero Promoter Pledge, FII / FPI or Institutions increasing their shareholding and Rising Net Cash Flow and Cash from Operating activity. The Negative aspects of the company are MFs decreased their shareholding last quarter, De-growth in Revenue and Profit and Increasing Trend in Non-Core Income.
Entry can be taken after closing above 308 Targets in the stock will be 328 and 348. The long-term target in the stock will be 358 and 372. Stop loss in the stock should be maintained at Closing below 288 or 264 depending upon your risk taking ability.
Disclaimer: The above information is provided for educational purpose, analysis and paper trading only. Please don't treat this as a buy or sell recommendation for the stock. We do not guarantee any success in highly volatile market or otherwise. Stock market investment is subject to market risks which include global and regional risks. We will not be responsible for any Profit or loss that may occur due to any financial decision taken based on any data provided in this message.
Stocksignals

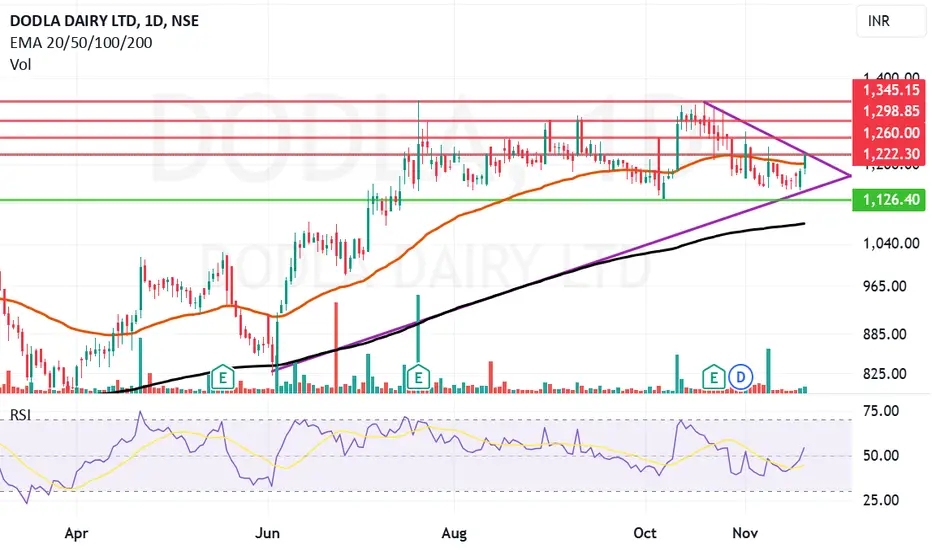
Dodla Dairy looks delicious Dodla Dairy Ltd. engages in procurement of milk and milk products. It offers various milk products like butter, ghee, paneer, curd, flavored milk, doodh peda, ice cream and skimmed milk powder. The firm procures and sells milk and milk products across India.
Dodla Dairy Ltd. CMP is 1220.40. The positive aspects of the company are Company with Low Debt, Company with Zero Promoter Pledge, FII / FPI or Institutions increasing their shareholding, Annual Profit Growth higher than Sector Profit Growth. The Negative aspects of the company are High Valuation (P.E. = 34), MFs decreased their shareholding last quarter and Poor cash generated from core business.
Entry can be taken after closing above 1223 Targets in the stock will be 1260 and 1298. The long-term target in the stock will be 1345. Stop loss in the stock should be maintained at Closing below 1126 or 1079 depending upon your risk taking ability.
Disclaimer: The above information is provided for educational purpose, analysis and paper trading only. Please don't treat this as a buy or sell recommendation for the stock. We do not guarantee any success in highly volatile market or otherwise. Stock market investment is subject to market risks which include global and regional risks. We will not be responsible for any Profit or loss that may occur due to any financial decision taken based on any data provided in this message.
CG power looks Powerful. CG Power & Industrial Solutions Ltd. engages in the design and manufacture of power conversion equipment products. It operates through the Power Systems and Industrial Systems segments. The Power Systems segment includes transformer, switchgear, and turnkey projects. The Industrial Systems segment offers electric motors, alternators, drives, and traction electronics.
CG Power & Industrial Solutions Ltd. CMP is 730.05. The positive aspects of the company are Company with No Debt, Company with Zero Promoter Pledge, FII / FPI or Institutions increasing their shareholding. The Negative aspects of the company are High Valuation (P.E. = 77.3), MFs decreased their shareholding last quarter, Inefficient use of shareholder funds.
Entry can be taken after closing above 733 Targets in the stock will be 754, 786 and 816. The long-term target in the stock will be 854 and 875. Stop loss in the stock should be maintained at Closing below 651.
Disclaimer: The above information is provided for educational purpose, analysis and paper trading only. Please don't treat this as a buy or sell recommendation for the stock. We do not guarantee any success in highly volatile market or otherwise. Stock market investment is subject to market risks which include global and regional risks. We will not be responsible for any Profit or loss that may occur due to any financial decision taken based on any data provided in this message.

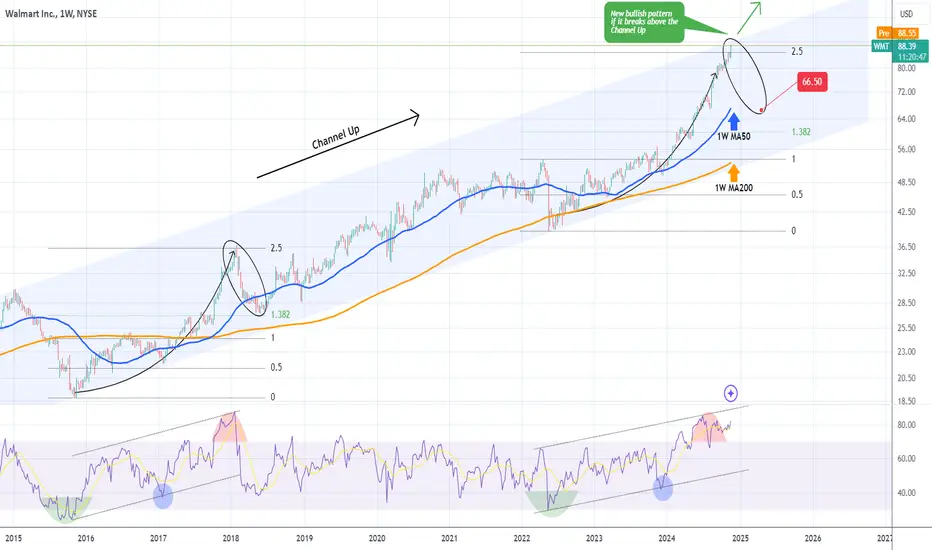
WALMART on top of 10-year Channel. Correction or break-out?Walmart (WMT) has been trading within a 10-year Channel Up pattern since the January 12 2015 High. The price has finally reached the top (Higher Highs trend-line) of this decade-long bullish pattern and that is easily identifiable by the 1W RSI sequence.
The rally that started on the May 16 2022 bottom is very similar to the one that started on the October 26 2015 bottom. The two fractals initially started rebounding and on the first 0.5 Fibonacci test, they held it and entered a more aggressive rally, supported by the 1W MA50 (blue trend-line).
The past one peaked just above the 2.5 Fibonacci extension (January 29 2018). The current week has put us above the 2.5 Fib ext and right at the top of the Channel Up. If it replicates the Jan - May 2018 correction, it could test $66.50. If it closes above the Channel Up though, a new bullish pattern will emerge and we will re-evaluate with the price action we get at that time. However it is easily understandable that having an SL at the top is worth taking the short's risk as the potential reward is much greater than the risk. And if it fails the loss is minimal and we can still follow the bullish trend with a break-out buy.
-------------------------------------------------------------------------------
** Please LIKE 👍, FOLLOW ✅, SHARE 🙌 and COMMENT ✍ if you enjoy this idea! Also share your ideas and charts in the comments section below! This is best way to keep it relevant, support us, keep the content here free and allow the idea to reach as many people as possible. **
-------------------------------------------------------------------------------
💸💸💸💸💸💸
👇 👇 👇 👇 👇 👇
ELI LILLY has at least +50% upside from here.Eli Lilly (LLY) has been trading within a 5-year Channel Up and last week closed below its 1W MA50 (blue trend-line) for the first time since the week of March 06 2023. Despite the bearish pressure of this Bearish Leg since July 15 2024, that last 1W MA50 closing was the previous Higher Low at the bottom of the Channel Up.
The 1W RSI is on a similar level (just below 40.00) with all previous 4 major bottoms and the common characteristic of all was that the stock broke below the 1W MA50 but managed to keep clear and hold the 1W MA100 (green trend-line), practically the most important Support level of the market.
If you want a confirmed buy entry, you might want to wait for yet another Bullish Cross on the 1W MACD (as it happened on all previous bottoms), otherwise this buy opportunity is good to go for at least +58% from the bottom (minimum rise among those 4 Bullish Legs). Our Target is $1135.
-------------------------------------------------------------------------------
** Please LIKE 👍, FOLLOW ✅, SHARE 🙌 and COMMENT ✍ if you enjoy this idea! Also share your ideas and charts in the comments section below! This is best way to keep it relevant, support us, keep the content here free and allow the idea to reach as many people as possible. **
-------------------------------------------------------------------------------
💸💸💸💸💸💸
👇 👇 👇 👇 👇 👇

BALAJI TELEFILMS, Bullish Momentum!BALAJI TELEFILMS (15-Minute Timeframe): Long Trade in Progress!
BALAJITELE Trade Details:
The long trade setup on the 15-minute timeframe has already hit TP1, showcasing a strong upward momentum. The chart indicates a likely continuation towards the remaining profit targets as per the Risological Trading Indicator.
Key Levels:
Entry: 61.67
Stop Loss (SL): 59.67
Take Profit Targets:
TP1: 64.14 ✅ (Hit)
TP2: 68.14
TP3: 72.13
TP4: 74.60
Analysis:
The trade setup reflects a robust bullish trend with price action supported by moving averages. Buyers appear to maintain control, suggesting further upside potential.
Outlook:
With the first target achieved, focus shifts to TP2, TP3, and TP4. If market conditions persist, this trade setup could deliver exceptional gains.
Stay tuned for updates as Balaji Telefilms approaches its profit milestones!

MEDPLUS Soars!MEDPLUS Trade Details:
This trade setup on the 15-minute timeframe demonstrated a robust bullish trend with clean signals provided by the Risological Trading Indicator , resulting in all targets being achieved.
Key Levels:
Entry: 687.90
Stop Loss (SL): 683.95
Take Profit Targets:
TP1: 692.75
TP2: 700.65
TP3: 708.55
TP4: 713.40
Performance Analysis:
The steady uptrend, aligned with the dynamic moving averages, validated the long trade setup. Each profit target was systematically breached, emphasizing the accuracy of the entry and exit strategy.
Trade Outcome:
This trade proved to be a stellar performer, with all targets hit in quick succession, delivering exceptional results for intraday traders.
Maximize your trades with the Risological Indicator – precision, clarity, and profits!

MTARTECH Surges! Long Trade Hits All TargetsMTAR Technologies (15-Minute Timeframe): All Targets Hit!
Trade Details:
A textbook long trade setup on the 15-minute timeframe, perfectly executed using the Risological Trading Indicator . The trade delivered outstanding results with all targets achieved.
Key Levels:
Entry: 1583.90
Stop Loss (SL): 1570.45
Take Profit Targets:
TP1: 1600.50
TP2: 1627.35
TP3: 1654.25
TP4: 1670.85
Performance Analysis:
The strong uptrend, confirmed by moving averages and consistent bullish momentum, aligned with the indicator’s signals. The precise entry point and systematic target levels ensured maximum profit extraction.
Trade Outcome:
Every profit target was hit, reflecting the robustness of the strategy. Traders capitalized on a swift and powerful move, making this trade a standout performer.
Stay tuned for more opportunities like this with the Risological Indicator!

JINDAL WORLDWIDE - Massive Intraday LONG TradeJINDAL WORLDWIDE (15-Minute Timeframe) - Massive Long Trade Secured
Trade Setup:
A powerful bullish breakout captured on the 15-minute timeframe using the Risological Trading Indicator. This trade highlights an impressive rally with all targets hit.
Key Levels:
Entry: 282.75
Stop Loss (SL): 278.30
Take Profit Targets:
TP1: 288.20
TP2: 297.00
TP3: 305.85
TP4: 311.30
Technical Overview:
The price action reflects strong bullish momentum, supported by upward-trending moving averages and consistent buying pressure.
The Risological Indicator provided a timely entry signal, capitalizing on this rapid uptrend.
Results:
The trade successfully achieved all profit targets, delivering substantial gains for intraday traders. The well-defined stop-loss ensured controlled risk, allowing traders to maximize their returns.
Insight:
This trade underscores the effectiveness of the Risological Indicator in identifying high-probability entries and exits in dynamic market conditions.
Keep monitoring for further setups!

ARIES AGRO: 50% Profit in Intraday TradeARIES AGRO (15-Minute Timeframe) - Intraday Sensation!
Trade Overview:
Aries Agro delivers a phenomenal intraday performance, achieving a 50% gain with 5x margin trading. All targets are marked with clear progression on the chart using the Risological trading indicator.
Key Levels:
Entry: 283.40
Stop Loss (SL): 281.75
Take Profit Targets:
TP1: 285.35
TP2: 288.60
TP3: 291.80
TP4: 293.80
Technical Insight:
The price rallied sharply, riding strong bullish momentum, with each target systematically achieved.
The Risological Swing Trader Indicator confirmed the long trade setup early, providing a low-risk, high-reward opportunity.
The upward slope of the moving averages added further confidence to the bullish scenario.
Strategy Tip:
Intraday traders using margin positions are advised to monitor momentum near TP4 for potential reversals or consolidation. Always ensure disciplined stop-loss placement.
A true powerhouse intraday trade — Aries Agro showcases the magic of leveraged trading!

CD Projekt | CDR & Phantom Libertywhat a nice long and what a great day, hows tradin so far Chooms?
cyberpunk dlc phantom liberty coming on September 26th 2023 and cant wait to play this gem
as usual CDPR going to sell million of copies and making hundreds millions of dollar so for me CDR still is safe and good place to printing more money. 2023 is a great year to buy the dips and enjoying 2024 after that

PDS Ltd. Not looking pedestrial. PDS Ltd. is a holding company, which engages in the trading of ready-to-wear apparel. The firm is also involved in the business of holding, owning, leasing or licensing real estate. It operates through the following segments: Sourcing, Manufacturing, and Others.
PDS Ltd. CMP is 514.70. The positive aspects of the company are Company with Zero Promoter Pledge, MFs increased their shareholding last quarter and FII / FPI or Institutions increasing their shareholding. The Negative aspects of the company are high Valuation (P.E. = 47.7), Declining Net Cash Flow : Companies not able to generate net cash.
Entry can be taken after closing above 527 Targets in the stock will be 539 and 570. The long-term target in the stock will be 590 and 603. Stop loss in the stock should be maintained at Closing below 469.
Disclaimer: The above information is provided for educational purpose, analysis and paper trading only. Please don't treat this as a buy or sell recommendation for the stock. We do not guarantee any success in highly volatile market or otherwise. Stock market investment is subject to market risks which include global and regional risks. We will not be responsible for any Profit or loss that may occur due to any financial decision taken based on any data provided in this message.

HDFC Bank Solid as it has been. HDFC Bank Ltd. engages in the provision of banking and financial services including commercial banking and treasury operations. It operates through the following segments: Treasury, Retail Banking, Wholesale Banking, and Other Banking Business.
HDFC Bank Ltd. CMP is 1705.1. The positive aspects of the company are Attractive Valuation (P.E. = 18.8), Company with Zero Promoter Pledge, Stocks Outperforming their Industry Price Change in the Quarter and FII / FPI or Institutions increasing their shareholding. The Negative aspects of the company are Companies with High Debt, MFs decreased their shareholding last quarter, Declining Net Cash Flow.
Entry can be taken after closing above 1717 Targets in the stock will be 1738, 1757 and 1773. The long-term target in the stock will be 1795 and 1818. Stop loss in the stock should be maintained at Closing below 1627 or 1614 depending upon your risk taking ability.
Disclaimer: The above information is provided for educational purpose, analysis and paper trading only. Please don't treat this as a buy or sell recommendation for the stock. We do not guarantee any success in highly volatile market or otherwise. Stock market investment is subject to market risks which include global and regional risks. We will not be responsible for any Profit or loss that may occur due to any financial decision taken based on any data provided in this message.

Ferraci Stock $RACE swing long-term investment at weekly demandFerrari Stock NYSE:RACE swing long-term investment at weekly demand. The stock has reached a decent weekly demand level at $428 per share and it's trying to create a new bullish leg.

BROADCOM Best buy opportunity since September for $223.Broadcom Inc. (AVGO) hit its 1D MA100 (green trend-line) on Friday for the first time in more than 2 months (since September 11). This is the best buy opportunity since then as the dominant pattern remains the Bullish Megaphone.
On top of that, it appears that we are currently within a Bull Flag, similar to the one that was completed when the 1D MA100 was hit and held last time on April 19 2024. The 1D RSI sequences between the two fractals are also very similar. That Flag initiated a price rebound above the 2.5 Fibonacci extension.
As a result, we turn bullish on AVGO again, targeting $223.00.
-------------------------------------------------------------------------------
** Please LIKE 👍, FOLLOW ✅, SHARE 🙌 and COMMENT ✍ if you enjoy this idea! Also share your ideas and charts in the comments section below! This is best way to keep it relevant, support us, keep the content here free and allow the idea to reach as many people as possible. **
-------------------------------------------------------------------------------
💸💸💸💸💸💸
👇 👇 👇 👇 👇 👇

WAAREE ENERGIES - Bullish Momentum in ActionTrade Overview: The bullish setup is unfolding well with TP1 already achieved at 2955.75. Price action is showing strong signs of continuation toward the remaining targets.
Key Levels:
Entry: 2881.85
Stop Loss (SL): 2822.05
Take Profit Targets:
TP2: 3075.35
TP3: 3194.90
TP4: 3268.80
Technical Insight:
The price is trending above the 15-minute moving averages, with a GREEN signal from the Risological Indicator, confirming bullish intent. The breakout beyond TP1 suggests sustained upward pressure.
Traders should watch for any resistance near TP2.
Strategy Tip:
Trail stop loss to lock in profits as the price advances. A pullback toward the entry zone could offer an additional opportunity to strengthen long positions.
Stay tuned for further target hits as Waaree Energies powers through!

POLICYBAZAAR (POLICYBZR) Trade UpdateTrade Overview: A strong bullish momentum is evident, with TP1 already achieved at 1709.20. The remaining targets are well within reach, given the current trend.
Key Levels:
Entry: 1677.05
Stop Loss (SL): 1651.05
Take Profit Targets:
TP2: 1761.20
TP3: 1813.20
TP4: 1845.30
Technical Insight: The price is holding above the critical support levels, with the GREEN trend line from the Risological Indicator signaling continued upward movement. Traders are advised to trail the stop loss to lock in profits as the trade progresses.
Keep monitoring for trend continuity!

JIOFIN: Intraday and Swing Trading Opportunities
Timeframe: 15-Minute for Intraday & Multi-Day for Swing Traders.
Intraday Outlook: For aggressive traders, the Risological Indicator signals a confirmed bullish move with GREEN lines. If the GREEN indicator flips to RED, it’s time to book profits and exit the trade.
Swing Trade Outlook: Using the Risological Swing Trader, TP (Take Profit) targets are clearly marked:
TP1: 319.85
TP2: 333.35
TP3: 346.85
TP4: 355.20
Entry: 311.50
Stop Loss (SL): 304.75
This setup highlights the versatility of the Risological Indicator for both quick intraday decisions and strategic swing trades!

TRENT: Short Trade ThrivesThe 4-hour chart of TRENT showcases a well-executed short trade setup using the Risological swing trader . With TP1 and TP2 targets already hit, the momentum hints at further downside movement towards TP3 and TP4.
Trade Highlights:
Entry Price: ₹7605.35
Stop Loss: ₹7975.20
Targets:
TP1: ₹7148.25 ✅
TP2: ₹6408.65 ✅
TP3: ₹5669.00 (potential) 🔄
TP4: ₹5211.90 (final target) 🔄
Technical Breakdown:
Risological trend line: A steeply falling Risological red trend line validates a persistent bearish trend.
Candlestick Formation: Consistent lower highs signal sustained seller dominance.
Volume Dynamics: Elevated volumes on red candles affirm selling pressure.
Strategic Recommendations:
Current Traders: Trail stop loss to secure profits and ride the trend toward TP3 and TP4.
Potential Entries: Watch for minor pullbacks toward TP2 for fresh short positions.
TRENT’s bearish momentum is far from over. Will TP3 and TP4 seal the deal? Stay tuned! 📉

SUZLON: 27% Gains in 42 Days!SUZLON ENERGY Stock - Short Trade
Trade Summary:
The 4-hour chart of Suzlon Energy showcases a textbook short trade setup, with Targets 1, 2, and 3 already achieved using the Risological swing trading indicator.
This trade has delivered a remarkable 27% profit in just 42 days since the entry.
Target 4 is now firmly in sight, with strong bearish momentum supporting the trend.
Trade Highlights:
Entry Price: ₹76.90
Stop Loss: ₹81.47 (strategic risk placement)
Profit Targets :
TP1: ₹71.26 ✅
TP2: ₹62.12 ✅
TP3: ₹52.98 ✅
TP4: ₹47.33 (nearing completion)
Analysis:
Bearish Momentum: The price remains under the influence of a downsloping Risological Swing Trader indicator , confirming sustained selling pressure.
Steady Decline: The stock has consistently formed lower highs and lower lows, with the red EMA line reinforcing the downtrend.
Next Steps:
For those already in the trade, tighten trailing stops to safeguard profits while giving the trade room to hit TP4.
For new entrants, consider waiting for a retracement before entering to manage risk effectively.
Patience is key—TP4 is well within reach! 🧘♂️📉

Redington looking red hot. Redington Ltd. provision of machinery, equipment and supplies. It includes computers, computer peripheral equipment, software, electronic, and telecommunications equipment and parts. It operates through the India, and Overseas segments.
Redington Ltd. CMP is 193.37. The Negative aspects of the company are MFs decreased their shareholding last quarter. The positive aspects of the company are Attractive Valuation (P.E. = 12.5), Company with Low Debt, Company with Zero Promoter Pledge, Dividend yield greater than sector dividend yield, High Volume, High Gain and Stocks Outperforming their Industry Price Change in the Quarter.
Entry can be taken after closing above 199 Targets in the stock will be 204, 212 and 220. The long-term target in the stock will be 225 and 236. Stop loss in the stock should be maintained at Closing below 180 or 169. depending upon your risk taking ability.
Disclaimer: The above information is provided for educational purpose, analysis and paper trading only. Please don't treat this as a buy or sell recommendation for the stock. We do not guarantee any success in highly volatile market or otherwise. Stock market investment is subject to market risks which include global and regional risks. We will not be responsible for any Profit or loss that may occur due to any financial decision taken based on any data provided in this message.

The Big Exit | How One Auditor Walked Away from Super MicroThe Governance Shortfall: Inside Super Micro’s Auditor Crisis
On Wednesday, shares of the high performance server and storage solutions provider faced renewed selling pressure after the unexpected resignation of its audit firm, Ernst & Young LLP(EY)
In July 2024, EY alerted the Audit Committee about several concerns related to governance, transparency, internal controls, and the risk of delayed filing of the company's annual report. In response, the Board formed an independent Special Committee to investigate these matters, engaging Cooley LLP and forensic accounting firm Secretariat Advisors, LLC. Although EY and the Board received preliminary updates on the investigation, the final conclusions have not yet been shared.
The ongoing review raised doubts for EY regarding the company’s adherence to the COSO Framework principles for internal controls. EY questioned the company’s commitment to integrity, the independence of the Audit Committee, and the reliability of management’s and the Audit Committee's representations.
In its resignation letter, EY expressed its inability to rely on these representations or be associated with the company's financial statements, citing legal and professional obligations.
Despite the developments, Super Micro has indicated no expected changes to previously issued financial statements. The company plans to provide a Q1/FY2025 business update next week. However, it’s surprising that management didn’t include preliminary Q1 results in Wednesday's announcement, which could have mitigated the negative impact on its stock.
Super Micro is nearing a Nasdaq deadline to either regain compliance with listing requirements or submit a plan. With the auditor’s unexpected departure, it may be difficult for the company to present a viable plan, raising the risk of a near-term delisting.
This resignation comes at a critical time for Super Micro, as its rapid growth requires substantial working capital. Based on management’s projections, FY2025 cash needs could reach up to $3 billion, likely necessitating additional capital early next year. However, raising funds without audited financials could be challenging, potentially forcing Super Micro to relinquish market share to competitors like Dell Technologies or Hewlett Packard Enterprise.
In my view, EY’s departure increases the likelihood of a prolonged accounting review, which could hinder Super Micro’s ability to secure funding for anticipated growth. Therefore, it is crucial for the company to report strong preliminary Q1/FY2025 results and present a positive outlook next week.
Super Micro Computer’s troubles continue, as its auditor resigned due to concerns over management’s integrity and the Audit Committee's independence. This situation makes it unlikely for the company to achieve compliance with Nasdaq requirements soon, raising the potential for a near-term delisting.
With a need to re-enter the capital markets in early 2025, audited financials remain essential. A failure to secure funding could result in significant market share loss to major competitors like Dell Technologies and Hewlett Packard Enterprise.
Given these challenges, the increased risk of prolonged financial review, and a likely near-term delisting, I am reaffirming my "Sell" rating on Super Micro Computer's common shares.

META can turn bearish if it fails to break this Channel.Our previous call on Meta Platforms (META) was on July 26 (see chart below), almost 4 months ago when we gave a strong long-term buy signal on the 1D MA200 (orange trend-line):
Despite the excellent timing of the call, we has seen in the past 30 days that the price action has diverged from the model and the current Bullish Leg of the Channel Up isn't as strong as the previous two inside a 2 year span that each rose by +95%.
The price has instead turned sideways, mimicking the price action of the two Accumulation Phases that emerged after each of the Bullish Legs topped. The 1D RSI being on a Bearish Divergence (Channel Down already) technically agrees with that, so if you followed our July buy call, it might be best to book the handsome profit now and wait.
What to wait for? Well it all depends on a new pattern that has emerged, a Diverging Channel Up (dashed trend-lines). As long as the price is trading inside it, there is greater probability to give us a lower buy entry near the 1D MA200 (orange trend-line) again. In that case we will take it and target the top of the Diverging Channel Up at $660.
In the event that the price breaks above the Diverging Channel Up, we will buy the bullish break-out and pursuit the previous $800 Target as that would mean that the original 2-year Channel Up remains the underlying pattern dictating the long-term movement of the stock.
-------------------------------------------------------------------------------
** Please LIKE 👍, FOLLOW ✅, SHARE 🙌 and COMMENT ✍ if you enjoy this idea! Also share your ideas and charts in the comments section below! This is best way to keep it relevant, support us, keep the content here free and allow the idea to reach as many people as possible. **
-------------------------------------------------------------------------------
💸💸💸💸💸💸
👇 👇 👇 👇 👇 👇
