MICROSOFT Correction ahead of 1st 1D Golden Cross in 2 years?Microsoft (MSFT) is just below the $470 All Time High (ATH) and last technical Resistance, following the remarkable rally on the April 07 2025 bottom.
By the first week of June, it should technically form a 1D Golden Cross, which will be its first in more than 2 years (since March 17 2025). That Golden Cross was formed just after the price pulled-back on the 0.382 - 0.5 Fibonacci retracement Zone, finding support on its 1D MA50 (blue trend-line) and rebounding.
As a result, it is quite possible to see a short-term correction to at least $420 before the 1D Golden Cross restores the bullish sentiment. That previous structure eventually hit the -1.0 Fibonacci extension, before the next 1D MA50 test. We therefore expect to see $630 in 2025 before a 1D MA50 correction again.
-------------------------------------------------------------------------------
** Please LIKE 👍, FOLLOW ✅, SHARE 🙌 and COMMENT ✍ if you enjoy this idea! Also share your ideas and charts in the comments section below! This is best way to keep it relevant, support us, keep the content here free and allow the idea to reach as many people as possible. **
-------------------------------------------------------------------------------
💸💸💸💸💸💸
👇 👇 👇 👇 👇 👇
Stocksignals

MSumi Wiring trying to wire up to old levelsMotherson Sumi Wiring India Ltd. engages in the manufacture and sale of wire harnesses, components, and wires to automotive original equipment manufacturers. The company was founded on July 2, 2020 and is headquartered in Mumbai, India.
Motherson Sumi Wiring India Ltd. Closing price is 59.35. The positive aspects of the company are Stocks Outperforming their Industry Price Change in the Quarter, Companies with Zero Promoter Pledge, Companies with Low Debt and FII / FPI or Institutions increasing their shareholding. The Negative aspects of the company are high Valuation (P.E. = 43.1), Increasing Trend in Non-Core Income, Declining Net Cash Flow : Companies not able to generate net cash, Companies with growing costs YoY for long term projects and MFs decreased their shareholding last quarter.
Entry can be taken after closing above 60 Historical Resistance in the stock will be 62.3 and 66.2. PEAK Historic Resistance in the stock will be 69.6 and 72.7. Stop loss in the stock should be maintained at Closing below 55.3 or 53.9 depending upon your risk taking ability.
Disclaimer: The above information is provided for educational purpose, analysis and paper trading only. Please don't treat this as a buy or sell recommendation for the stock or index. The Techno-Funda analysis is based on data that is more than 3 months old. Supports and Resistances are determined by historic past peaks and Valley in the chart. Many other indicators and patterns like EMA, RSI, MACD, Volumes, Fibonacci, parallel channel etc. use historic data which is 3 months or older cyclical points. There is no guarantee they will work in future as markets are highly volatile and swings in prices are also due to macro and micro factors based on actions taken by the company as well as region and global events. Equity investment is subject to risks. I or my clients or family members might have positions in the stocks that we mention in our educational posts. We will not be responsible for any Profit or loss that may occur due to any financial decision taken based on any data provided in this message. Do consult your investment advisor before taking any financial decisions. Stop losses should be an important part of any investment in equity.

NEM SHORT IDEANEM Insurance stock is ready to have a drop. There's a bearish divergence signal from the awesome oscillator showing that there's a high tendency for the price of the stock to drop as much as to 11.65 and below that value. Any value below 11.50 is the discount level where there can be a potential for the next long opportunity.
Looking at the past data, some patterns were revealed. In September 2016, there was a bearish divergence signal and the price dropped from around 3.71 to around around 1.51. Likewise, in September 2022, there was a bearish divergence and the price dropped from around 5.65 to around 3.71. Similar pattern is what is repeating itself showing that there's a higher probability that the price dropped into the discount level. For an investor holding this stock, this maybe a signal to sell and wait for another long opportunity. For a trader, it's an opportunity to short the stock, targeting the discount price around 11.65.
Confluences for the short signal:
1. Price is showing higher high while awesome oscillator is showing lower high indicating bearish divergence.
2. When similar patterns occured in the past, price dropped into the discount level.
3. A bearish engulfing candlestick had been formed showing that price is likely going to drop further.
Disclaimer: This is not a financial advice. The outcome maybe different from the projection. If you can't accept the risk, don't take the signal.

NASCON LONG IDEA CONTINUATIONNASCON stock reached its all time high value of around 77 in January 2024. This happened after a bearish divergence signal from the awesome oscillator. Then, it dropped into the discount level. After which a bullish divergence signal was given, followed by a breakout. Since that breakout, price has been going up and rally for the all-time-high value. The first long opportunity could have been in November 2024 when the price was around 30. The next opportunity was when the price was around 44. Then the next opportunity was when price was around 54. Joining the rally now is not too late since the stock has a potential to hit 77.
Confluences for the long idea
1. Price was coming from the discount level.
2. Price broke out of a down trend line.
3. Price has been rally after a bullish divergence signal given by the awesome oscillator.
4. Bullish engulfing candlestick was formed recently after breaking a key level.
Disclaimer: this is not a financial advice. The outcome maybe different from the projection. If you can't accept the risk, don't take the signal.

RT BRISCOE PLC LONG IDEART BRISCOE PLC stock, after reaching its all time high, dropped to discount level. Currently, it has broken out of down trend line with a strong weekly bullish candle closing above a the down trend line and resistance level. The awesome oscillator is also in the oversold region with a bullish signal. An aggressive trader or investor can buy at the current price while a conservative trader or investor may wait for a drop to around 2.20 and 2.30 to place a buy. While you can also so spread your risk by buying at the current market price and add more positions when price drop towards the resistance turned support.
The entry is at the current market price or buy at 2.20 while the stop can be at 1.73 and the target can be around 2.90 and 4.30.
Confluences for the long signal:
1. Price is in discount level
2. Price broke out of a down trend line and resistance level with a strong bullish candle.
3. Awesome oscillator is in oversold region and showing bullish signal.
Disclaimer: this is not a financial advice. The outcome maybe different from the projection. If you can't accept the risk, don't take the signal.

SMCI LONG IDEASMCI broke out of a downtrend and support level with a strong weekly bullish candle. This is a signal that the stock is ready for appreciating in value. The first signal was in November 2024 when there was a divergence on awesome oscillator. This was followed by a breakout of down trend line in February 2025, which made price to move from around 36 to around 66.
Currently, price is showing a strong momentum to rally up again. With a pullback to the key level, the best time to buy the stock is at current price or between 38 and 40. An aggressive trader/investor could have when the previous weekly candle closed bullish, while a conservative trader/investor would have waited for the pullback to the key level which is what's happening at the moment.
The entry is around 38 and 40 while the stop could be 25 and the target can be 66 and 119.
Confluences for the signal:
1. Price broke out of a down trend line and closed with a strong weekly bullish candle.
2. Price also closed above a support level.
3. Price was coming from a strong support level.
4. Awesome oscillator is still below 0 and it's just resuming bullish region.
Disclaimer: this is not a financial advice. The outcome maybe different from the projection. If you can't accept the risk, don't take the signal.

GME LONG IDEA GME has been in a downtrend for a while. The first signal for long was in April 2024 when price was in an oversold region and there was a divergence on the awesome oscillator. This was followed by a breakout of downtrend. From around 16, price went up to 64.
The current price action shows that price is about to rally up again. A weekly bullish candle closing above 30 is a good signal for a long. Price has broken out of a downtrend and support level, closing above these key levels is a good signal to target the high. An aggressive trader or investor may buy at a current price. While a conservative trader may wait for price to close and buy the following week or wait for price to retrace to the support level before placing the buy. To spread risk, one can buy at the current price, add more positions when price retraces to the key level. This will save from missing out and also balance the risk.
Entry could be at current price or 30 while the target can be 48 or 65.
The confluences for the buy are as follows:
1. Downtrend breakout with a weekly bullish candle closing above it.
2. Price respecting uptrend
3. Awesome oscillator resuming bullish momentum
4. Price breaking out of support level.
Disclaimer: this is not a financial advice. The outcome maybe different from the projection. If you can't accept the risk, don't take the signal.

AMD LONG IDEAAMD stock has been in a downtrend for a while. This is also confirmed with the awesome oscillator being in oversold region. However, there's a breakout of the downtrend. This is also supported with price breaking and closing above a support level. An aggressive trader or investor can buy at the current market price. While a conservative trader or investor can wait for price to pull back to the support level before buying.
The entry will be 101.70 while the stop will be 76.05 and the final target will be 226.77.
Confluence for this signal are as follows:
1. Awesome oscillator in oversold region
2. Awesome oscillator divergence
3. Downtrend breakout
4. Weekly bullish candle closing above down trend line and support level.
5. Price respecting uptrend
Disclaimer: This is not a financial advice. The outcome maybe different from the projection. If you can't accept the risk, don't take the signal.

APPLE Down -4% premarket on Trump's 25% Tariff. Buy opportunity?Apple Inc. (AAPL) is down -4% on pre-market trading following a warning by U.S. President Donald Trump that the company would have to pay a 25% tariff if phones sold in the U.S. were not made within its borders.
Along with a proposed 50% Tariff on goods from the European Union starting on June 01, these news have inflicted fear again in the markets following 6 weeks of a relief rebound on trade deal talks.
So are these announcements a dip buy opportunity for Apple or round 2 of correction?
Based on the stock's long-term pattern, which is a Channel Up, the recent rebound on the 1W MA200 (orange trend-line) is technically the start of its 2nd Bullish Leg. With the Bearish Legs having similar declines (-35% and -32% respectively), we can expect the Bullish Legs to have a proportional rise as well.
On top of that, the 1W RSI rebounded on its multi-year Support, while the 1W MACD is about to form a Bullish Cross.
As a result, since the 2023 Bullish Leg that was complete on July 17 2023 almost touched the 1.236 Fibonacci extension, we expect the price to disregard the news and continue rising up to the new 1.236 Fib and target $285.00.
-------------------------------------------------------------------------------
** Please LIKE 👍, FOLLOW ✅, SHARE 🙌 and COMMENT ✍ if you enjoy this idea! Also share your ideas and charts in the comments section below! This is best way to keep it relevant, support us, keep the content here free and allow the idea to reach as many people as possible. **
-------------------------------------------------------------------------------
💸💸💸💸💸💸
👇 👇 👇 👇 👇 👇

C3.AI has bottomed and is targeting $39.00C3.ai (AI) has been trading within a Channel Down pattern since the June 16 2023 High and right now is testing its 1D MA50 (blue trend-line) as Support, following a bottom (Lower Lows) rebound on April 08 2025.
This is technically the start of its new Bullish Leg, even though based on May - August 2024, it may be delayed. On the long-term though, our Target will be the 0.786 Fibonacci retracement level at $39.00.
-------------------------------------------------------------------------------
** Please LIKE 👍, FOLLOW ✅, SHARE 🙌 and COMMENT ✍ if you enjoy this idea! Also share your ideas and charts in the comments section below! This is best way to keep it relevant, support us, keep the content here free and allow the idea to reach as many people as possible. **
-------------------------------------------------------------------------------
💸💸💸💸💸💸
👇 👇 👇 👇 👇 👇

NVIDIA The 1W MA100 rebound is targeting $225 at least.NVIDIA Corporation (NVDA) broke last week above its 1W MA50 (blue trend-line) for the first time in 2.5 months and all this is generated by April's bottom rebound on the 1W MA100 (green trend-line).
The 1W MA100 has been intact since January 23 2023, so this rebound technically initiates a new Bullish Leg. Since the December 2018 bottom (previous U.S. - China Trade War), the minimum rise on such a Bullish Leg has been +156.11%. As a result, NVIDIA can now target $225 at least before the end of 2025.
-------------------------------------------------------------------------------
** Please LIKE 👍, FOLLOW ✅, SHARE 🙌 and COMMENT ✍ if you enjoy this idea! Also share your ideas and charts in the comments section below! This is best way to keep it relevant, support us, keep the content here free and allow the idea to reach as many people as possible. **
-------------------------------------------------------------------------------
💸💸💸💸💸💸
👇 👇 👇 👇 👇 👇

Coal India May Touch Green Line Soon....Coal india (COALINDIA) Is in Uptrend and uska next Target 427 tak ho sakta hai...
Be Ready with ur capital

Premier Explosives is exploding on charts. Premier Explosives Ltd. engages in the manufacture of explosives, detonators, propellants, services, and other traded items. Its product portfolio includes defense products and commercial explosives. Premier Explosives Ltd. Closing price is 493.50.
The positive aspects of the company are Companies with Low Debt, Strong cash generating ability from core business - Improving Cash Flow from operation, Companies with Zero Promoter Pledge, RSI indicating price strength and FII / FPI or Institutions increasing their shareholding. The Negative aspects of the company are high Valuation (P.E. = 83.7), Stocks Underperforming their Industry Price Change in the Quarter, Companies with growing costs YoY for long term projects and MFs decreased their shareholding last quarter.
Entry can be taken after closing above 496 Historical Resistance in the stock will be 530, 583 and 605. PEAK Historic Resistance in the stock will be 633 and 673. Stop loss in the stock should be maintained at Closing below 429 or 405 depending upon your risk taking ability.
Disclaimer: The above information is provided for educational purpose, analysis and paper trading only. Please don't treat this as a buy or sell recommendation for the stock or index. The Techno-Funda analysis is based on data that is more than 3 months old. Supports and Resistances are determined by historic past peaks and Valley in the chart. Many other indicators and patterns like EMA, RSI, MACD, Volumes, Fibonacci, parallel channel etc. use historic data which is 3 months or older cyclical points. There is no guarantee they will work in future as markets are highly volatile and swings in prices are also due to macro and micro factors based on actions taken by the company as well as region and global events. Equity investment is subject to risks. I or my clients or family members might have positions in the stocks that we mention in our educational posts. We will not be responsible for any Profit or loss that may occur due to any financial decision taken based on any data provided in this message. Do consult your investment advisor before taking any financial decisions. Stop losses should be an important part of any investment in equity.

IRFC trying to break out on a fast track. Indian Railway Finance Corp. Ltd. engages in the business of borrowing funds from the finance markets to finance the acquisition of assets which are leased out to the Indian Railways as finance lease. Indian Railway Finance Corp. Ltd. Closing price is 138.61.
The positive aspects of the company are Stocks Outperforming their Industry Price Change in the Quarter, Companies with Zero Promoter Pledge, RSI indicating price strength, Strong cash generating ability from core business - Improving Cash Flow from operation and FII / FPI or Institutions increasing their shareholding. The Negative aspects of the company are high Valuation (P.E. = 27.9), PE higher than Industry PE, Companies with high market cap, lower public shareholding and MFs decreased their shareholding last quarter.
Entry can be taken after closing above 140 Historical Resistance in the stock will be 152 and 165. PEAK Historic Resistance in the stock will be 176 and 189. Stop loss in the stock should be maintained at Closing below 122 or 108 depending upon your risk taking ability.
Disclaimer: The above information is provided for educational purpose, analysis and paper trading only. Please don't treat this as a buy or sell recommendation for the stock or index. The Techno-Funda analysis is based on data that is more than 3 months old. Supports and Resistances are determined by historic past peaks and Valley in the chart. Many other indicators and patterns like EMA, RSI, MACD, Volumes, Fibonacci, parallel channel etc. use historic data which is 3 months or older cyclical points. There is no guarantee they will work in future as markets are highly volatile and swings in prices are also due to macro and micro factors based on actions taken by the company as well as region and global events. Equity investment is subject to risks. I or my clients or family members might have positions in the stocks that we mention in our educational posts. We will not be responsible for any Profit or loss that may occur due to any financial decision taken based on any data provided in this message. Do consult your investment advisor before taking any financial decisions. Stop losses should be an important part of any investment in equity.

AMD Break-out above this level means new ATH at $300.Advanced Micro Devices (AMD) is on a recovery attempt following the April 07 2025 bottom, which is technically a Higher Low on the 3.5-year Channel Up. This week it broke above the first Resistance level of this attempt, the 1W MA200 (orange trend-line), which is key as it had 2 rejections since February 18 2025.
However the biggest Resistance test is right above it and consists of a strong Cluster of the 1D MA200 (green trend-line), the 1W MA50 (blue trend-line) and the Lower Highs trend-line from the All Time High (ATH).
The previous Bullish Leg of the Channel Up (started on October 10 2022), consolidated for 1 month once it broke above this Resistance Cluster (blue circle) and then marched towards the pattern's Higher High, which was naturally a Higher High.
The similarities between the Legs are striking, the Bearish Legs (both declined by -66.86%) were confirmed by 1W MACD Bearish Cross and the Bullish Legs by a Bullish Cross, which the 1W MACD just completed last week.
This is a major confirmation and technically the earliest for a long-term Buy. Assuming again that the symmetry will continue to hold on this emerging Bullish Leg, we can expect it rise by +318.17% as well. Based on that, our long-term Target on AMD is $300.
-------------------------------------------------------------------------------
** Please LIKE 👍, FOLLOW ✅, SHARE 🙌 and COMMENT ✍ if you enjoy this idea! Also share your ideas and charts in the comments section below! This is best way to keep it relevant, support us, keep the content here free and allow the idea to reach as many people as possible. **
-------------------------------------------------------------------------------
💸💸💸💸💸💸
👇 👇 👇 👇 👇 👇

COINBASE and ALTS going hand in hand! Massive break-out expectedCoinbase (COIN) and the Crypto Total Market Cap (excluding top 10) are going hand in hand in this Cycle as their patterns since the November 08 2021 High have been virtually identical.
Right now we are on a strong rebound which was initiated on both after breaching below the 1W MA200 (orange trend-line). That is basically a Double Bottom, aiming at a break-out above their respective Resistance levels, which is expected to be massive.
Notice how even their 1W RSI patterns are similar, both Falling Wedges. Also their Bull Cycles both started on an Inverse Head and Shoulders pattern, so there is every reason to expect that the two will continue hand in had until their very peaks of the Cycles.
-------------------------------------------------------------------------------
** Please LIKE 👍, FOLLOW ✅, SHARE 🙌 and COMMENT ✍ if you enjoy this idea! Also share your ideas and charts in the comments section below! This is best way to keep it relevant, support us, keep the content here free and allow the idea to reach as many people as possible. **
-------------------------------------------------------------------------------
💸💸💸💸💸💸
👇 👇 👇 👇 👇 👇

SMCI hit its 1W MA50, eyes a massive break-out.Super Micro Computer Inc (SMCI) has surged more than +15% today after the company announced a multi-year, $20 billion partnership with Saudi data center firm DataVolt.
Technically that brought it on its 1W MA50 (blue trend-line), the first contact with it since the week of February 18 2025, which was the previous Top. The current rally as well as the one that led to the Feb 18 Top, is fueled by the 1W MA200 (orange trend-line) which held as Support on both occasions.
The driving pattern behind those Bullish Legs is a Channel Up (blue) and this is not the first time SMCI comes across such formation. It was in fact a similar Channel Up that took the stock from the 2022 bottom of the Inflation Crisis and guided it to its new Bull Cycle. That rose by +950% before it pulled back on its first consolidation.
As a result, we have a short-term Target at $80.00 and after a pull-back, long-term Target at $180.00 (+950% from the bottom).
-------------------------------------------------------------------------------
** Please LIKE 👍, FOLLOW ✅, SHARE 🙌 and COMMENT ✍ if you enjoy this idea! Also share your ideas and charts in the comments section below! This is best way to keep it relevant, support us, keep the content here free and allow the idea to reach as many people as possible. **
-------------------------------------------------------------------------------
💸💸💸💸💸💸
👇 👇 👇 👇 👇 👇

RIVIAN Huge 1-year Triangle about to break. Trade the break-out.Rivian Automotive (RIVN) is trading within a 1-year Triangle pattern since the April 15 2024 Low. Right now the price is on the 1W MA100 (green trend-line), almost hitting the top (Lower Highs trend-line) of the pattern.
This is the second time ever that the 1W MA100 is tested, the previous on was on the last Lower High in late December 2024, giving slightly more probabilities for a bullish break-out above it.
If this is materialized, buy the break-out and target the 2.0 Fibonacci extension on the long-term at $26.50.
If it fails to break and instead is rejected back towards the Triangle's bottom, wait for a confirmed break of the Higher Lows trend-line and sell towards the -1.0 Fibonacci extension at $6.50.
-------------------------------------------------------------------------------
** Please LIKE 👍, FOLLOW ✅, SHARE 🙌 and COMMENT ✍ if you enjoy this idea! Also share your ideas and charts in the comments section below! This is best way to keep it relevant, support us, keep the content here free and allow the idea to reach as many people as possible. **
-------------------------------------------------------------------------------
💸💸💸💸💸💸
👇 👇 👇 👇 👇 👇

UPS United Parcel Service Stock. Top stock to buy in 2025UPS United Parcel Service Stock. Top stock to buy in 2025 after reaching the strong monthly demand level. It took 50 months to reach it and now it's trying to play out as expected. Long-term longs for this American stock.

MCHP Possible Correction? Is MCHP Correcting ?
Well based on hitting a four target in this bullish swing , I can sway makes sense here is the full scope are where we are heading before another move up
Kris/Mindbloome Exchange
Trade Smarter Live Better

ROCKET LAB establishing its long-term Support to $32.00It's been too long (September 30 2024, see chart below) since we last took a trade on one of our stock gems, Rocket Lab (RKLB), which smashed through our $14.50 Target:
The price is now trading sideways for the past 2 weeks, establishing the 1D MA50 (blue trend-line) as the new Support. Having made the Trade War bottom on its 1D MA200 (orange trend-line), it got its much needed overbought technical harmonization and created new long-term demand.
The pattern is similar to the 1D MACD Bearish Cross in late May 2024, which also made the price trade sideways before eventually almost testing the previous Resistance. As a result, we expect to see $32.00 in July before the stock breaks to a new All Time High.
-------------------------------------------------------------------------------
** Please LIKE 👍, FOLLOW ✅, SHARE 🙌 and COMMENT ✍ if you enjoy this idea! Also share your ideas and charts in the comments section below! This is best way to keep it relevant, support us, keep the content here free and allow the idea to reach as many people as possible. **
-------------------------------------------------------------------------------
💸💸💸💸💸💸
👇 👇 👇 👇 👇 👇

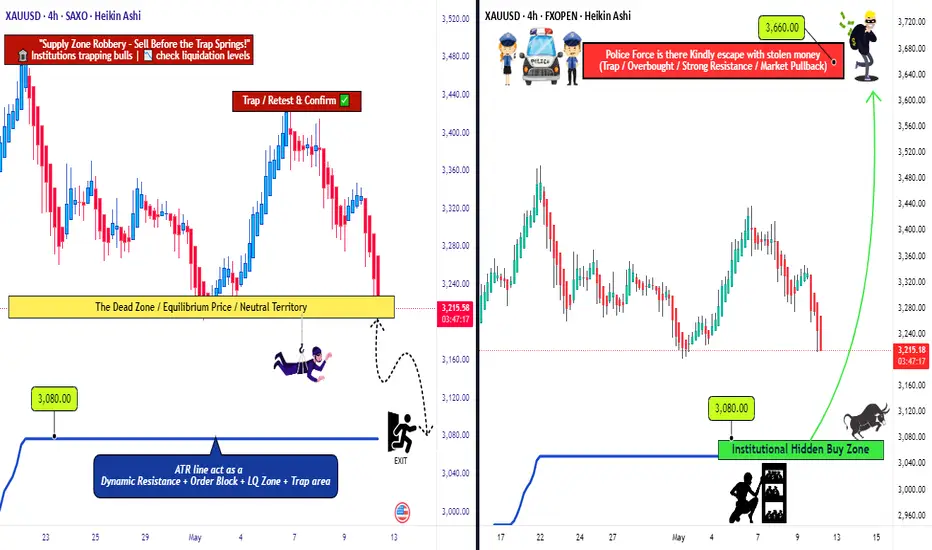
Golden Opportunity: XAU/USD’s Bull & Bear Heist Strategy!Hello Money Makers & Market Bandits! 🤑💰✈️
Get ready to raid the XAU/USD Gold Market with our cunning Thief Trading Style, blending sharp technicals and deep fundamental insights! 📊🔥 Our plan? Strike with precision on both bullish and bearish moves, grabbing profits before the market turns. Let’s outwit the charts and stack that gold! 🏆💸
📈 The Gold Heist Plan
Entry Points 🚪:
🏴☠️ Bullish Move: Wait for a pullback to the Institutional Hidden Buy Zone at 3080—your signal to jump in for bullish gains!
🏴☠️ Bearish Move: Watch for a breakout below the neutral level at 3200—time to ride the bearish wave!
Tip: Set alerts to catch these key levels! 🔔
Stop Loss (SL) 🛑:
Bullish Trade: Place SL at 2960 (4H swing low, Institutional Hidden Buy Zone).
Bearish Trade: Set SL at 3360 (4H swing high).
Adjust SL based on your risk, lot size, and number of orders. Stay sharp—this is your shield! ⚠️
Take Profit (TP) 🎯:
Bullish Robbers: Aim for 3660 or exit early if momentum fades.
Bearish Robbers: Target 3080 or slip out before the market flips.
Escape Plan: Watch for overbought/oversold signals to avoid traps! 🚨
📡 Why XAU/USD?
The Gold Market is in a bearish trend 🐻, driven by:
Fundamentals: USD strength from Fed policy, US growth, and tariffs.
Macroeconomics: US resilience vs. global economic weakness.
COT Data: Bearish speculative bets favor USD.
Intermarket: Rising US yields and equities boost USD, pressuring gold.
Quantitative: RSI and Fibonacci confirm bearish momentum.
🧠 Sentiment Outlook (May 12, 2025)
Retail Traders:
🟢 Bullish: 42% 😊 (Hoping for gold rebound on trade war fears)
🔴 Bearish: 45% 😟 (USD strength and improved US-China relations weigh)
⚪ Neutral: 13% 🤔
Source: Social sentiment & trading platform polls
Institutional Traders:
🟢 Bullish: 30% 💼 (Safe-haven demand amid geopolitical uncertainty)
🔴 Bearish: 60% ⚠️ (USD rally and higher concrete 5/12/2025)
🟢 Bullish: 30% 💼 (Safe-haven demand amid geopolitical uncertainty)
🔴 Bearish: 60% ⚠️ (USD rally and higher yields suppress gold)
⚪ Neutral: 10% 🧐
Source: COT reports & institutional flows
⚠️ Trading Alert: News & Risk Management 📰
News can shake the market like a storm! Protect your loot:
Skip new trades during major news releases.
Use trailing stop-loss to lock in profits and limit losses.
Stay vigilant—volatility is our playground, but only with a plan!
💪 Ride with the Thief Trading Team!
Hit the Boost Button to power up our Thief Trading Style and make this heist epic! 🚀 Each boost fuels our squad, helping us plunder profits daily. Let’s conquer the XAU/USD market together! 🤝
Stay tuned for the next heist! 🐱👤 Keep your charts ready, alerts on, and trading vibe high. Catch you in the profits, bandits! 🤑🎉
#ThiefTrading #XAUUSD #GoldHeist #TradingView #StackTheGold
Walt Disney Co | DISThe Walt Disney Company is reportedly exploring options to sell or find a joint venture partner for its India digital and TV business, reflecting the company's ongoing strategic evaluation of its operations in the region. The talks are still in the early stages, with no specific buyer or partner identified yet. The outcome and direction of the process remain uncertain. Internally, discussions have commenced within Disney's headquarters in the United States as executives deliberate on the most viable course of action. These deliberations signify the company's willingness to adapt and optimize its business operations to align with changing market dynamics. The Wall Street Journal reported on July 11 that Disney had engaged with at least one bank to explore potential avenues for assisting the growth of its India business while sharing the associated costs. This approach suggests a proactive stance by the company to explore partnerships or arrangements that can drive growth while minimizing financial burdens. While it is too early to ascertain the exact direction this exploration will take, the developments in Disney's India business warrant attention, as they may shape the future landscape of the company's presence in this all-important region.
The ongoing shift from traditional TV to streaming has placed Disney and its competitors in a costly and transformative phase. As part of this transition, Disney is actively cutting costs amid macroeconomic challenges that have impacted its advertising revenue and subscriber growth. CEO Bob Iger has been at the forefront of these changes, and his contract was recently extended through 2026 to allow him sufficient time to make transformative changes while strengthening the bench with future leaders of the company.
One of the key considerations for Disney is evaluating its portfolio of TV networks, including ABC and ESPN. Bob Iger has expressed a willingness to be expansive in assessing the traditional TV business, leaving open the possibility of selling certain networks while retaining others acknowledging that networks like ABC may not be core to Disney's new business model. ESPN, as a cable TV channel, is being approached differently. Disney is open to exploring strategic partnerships, such as joint ventures or offloading ownership stakes, to navigate the challenges faced by the sports network. CEO Iger, who had previously expressed pessimism about the future of traditional TV, has found the situation to be worse than anticipated since his return to Disney.
Although the linear networks segment, which accounts for Disney's TV properties such as ABC, National Geographic, FX, and FreeForm, has struggled to grow in the recent past, this segment is still an important part of the company's business, which is evident from the positive operating income reported by this segment in fiscal 2022. As below data reveals, the DTC business and content licensing made operating losses in FY 2022 which were offset by the operating income reported by linear networks. For this reason, investors will have to closely monitor a potential sale of TV assets to evaluate the impact of such a decision on Disney's profitability.
The broadcasting landscape is experiencing a significant shift, with uncertainties surrounding its future and the changing nature of consumer preferences. While linear television channels are not expected to disappear immediately, their consumption continues to decline as viewers increasingly favor OTT platforms. This transition represents a fundamental trend shaping the industry. In terms of business models, subscription video-on-demand (SVOD) services will continue to grow with targeted advertising.
As the ascent of streaming video continues, cable, satellite, and internet TV providers in the United States faced their most significant subscriber losses to date in the first quarter of 2023. Analyst estimates indicate a collective shedding of 2.3 million customers during this period. Consequently, the total penetration of pay-TV services in occupied U.S. households, including internet-based services like YouTube TV and Hulu, dropped to its lowest point since 1992, standing at 58.5%, according to Moffett's calculations.
In Q1, pay-TV services in the U.S. witnessed a nearly 7% decline in customers compared to the previous year, with cable TV operators experiencing a 9.9% decline, while satellite providers DirecTV and Dish Network registered subscriber losses of 13.4%. Virtual MVPDs, which are multichannel video programming distributors, also suffered significant losses, shedding 264,000 customers during the quarter. Comcast, the largest pay-TV provider in the country, lost 614,000 video customers in Q1, and Google's YouTube TV was the only tracked provider to experience subscriber growth, adding an estimated 300,000 subscribers during the period. These trends illustrate the challenges faced by the pay-TV industry, with factors like increasing sports-broadcast fees driving retail prices higher, leading to cord-cutting and subsequent price adjustments by distributors. By 2026, e-Marketer predicts that the number of non-pay TV households will surpass pay TV households by over 25 million.
In efforts to achieve profitability in the streaming business, Disney has implemented significant cost-cutting measures, including saving $5.5 billion through cost reductions and layoffs, and a focus on making Disney+ and Hulu more profitable. Disney aims to enhance Hulu integration, seeing it as a vital component of the company's transition from TV to a streaming-only model. Discussions are also underway for Disney to acquire Comcast Corporation's (CMCSA) stake in Hulu, as Disney currently holds 66% ownership. The company believes that the integration of Hulu and Disney+ will bolster the streaming business and contribute to its profitability. While the negotiations with Comcast over Hulu's valuation are ongoing, the combined offering of Disney+ and Hulu is expected to be available to consumers by the end of the calendar year. Although Disney's plans for ESPN+ and the fate of its other cable channels, such as the Disney Channel, remain uncertain, Bob Iger expects ESPN to eventually move to a streaming-only model, acknowledging the disruptive nature of the traditional TV business model.
The discussions surrounding Walt Disney's TV and streaming business in India come at a critical juncture for the company, as it grapples with intensified competition and significant challenges in the market. The emergence of Reliance Industries' JioCinema streaming platform has posed a considerable threat to Disney's dominance, especially after Reliance secured digital rights for the highly popular Indian Premier League cricket tournament. This strategic move by Reliance, which offered free access to the tournament earlier this year, caused a substantial decline in Disney+ Hotstar's subscribers, a popular streaming service under Disney's India business.
Additionally, Viacom18, which is backed by Reliance and Paramount Global (PARA), made a significant impact on Disney's market position in India. Through its partnership with Warner Bros, Viacom18 secured content rights to popular shows on HBO including Succession, previously aired on Disney's platform. This collaboration forms a formidable alliance challenging Disney's dominance in the Indian market. Reliance's freemium model poses the most significant threat to Disney's current position. By offering content for free on its streaming platform, JioCinema attracted a substantial number of subscribers through the broadcast of IPL. With its ample cash reserves, Reliance has the advantage of focusing on subscriber growth without immediately focusing on monetization strategies. The loss of streaming rights for the IPL, combined with a subsequent decline in paid subscribers, had a profound impact on Disney's reputation in India in the first quarter of this year, which could very well be the most challenging Q1 Disney has had in India for a long time.
A report on video consumption trends in India by Media Partners Asia sheds light on the dynamic landscape of the online video sector in India. For the 15 months that ended in March 2023, total consumption across the online video sector reached a staggering 6.1 trillion minutes. During this period, Disney+ Hotstar emerged as the dominant player in premium VOD, capturing 38% of viewing time. The report attributes Hotstar's success to its strong sports offerings and the depth of its Hindi and regional entertainment content.
During the survey period, Zee and Sony together held a 13% share of the Indian premium video sector viewing time. While the two companies are expected to merge pending regulatory approval, they are projected to operate independently for another year, benefiting from strong engagement across sports as well as regional, local, and international content. Prime Video and Netflix, Inc. (NFLX) collectively accounted for a 10% share of viewership in the premium VOD category. Prime Video also garnered a significant portion of viewership from regional Indian titles. The report emphasizes that local content dominates premium VOD viewership, particularly outside the sports category, while international content leads paid tiers. Catch-up TV is prevalent in the free tier across freemium streaming platforms.
Although Disney was the clear winner in 2022, this report highlights a significant shake-up in the market brought about by the transformation of JioCinema. JioCinema, which previously held a mere 2% share of the premium video market, experienced a major upswing in growth since April. This surge can be attributed to JioCinema's decision to offer free live streaming of the popular IPL cricket tournament, a property that was previously exclusive to Disney-owned media in India. Despite technical glitches impacting user experience, JioCinema witnessed a more than 20-fold increase in consumption in April 2023, enabling it to dominate the premium VOD category. The report raises questions about JioCinema's ability to sustain this growth and scale in the absence of IPL action after June 2023. That being said, this could be an early indication of growth challenges Disney-owned brands may face in India.
Star India, now known as Disney Star following the rebranding last year, is expected to experience a revenue drop of around 20% to less than $2 billion for the fiscal year ending September 2023. Additionally, EBITDA is projected to decline by approximately 50% compared to the previous year. Furthermore, Hotstar is estimated to lose 8 to 10 million subscribers in its fiscal third quarter as well.
Given the current scenario, finding an outright buyer for Disney's India business is expected to be challenging. When Disney acquired the entertainment assets of 21st Century Fox in 2019, the enterprise value of the Indian business was estimated at around $15-16 billion. This high valuation, coupled with the intense competition and declining subscriber base, presents a complex landscape for potential buyers or partners.
I believe Disney stock is attractively valued today given that the company's streaming business has a long runway for growth internationally while its brand assets will continue to drive revenue higher. As an investor, I am both concerned and curious about what the future holds for Disney's linear networks segment. Going by the recent remarks of CEO Iger, major changes are on their way. A strategic decision to divest non-core assets, in my opinion, will trigger a positive response from the market. That being said, a major divestment of TV assets could materially impact the company's profitability in the next 3-5 years until its streaming business scales enough to replace lost revenue from the linear networks segment. Investors will have to closely monitor new developments to identify a potential inflection point in Disney's story.
