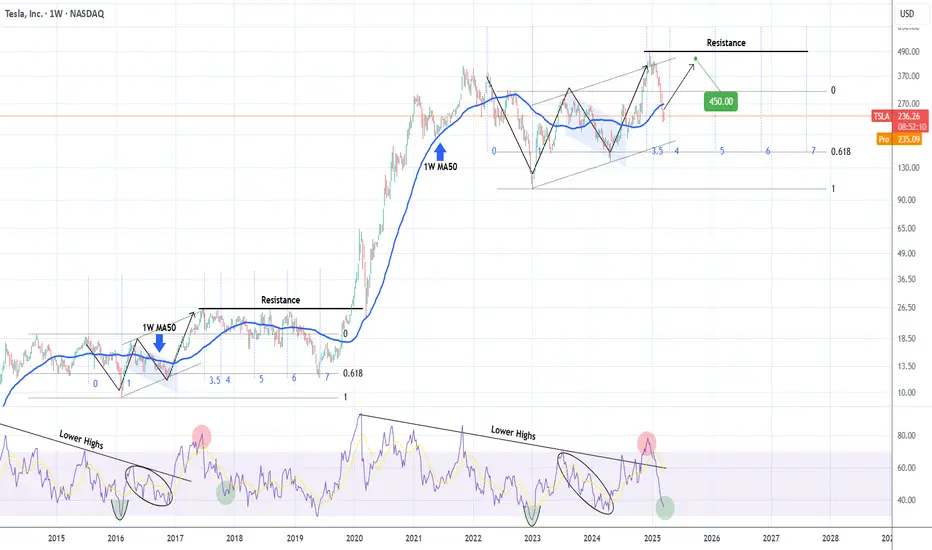
TESLA pricing its long-term bottom. $450 rebound highly likely.Nine months ago (June 26 2024, see chart below), we signaled the start of an enormous rally on Tesla (TSLA), which eventually hit our minimum Target ($400), based on a fractal from 2014 - 2016:
Since the upper 1.382 Fib Target wasn't achieved, the model is readjusted and this count makes better sense. Based on the 1W RSI we are on a bottom similar to October 30 2017 around the 4.0 Time Fib extension. That past sequence initiated a rebound towards the market Resistance before the next decline headed to the 5.0 Fib extension.
As a result, we believe Tesla will find a bottom here and target $450 just below the Resistance level.
-------------------------------------------------------------------------------
** Please LIKE 👍, FOLLOW ✅, SHARE 🙌 and COMMENT ✍ if you enjoy this idea! Also share your ideas and charts in the comments section below! This is best way to keep it relevant, support us, keep the content here free and allow the idea to reach as many people as possible. **
-------------------------------------------------------------------------------
💸💸💸💸💸💸
👇 👇 👇 👇 👇 👇
Stocksignals
COINBASE This is the time to buy and target $400Coinbase Global (COIN) has been trading within a Channel Up pattern since the March 25 2024 High, so effectively a whole year. In the past 10 days it has been consolidating on top of the 1W MA100 (red trend-line), which is the natural long-term Support of the market.
During the same time it entered the Mayer Multiple Bands (MMB) Buy Zone, consisting of the 3 SD (green trend-line) and 2 SD (blue trend-line) below levels, which has given the ultimate buy signals since the January 2023 market bottom. Practically, the stock is consolidating within the 2 SD below and 1W MA100, a tight buy range.
Given the symmetry of the Channel Down Bearish Legs (both -48.39%), we expect a similar symmetry on its Bullish Legs too. Since the previous one reached the 1.236 Fibonacci extension, we are confidently targeting $400 before this Cycle tops. That would also make a perfect entry within the MMB Sell Zone that consists of the Mean MM (black trend-line) and 1 SD above (grey trend-line).
Notice also how the 1W RSI touched the Support of the September 06 2024 Low.
-------------------------------------------------------------------------------
** Please LIKE 👍, FOLLOW ✅, SHARE 🙌 and COMMENT ✍ if you enjoy this idea! Also share your ideas and charts in the comments section below! This is best way to keep it relevant, support us, keep the content here free and allow the idea to reach as many people as possible. **
-------------------------------------------------------------------------------
💸💸💸💸💸💸
👇 👇 👇 👇 👇 👇

QMCO: 19.24 Holds or Crashes to 18? #BullRun to 25.61? It appears if we can hold 19.24 and price action continues bulish we can see levels of 25.61 being hit. However if we hold below 21 dollars next level down is 18. Let me know what you think love to hear your thoughts below

MICROSOFT Channel Down bottom formation targets $440.Microsoft (MSFT) has been trading within a Channel Down since the July 05 2024 High. The stock is on its latest Bearish Leg in the past 3 months and almost completed a -17.62% decline, similar with the Bearish Leg that led to the August 05 2024 Low.
As the 1D RSI has Double Bottomed, which is what it did on the April 30 2024 Low that kick started a rally of +20.63%, we expect the stock to initiate its new Bullish Leg of the Channel. The previous one was +18.16%, so we expect a similar range and target $440.
-------------------------------------------------------------------------------
** Please LIKE 👍, FOLLOW ✅, SHARE 🙌 and COMMENT ✍ if you enjoy this idea! Also share your ideas and charts in the comments section below! This is best way to keep it relevant, support us, keep the content here free and allow the idea to reach as many people as possible. **
-------------------------------------------------------------------------------
💸💸💸💸💸💸
👇 👇 👇 👇 👇 👇

Master Price Action Trading With Expedia Group StockExpedia Group NASDAQ:EXPE stock is dropping as expected. This decline highlights the importance of understanding supply and demand imbalances, particularly on larger timeframes like the monthly chart, which many traders often overlook. Ignoring these imbalances can lead to costly mistakes, as evidenced by the current bearish price action in $EXPE.
The strong imbalance at $195 per share is helping the stock price to drop as expected. We can see bearish price action being formed with room to drop much lower. There is room to reach the latest bullish impulse in the monthly timeframe.

A Huge Technical Re-Test of This Important TL Has Just Occurred!Trading Family,
Tariff FUD is recking traders rn. After breaking important support which started in Nov. '24, I knew the SPY was in trouble. My first target down was 563. We hit that and broke it. My second target down was 550. We are there right now! Will it hold? I don't know. TBH, I don't think any analyst that is honest knows. Investors have never seen Tariffs levied like they have been recently by the Trump admin. Noone really knows how this is going to impact the current economy, which is now global (big diff from the last U.S. tariff econ in the late 1800's).
But I can say that this is a big support which is the neckline of our large long-term Cup and Handle pattern started all the way back in Jan. of 2022! We did have one retest already. Usually, this is all that is needed. But apparently, the market wants another. Though the support is strong, remember, every time it is tagged, it weakens. Thus, if it can't hold this current downturn, I suspect it will drop hard from here should it break, possibly dropping all the way to 460. Be prepared for this and watch your trendline closely!
On the other hand, if it holds, I see a huge bounce incoming! We'll probably then go all the way back up to test the underside of that support (red with two with lines) that we broke. Hold on to your hats! We are living in unprecedented times with unprecedented market volatility.
The last item to note is that, once again, this all seems to be occurring at the same time that U.S. congress and senate are voting on a continuing resolution. Correlation does not necessarily equal causation however, in this case, I would suggest that should a U.S. gov't shutdown occur, our support will break and down we'll go. Should a CR pass, big bounce incoming. Stay tuned and watch the news closely for this. It seems to be a news driven event.
✌️ Stew

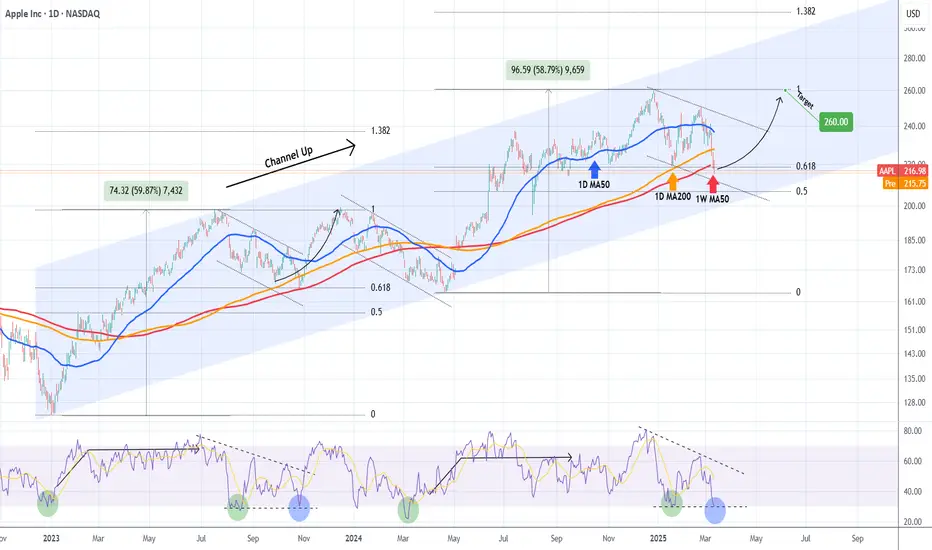
APPLE Buy opportunity on the 1W MA50.Apple Inc. (AAPL) has been trading within a 2-year Channel Up since the January 03 2023 bottom and in the past 3 months (December 26 2024) has been forming the latest Bearish Leg. On Tuesday this Leg broke below its 1W MA50 (red trend-line) for the first time in 10 months (since May 08 2024), which is the strongest buy signal since the April 19 2024 Higher Low bottom of the Channel Up.
As you can see, even the 1D RSI pattern is similar with the one that made the October 26 2023 1W MA50 test. That was also on the 0.618 Fibonacci retracement level from the respective previous Low.
As a result, it is now highly likely to see a rebound, especially if the 1W candle closes above the 1W MA50, to test the previous High and 1.0 Fib at $260, like the December 14 2023 High did.
-------------------------------------------------------------------------------
** Please LIKE 👍, FOLLOW ✅, SHARE 🙌 and COMMENT ✍ if you enjoy this idea! Also share your ideas and charts in the comments section below! This is best way to keep it relevant, support us, keep the content here free and allow the idea to reach as many people as possible. **
-------------------------------------------------------------------------------
💸💸💸💸💸💸
👇 👇 👇 👇 👇 👇
BAC Bank Of America (NAS100) Long Hi guys,
Stock Alert
Bank Of America
Symbol: BAC
🦇Entry: 40.30
⚠️SL: 36.47
✔️TP1:44.33
✔️TP2: 49.68
✔️TP3: 56.44
Happy trading, hope you are earning lots of profit.
Sarah

TTD LONG SET UP (The Trade Desk)Entry 1 $60.50
Entry 2 $45.50
Stop loss $30.50
Take profit 1- $80.50
(Close 25%)
Take profit 2- $100.50
(Close 50%)
Take profit 3-$120.00
(Close 75%)
Take profit 4-$140.00
(Close 100%)

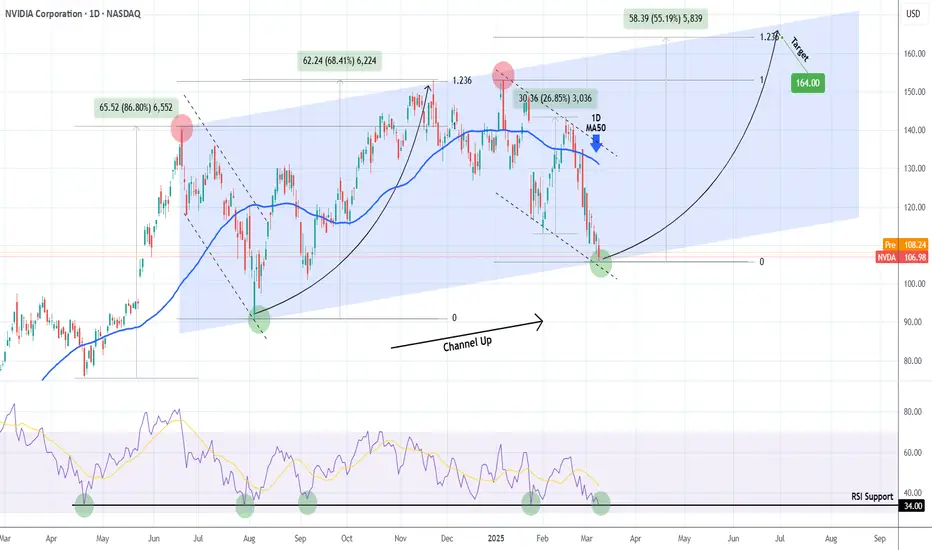
NVIDIA 9-month Channel Up bottomed! Is it a buy??NVIDIA Corporation (NVDA) has been trading within a Channel Up pattern for almost 9 months (since the June 20 2024 High). The correction since the start of January is technically the pattern's Bearish Leg and yesterday it hit the bottom (Higher Low trend-line).
Last time it did so was on August 05 2024 and an instant rebound followed. That was also the time the 1D RSI was on the 34.00 Support, just like today. In fact every time in the past 11 months that this RSI Support was tested, the price rebounded aggressively by at least +26.85%.
Since the previous Higher High rebound peaked on the 1.236 Fibonacci extension, our Target on the medium-term will be $164.00.
-------------------------------------------------------------------------------
** Please LIKE 👍, FOLLOW ✅, SHARE 🙌 and COMMENT ✍ if you enjoy this idea! Also share your ideas and charts in the comments section below! This is best way to keep it relevant, support us, keep the content here free and allow the idea to reach as many people as possible. **
-------------------------------------------------------------------------------
💸💸💸💸💸💸
👇 👇 👇 👇 👇 👇
AMAZON Is it worth buying now?Amazon (AMZN) broke below its 1W MA50 (blue trend-line) last week for the first time since the week of August 05 2024 and opened this week below it. As you can see, the stock has been trading within a 2-year Channel Up and today's candle is as close to a technical Higher Low (bottom) as it can get.
The previous Higher Low was in fact that Aug 05 2024 candle, which despite breaking below the 1W MA50, managed to post a strong intra-week recovery and close above the it. Technically that was the 'Max pain' situation on every 1W bottom candle in those 2 years.
Every Bullish Leg that followed was around +65.24%, so that gives us an end-of-year technical Target of $300.
-------------------------------------------------------------------------------
** Please LIKE 👍, FOLLOW ✅, SHARE 🙌 and COMMENT ✍ if you enjoy this idea! Also share your ideas and charts in the comments section below! This is best way to keep it relevant, support us, keep the content here free and allow the idea to reach as many people as possible. **
-------------------------------------------------------------------------------
💸💸💸💸💸💸
👇 👇 👇 👇 👇 👇

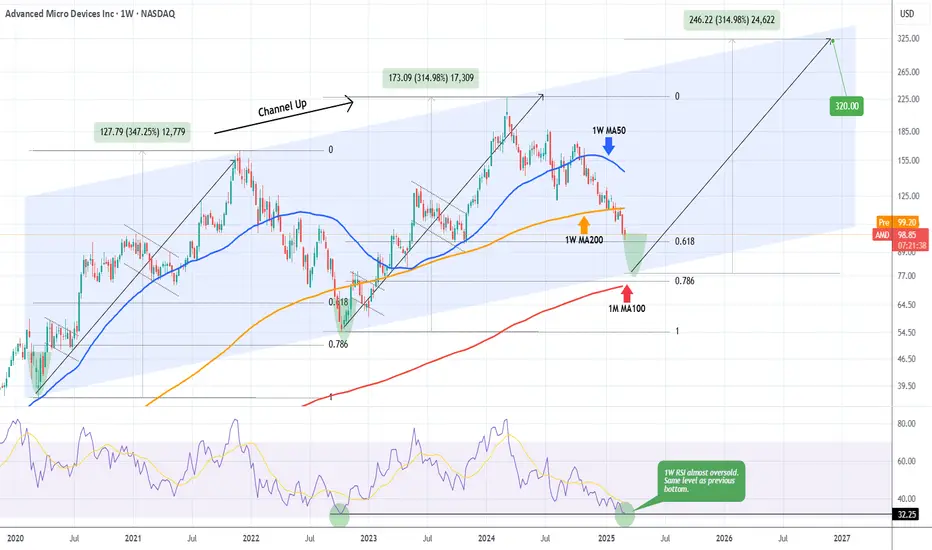
AMD Bottom pricing inside 3 weeks. MASSIVE BUY.Advanced Micro Devices (AMD) have been on a downtrend for exactly 1 year, every since the March 04 2024 Top. That was a technical Higher High on the 5-year Channel Up.
With the price trading below even its 1W MA200 (orange trend-line), there is a massive underlying buy opportunity on the stock for the long-term. That's because this 1-year downtrend is the technical Bearish Leg of this Channel Up, whose previous one bottomed 2 weeks after breaking below the 0.618 Fibonacci retracement level, contained at the same time above the 0.786 Fib.
As you can see, the price is just above the current 0.618 Fib and the 0.786 Fib is just below the Channel Up, where the ultimate macro Support of the 1M MA100 (red trend-line) is headed.
With the 1W RSI almost oversold and on the exact level where the previous Channel Up bottom (October 10 2022) was formed, the stock is technically entering its long-term buy opportunity zone.
Based on this pattern, the R/R is already on excellent levels for a buy and we expect the bottom to be formed within the next 3 weeks. If the new Bullish Leg imitates the previous one and rises by +315%, we can expect AMD to have its next Top at $320.
-------------------------------------------------------------------------------
** Please LIKE 👍, FOLLOW ✅, SHARE 🙌 and COMMENT ✍ if you enjoy this idea! Also share your ideas and charts in the comments section below! This is best way to keep it relevant, support us, keep the content here free and allow the idea to reach as many people as possible. **
-------------------------------------------------------------------------------
💸💸💸💸💸💸
👇 👇 👇 👇 👇 👇
Tempus AI Possible Partner for the Stargate Project in the USAAnalysis of Possible Surge in Tempus AI Stock Due to Project Stargate
Introduction
Tempus AI, Inc. has emerged as a key player in the health technology space, leveraging data science and artificial intelligence (AI) to develop precision medicine solutions. The company's focus on oncology, cardiology, and mental health, combined with its strong data-driven approach, has positioned it as a leader in the emerging field of AI-enabled healthcare. A possible surge in Tempus AI’s stock price is now being speculated, due to its potential involvement in Project Stargate, a new initiative spearheaded by President Donald Trump. Project Stargate promises significant investments and infrastructure development in AI, which could catalyze a favorable growth trajectory for Tempus.
This analysis will explore the potential impact of Project Stargate on Tempus AI, considering both the direct and indirect benefits for the company. Additionally, the mention of prominent political figures like Nancy Pelosi purchasing Tempus stock adds an interesting layer to the speculative nature of this surge.
---
Project Stargate Overview
Project Stargate, as outlined by former President Donald Trump, aims to overhaul AI infrastructure in the U.S. The initiative seeks to foster partnerships between technology firms, including AI-focused companies like OpenAI, and businesses involved in critical infrastructure, such as data centers, power generation, and construction. The project’s goal is to drive advancements in AI technology, with a specific focus on enhancing U.S. competitiveness in this rapidly growing field.
The strategic involvement of multiple high-profile organizations and the federal government indicates that Project Stargate is likely to have wide-reaching economic and technological ramifications. Key elements of the project include:
-Infrastructure Investments: The construction and expansion of AI-driven data centers and related infrastructure.
- Public-Private Partnerships: Strong cooperation between private companies and government entities, facilitating new technologies and business models.
- Technological Advancements: AI solutions that push the boundaries of healthcare, cybersecurity, and national security.
As a result, companies involved in the development and deployment of AI technology, particularly those in healthcare and data analytics, are poised to benefit significantly.
---
Tempus AI’s Position in Project Stargate
Tempus AI operates at the intersection of healthcare and AI, which makes it an intriguing candidate to potentially benefit from Project Stargate. The company’s focus on precision medicine using AI-driven diagnostics aligns well with the ambitions of Project Stargate to expand AI infrastructure.
1. Synergies with Healthcare AI
Project Stargate is expected to fuel demand for AI infrastructure and innovations, particularly in sectors like healthcare. Tempus, which specializes in oncology, cardiology, and depression diagnostics, stands to benefit from both the increased focus on AI-powered healthcare solutions and the additional resources available through government-private sector partnerships.
Given Tempus’s reliance on large-scale data analysis to build its precision medicine solutions, any acceleration in AI infrastructure could lower operational costs for Tempus while improving the capabilities of its platform. Enhanced AI infrastructure would likely lead to faster data processing, increased diagnostic accuracy, and the potential for more personalized treatments.
2. Expansion of Partnerships and Funding
The potential for public-private partnerships, which Project Stargate promotes, could help Tempus secure additional government contracts or private sector collaborations. This influx of capital and resources could enable the company to scale its technology faster and expand into new medical areas beyond its current focus on cancer, cardiology, and mental health.
3. Alignment with National AI Strategy
With AI being a major focus of Project Stargate, Tempus may find itself well-positioned within the broader national AI strategy. If the company becomes a key partner in helping build AI solutions for healthcare or other sectors, it could solidify its reputation as an industry leader, driving up stock demand and valuation.
---
Nancy Pelosi’s Stock Purchase: A Political Angle
The mention of Nancy Pelosi, a prominent U.S. politician, purchasing Tempus AI stock adds a speculative element to the situation. Pelosi’s involvement in the stock could be seen as a potential signal of confidence in Tempus AI’s future performance. Politicians often make investment decisions based on inside knowledge of forthcoming legislation, partnerships, or government contracts.
Though speculation about Pelosi’s investment could generate increased media attention, it should be approached with caution. However, if Pelosi’s investment is tied to a potential announcement of government support or strategic alignment between Tempus and Project Stargate, it could amplify investor confidence and trigger a buying frenzy.
---
Potential Catalysts for Stock Surge
Several factors could drive a surge in Tempus AI’s stock price if Project Stargate moves forward:
-1. Government Contracts and Funding: If Tempus is awarded government contracts under Project Stargate, particularly related to AI infrastructure or healthcare solutions, the company could see a significant increase in revenue and market capitalization.
-2. Partnerships with Major Players: Any announcement of Tempus AI partnering with companies like OpenAI or other stakeholders in Project Stargate would likely signal strong growth potential and increase investor interest.
-3. ncreased Demand for AI Healthcare Solutions**: As the U.S. government prioritizes AI advancements, healthcare applications could see substantial growth. Tempus could be a key beneficiary of this shift, leading to a surge in its stock price as market expectations align with actual developments.
-4. Political Endorsement: If high-profile political figures continue to signal support for Tempus AI, either through public statements or stock purchases, it could bolster public perception and attract institutional investors.
---
Risks and Considerations
While there is substantial upside potential for Tempus AI, there are also risks to consider:
- Dependence on Project Stargate’s Success: Tempus’s growth will be closely tied to the success of Project Stargate and its integration into the broader national AI ecosystem. If the project faces delays or fails to meet expectations, it could have negative implications for companies like Tempus.
- Regulatory Risks: The healthcare industry is heavily regulated, and any change in regulatory policies could impact Tempus’s ability to grow at the expected pace. While AI infrastructure investment may mitigate some challenges, government policies could still create obstacles.
- Market Volatility: The stock market, particularly tech and healthcare stocks, is inherently volatile. Any unforeseen global events or shifts in economic conditions could negatively affect Tempus’s valuation, regardless of Project Stargate.
---
Conclusion
Tempus AI stands at an exciting intersection of AI technology and healthcare, which could see its stock price surge due to its involvement in Project Stargate. The initiative’s focus on building AI infrastructure and fostering partnerships could provide Tempus with opportunities for rapid growth, enhanced funding, and access to cutting-edge technology.
The involvement of high-profile political figures such as Nancy Pelosi adds an additional layer of speculation, with the potential for both public perception and market sentiment to play a significant role in the stock’s trajectory. However, investors should consider the risks associated with regulatory changes, market volatility, and the uncertain success of Project Stargate itself.
Ultimately, if Tempus AI is able to capitalize on these emerging opportunities, it could see a substantial boost in both market visibility and stock price in the near future.
For any questions or remarks kindly react here under the comments
Greetings,
Zila

Googles next Move where to Long next + Wickless Candles Hi in this video I highlight what to look for in the chart to take shorts and where to fill Longs next . In addition to that I provide a small educational idea of looking out for Wickless candles and how they can add value to your analysis . Please like follow share and ask any questions that you have and thankyou for your support

Google Update - Trade this range and new ATH Identified Update video on the google Long that has been planned since early FEB. The level has now been hit and we got a nice reaction off that level . In this video I look into where I think we go next and how price plays out .
In the video I use the following tools TR Pocket FIB , 0.618 FIB , Pivots , Parallel Channel and the Fixed range Vol Profile.
If we stay range bound inside the channel then we have the potential to see a new high on google at the top of the channel in confluence with 1-1 ext + tr pocket expansion .
Watch the video and mark the levels on your chart and ensure to set your alerts .
Dont forget to Boost the chart Please and i welcome any questions TY

UPS SET UP im going long, but this is what can happen
United Parcel Service, Inc. is an American multinational shipping & receiving and supply chain management company founded in 1907 and headquartered in Sandy Springs, Georgia

BROADCOM Is this the buy opportunity of the year?Broadcom Inc. (AVGO) has been trading within a multi-year Channel Up since the October 2022 market bottom and broke last week below its 4H MA200 (orange trend-line). In the past +2 years, every time the 4H MA200 broke, the stock was on its most optimal buy opportunity, as long as the 1W MA50 (red trend-line) held.
In fact, it has been holding since the December 09 2022 break-out so as long as it doesn't break now, AVGO is a low risk - high reward buy opportunity. Actually both in 1W RSI terms as pure price action, the current Low resembles the September 06 2024 one, which started the most recent Bullish Leg.
That sequence initially hit its previous Resistance (previous Higher High) before entering a Re-accumulation phase halfway before the Channel Up top. As a result, we expect to see AVGO hitting at least $250 before the next pull-back that quite possible may target $330.
-------------------------------------------------------------------------------
** Please LIKE 👍, FOLLOW ✅, SHARE 🙌 and COMMENT ✍ if you enjoy this idea! Also share your ideas and charts in the comments section below! This is best way to keep it relevant, support us, keep the content here free and allow the idea to reach as many people as possible. **
-------------------------------------------------------------------------------
💸💸💸💸💸💸
👇 👇 👇 👇 👇 👇

Is NASDAQ Losing Steam? A Reality Check for TradersHey Realistic Traders, Is CAPITALCOM:US100 Out of Steam? Let’s Dive Into the Analysis…
On the daily timeframe, the Nasdaq remains above the EMA-100, which has served as strong support through multiple successful rebounds. Simultaneously, the price has moved above the bullish trendline, reinforcing the ongoing uptrend.
Within wave 4, the price formed a falling wedge pattern, followed by a breakout. This signals the initiation of wave 5, which could potentially extend beyond the length of wave 1, given that wave 3 did not exceed the 1.618 Fibonacci ratio. Meanwhile, the MACD indicator has already formed a bullish crossover, adding further confirmation of a positive outlook for the Nasdaq.
Considering these strong technical signals, the price is likely to move upward toward the first target at 23,538 , or potentially the second target at 24,356.
However, this bullish scenario depends on the price staying above the critical stop-loss level at 20,833.
Support the channel by engaging with the content, using the rocket button, and sharing your opinions in the comments below.
Disclaimer: "Please note that this analysis is solely for educational purposes and should not be considered a recommendation to take a long or short position on Nasdaq."

2 Minute DXYZ Analysis: Key Levels to Watch for the Next MoveWe hit our 34 target on DXY, but what’s next? If we break above 49, we could see a solid bull run. However, if weakness continues, we might test lower levels at 31, then 29, and possibly 23.50 for a deeper correction.
Watching these levels closely—what’s your outlook on DXY? Drop your thoughts below.
Kris/Mindbloome Exchange
Trade Smarter Live Better

Nike (NKE) at a Pivotal Point: Reversal or Further Decline?The weekly chart of Nike (NKE) displays a prolonged downtrend, with price action respecting a descending trendline. A harmonic Bat pattern has formed, with key Fibonacci retracement levels indicating potential reversal zones. The price has recently tested the AB=CD completion zone around $77.17 and $69.90, aligning with historical support.
Technical indicators suggest oversold conditions, as both momentum oscillators (stochastic and RSI) show signs of bullish divergence. A breakout above the trendline and sustained buying pressure could trigger a move towards T1 ($107.99) and T2 ($132.31). However, failure to hold support may lead to further downside continuation.

AMAZON Excellent buy opportunity for a new ATH.Last time we looked at Amazon Inc. (AMZN) was three months ago (November 13 2024, see chart below), giving a pull-back buy signal:
The price action couldn't have followed this more accurately as after a short-term pull-back, the stock hit our $240.00 Target at the end of January.
Since then the price started to pull-back again to a point where this week it broke below its 1D MA50 (blue trend-line) for the first time since September 11 2024. With the 1D RSI on the 40.00 mark, this pull-back resembles the April 25 2024 Low, made near the 0.5 Fibonacci retracement level.
We expect a similar medium-term rebound to start towards the 1.236 Fibonacci extension. Our Target is marginally below it at $252.50.
-------------------------------------------------------------------------------
** Please LIKE 👍, FOLLOW ✅, SHARE 🙌 and COMMENT ✍ if you enjoy this idea! Also share your ideas and charts in the comments section below! This is best way to keep it relevant, support us, keep the content here free and allow the idea to reach as many people as possible. **
-------------------------------------------------------------------------------
💸💸💸💸💸💸
👇 👇 👇 👇 👇 👇

Arista Networks Dips 4% Premarket Despite Strong Q4 FinancialsArista Networks (NASDAQ: NYSE:ANET ) saw a 4% dip in premarket trading despite delivering better-than-expected revenue and earnings in its latest quarterly report. The stock's recent movement raises questions about market sentiment and potential buying opportunities.
Strong Revenue and Earnings Growth
Arista Networks, a leader in cloud networking, reported a fourth-quarter revenue of $1.93 billion, reflecting a 7% year-over-year increase. This beat analyst estimates and demonstrated the company’s ability to sustain growth even amid economic uncertainty.
Net earnings surged to $830.1 million (65 cents per share), compared to $664.3 million (52 cents per share) in the prior year. These strong financials reflect Arista’s continued dominance in the cloud networking industry, particularly as it pushes further into AI-driven initiatives.
Additionally, Arista Networks provided an optimistic forecast for the first quarter of 2024, expecting revenue between $1.93 billion and $1.97 billion, surpassing analysts' expectations. This suggests that despite short-term price volatility, the company’s long-term growth remains intact.
Market Sentiment and Analyst Ratings
Despite the positive earnings report, NYSE:ANET faced early selling pressure. However, analysts remain bullish on the stock, with an average "Buy" rating from 15 analysts. The 12-month price forecast stands at $108.38, representing a slight downside of -3.12% from the latest price, indicating that the market might already be factoring in Arista’s growth potential.
Technical Analysis
From a technical perspective, NYSE:ANET ’s premarket drop of 4.11% has placed its Relative Strength Index (RSI) at 47, signaling that the stock is approaching oversold territory but not yet at extreme levels.
Currently, the stock is trading above key moving averages (MA), suggesting that the broader uptrend remains intact. However, the dip brings NYSE:ANET close to its one-month low, a temporary support level that traders should watch closely. If selling pressure continues, a break below this level could lead to further downside.
That said, this retracement could also be a strategic move to sweep liquidity and attract demand for a potential rebound. Investors should watch for price stabilization and confirmation of renewed buying interest before making any decisive moves.
Conclusion
Despite the early sell-off, Arista Networks’ strong fundamentals, growing revenue, and positive long-term outlook position it as a solid investment choice. The recent dip may be an opportunity for traders to capitalize on a short-term pullback before the stock resumes its upward trajectory. As always, monitoring key technical levels and broader market trends will be crucial in assessing NYSE:ANET ’s next move.

Riding Wave 5: Is $700 Just Around the Corner?Hey Realistic Traders, Will META Bullish Bias Continue ? Let’s Dive In....
In the Daily timeframe, META rebounded above the 38.2% Fibonacci level, marking the completion of wave 4. Within this wave, a Descending broadening wedge pattern was formed. Recently the price has broken out of the pattern. This breakout was further confirmed by a bullish MACD crossover, signaling increasing momentum and strengthening the case for a continued upward move.
Based on these technical signals, I foresee a potential upward movement toward the first target at $638. After reaching this level, a minor pullback is likely before the rally continues toward a new high at $700.
This outlook remains valid as long as the price holds above the stop-loss level at 550.00.
Support the channel by engaging with the content, using the rocket button, and sharing your opinions in the comments below.
Disclaimer: "Please note that this analysis is solely for educational purposes and should not be considered a recommendation to take a long or short position on META.
