Stockssignals


Netflix's Another Bearish AttemptNetflix, Inc. has broken the support trendline channel of September 2019 and closed negatively at $480.67 in a loss of -19.52 ( -3.90% ). We can see price correction up to 61.80% retracement levels.
As per the fundamental research reports, it's totally in an uptrend. And according to technical analysis, NFLX may start a potential reversal from $476 for $506 - $518 - $538+ levels.
According to the secret source, this stock may hit $550 - $570+ prices before October 2020 end.
Entry-point key: Short-term investors can start initiating new positions after the divergence of Stoch RSI.
Please note here is the supply & demand zone based on the support trendline & control price.

Adyen Long, outperfoms the US500 and went up from supportOnes of those stocks that outperfoms markets, every index has a few, about 20/25% actually, this is one from the AEX25 index.
It went up from support, going for 1512 again.


MICROSOFT BREAKOUT LONG|TRADING PLAN|OPTION CHAIN|
The child of Bill Gates has no limits and has been a rocket lately, leaving the pre-covid all time high far behind.
At a closer look, the stock is moving in an upward diagonal channel, and has formed a bullish flag/triangle.
It seems like the Microsoft train is still full of steam, and therefore, our target trade is a long.
TRADING PLAN:
1- one might be going long inside the trading session in the hope of the speedy breakout(not overnight, as the stock might gap down and wipe out your entire deposit as the stop loss orders won't work till the opening of the trading session)
2-one might wait for the confirmed breakout, and then go long after pullback(safe option)
3-one might wanna play this with call options.
The option chain now looks like this:
August 28 expiration:( 3 trading sessions) |September 4 expiration(7 trading sessions+weekend gap) |September 11(12 trading sessions+2 weekend gaps)
strike 1= 220.00=1.03 usd =2.64usd =3,7usd
strike 2=222.5=0,5 usd =1.9usd =2,94usd
The 0,5 usd 3 seession gamble actually looks pretty good.
7 session 2.64 seems like a reliable option, if you believe in the breakout, but the risk reward is lower. One might wanna wait if the price drops a bit, within the triangle and then buy the calls, but you risk missing the breakout.
Thats about it, on Microsoft for today, thank you for reading, like and subscribe and have a nice day!

AWKHello traders, here is the analysis from our team :
buy @ 149
target #1 @ 152
target @ 155
stop @ 136
money management @ 152
Let us know in the comment section below if you have any questions.😉

Triple Top Pattern Has Formed For Broadcom Inc (AVGO)After much V-shape recovery in the technology sector, the price of Broadcom Inc has currently reached a very strong resistance level (triple top pattern). The price is stubborn to break the 332 level. if there is no breakout beyond this point, I believe we should SHORT this stock to the 38% of Fibonacci level.
Key Trading Plan:
SHORT from the current price to the Take Profit Target level of 38% Fibonacci Retracement, 262.00, and then after that, go LONG to the resistance level again as fundamentally the stock still in the bullish trend.
‼️Disclaimer: Please be advised that we are NOT Financial Advisors. We are not responsible for the results of your Forex or CFDs trading. The only person responsible for profits or losses is yourself. You should not consider any market information, educational and analytical material as trading advice that defines your trading actions but purely as educational market material. Please be advised that S.I.D. Capital shall not be liable for any errors in quotes and trading platform software errors.
‼️This Channel and all information is intended for educational purposes only and does not give financial advice. S.I.D. Capital Signals is not a service to provide legal and financial advice; any information provided here is only the personal opinion of the author (not advice or financial advice in any sense, and in the sense of any act, ordinance or law of any country) and must not be used for financial activities.


AAL Positions Grew 8% 🔥 and Still More to Come $28 📈Welcome to Profitlio Trading!
What's up traders! Thanks for Jumping back on my Analysis, 👨💻 Trader champ is here on your Service, Also hit thumbs up 👍 and support the work
Finally the patience has paid off super good. Positions grew 8% and still more to come $28 is the ultimate target. Proof analysis attached below. Sketch up your own trade setup and make sure you meet with the required confirmations first before you make your move!
⭕️ ✅ Scroll Down 👇 ⬇️ to signature section for 📲 contact details 💰💰💰
Profitlio Trading ( Since 2014 in Financial Markets )
________________________________________________
Traders Disclaimer: Non of our analysis or trade setups being shared here on trading view is a trading advice. As we keep on weekly updates with our predictions and expectations. We may take them as a trade only if trade setup meets the required criteria ( Confirmations ). Unless we will never take them as a trade if it never reach our trading requirements.
Take them at your own risk as trading is highly risky and you may loss your investments. Our trades are based on Swinging and Mid to long term approaches. All trades executed will be handled under the name of Profitlio Trading only.

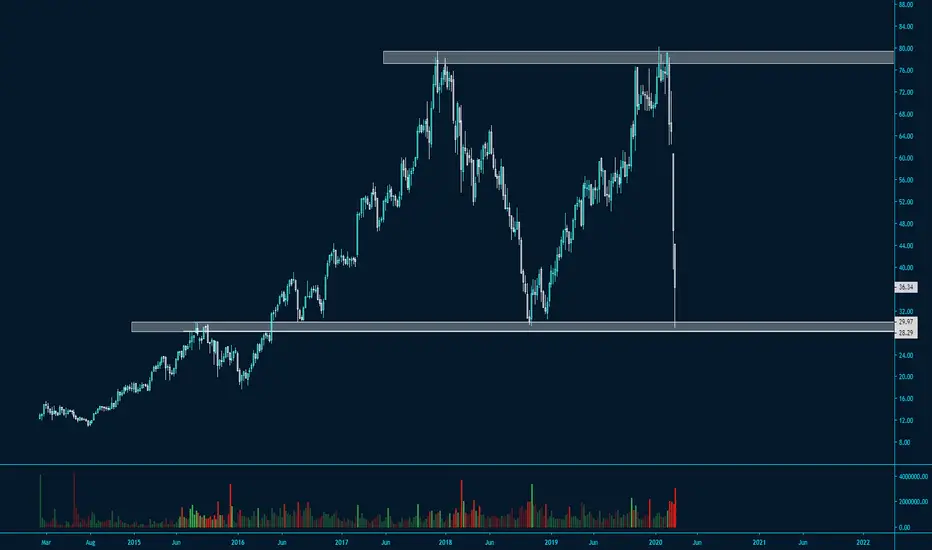
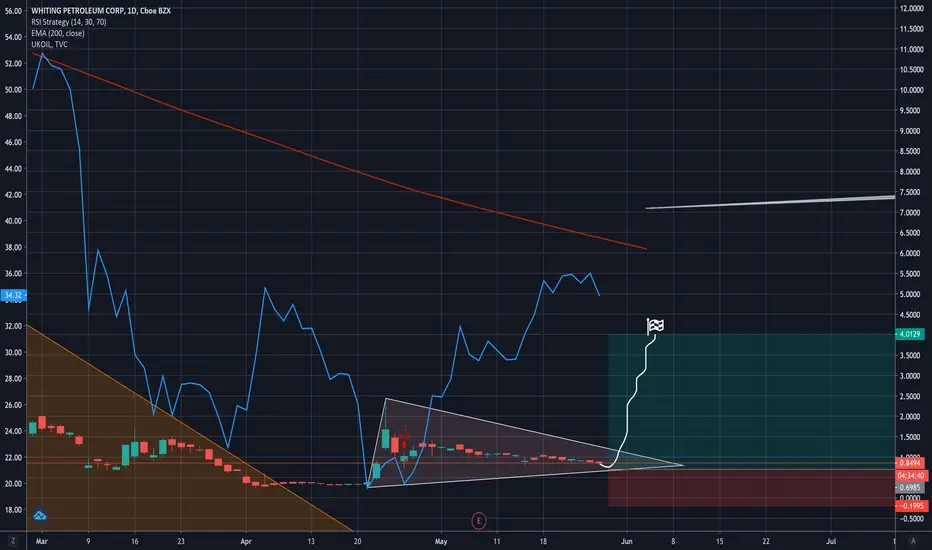
WLLBids set at .70c for a long to $4, I overlaid WTIC on this chart for a reasonable TP. Looks like sometime mid June we can expect this move as long as WTIC doesn't crash.
NETFLIX WILL GO UP FOR THE NEXT DAYSIF you appreciate my analysis subscribe to support me ; There is a high potential NETFLIX will go up . I highly recommand you to keep It in your portfolio .

TESLA INC. - Timeframe: 1H Technical analysisTRENDS
Court terme: STRONGLY BULLISH TECHNICAL INDICATORS: 50% BULLISH / 0% BEARISH / 50% NEUTRAL
MY OPINION: BULLISH ABOVE 800.51 USD
MY TARGETS
862.95 USD (+6.37%)
869.82 USD (+7.21%)
MY ANALYSIS
The bullish trend is currently very strong on TESLA INC.. As long as the price remains above the support at 800.51 USD, you could try to benefit from the boom. The first bullish objective is located at 862.95 USD. The bullish momentum would be boosted by a break in this resistance. Buyers would then use the next resistance located at 869.82 USD as an objective. Crossing it would then enable buyers to target 917.42 USD. Be careful, given the powerful bullish rally underway, excesses could lead to a possible correction in the short term. If this is the case, remember that trading against the trend may be riskier. It would seem more appropriate to wait for a signal indicating reversal of the trend.
FORCE : 7.7/10
Quotes:
The TESLA INC. rating is 811.29 USD. On the day, this instrument gained -0.99% and was traded between 785.00 USD and 824.00 USD over the period. The price is currently at +3.35% from its lowest and -1.54% from its highest.
Technical:
A technical analysis in 1H of this TESLA INC. chart shows a strongly bullish trend. 92.86% of the signals given by moving averages are bullish. The overall trend is supported by the strong bullish signals from short-term moving averages. The Indicators scanner detects a bullish signal on moving averages that could impact this trend.
Numerical data:
The following are the details of the technical indicators and moving averages that were collected to generate this technical analysis:
Technical indicators:
RSI (14): 58.02
MACD (12,26,9): 9.7500
Directional Movement: 2.62
AROON (14): 21.43
DEMA (21): 818.06
Parabolic SAR (0,02-0,02-0,2): 819.55
Elder Ray (13): 3.00
Super Trend (3,10): 781.02
Zig ZAG (10): 817.90
VORTEX (21): 1.0900
Stochastique (14,3,5): 81.60
TEMA (21): 821.64
Williams %R (14): -6.76
Chande Momentum Oscillator (20): 10.03
Repulse (5,40,3): 1.7600
ROCnROLL: 1
TRIX (15,9): 0.2100
Courbe Coppock: 5.70
Moving averages:
MA7: 775.62
MA20: 755.58
MA50: 633.22
MA100: 620.35
MAexp7: 812.49
MAexp20: 804.12
MAexp50: 787.18
MAexp100: 760.04
Price / MA7: +4.60%
Price / MA20: +7.37%
Price / MA50: +28.12%
Price / MA100: +30.78%
Price / MAexp7: -0.15%
Price / MAexp20: +0.89%
Price / MAexp50: +3.06%
Price / MAexp100: +6.74%

Shortening $GE at a Target of $9.13First off, please don't take anything I say seriously or as financial advice. That being said, let me get into a few key points. GE also has GE Healthcare systems which has its Ventilator solutions as well as virtual care and telemedicine (amongst other things). This is why I don't think GE is going to have as bad of a quarter as other corporations during the Covid19 period. It also doesn't have another earnings call until July 29th, giving others a chance to be bullish. I expect at least a $9.13 price target to be reasonable for a short sell. It also may have higher then 34%+ as a long call potential, but it is still too early to call given GE's mostly bearish history in the recent years.


Walt Disney Company (DIS) - Opportunity to SELLHey everyone, here's the analysis on DIS. Hit the LIKE button, follow us & leave a comment on ideas you would like to see next!
Summary:
Current price could drop from our R1 zone to our S1 zone, presenting us with a good opportunity to sell.
Action:
Sell Limit: 109.65 - 112.00
Stop Loss: 123.00
Take Profit: 96.40
Analysis:
On the monthly chart, R1 zone was a key breakout zone along with a strong fibonacci confluence and a pullback of our trend line. There is limited upside in the current price and it could drop to our S1 zone, as illustrated by the yellow dotted lines. If the S1 zone does not hold, we could see price drop lower to our S2 zone before a bounce there.
Disclaimer: There is a very high degree of risk involved in trading and investing. Past results are not indicative of future returns. Trading BEAN and all individuals affiliated with this site assume no responsibilities for your trading and investment results. All contents featured here are solely for educational purposes and ARE NOT investment or trading advices. Please do your own due diligence and trade at your own risk.


$HTHT Support$HTHT (Huazhu Group LTD) Area of confluence between horizontal support and EMA 200. Weekly chart.


WTI has completed a bearish pennant - Retesting higher levelsFor the fourth week in a row, last week oil fell.
Technically, WTI has completed a bearish pennant. That pattern is normally followed by an upward correction which, in this case, means it could retest the $30 level.
I recommend you to go bull to 29-30$ levels during this week.