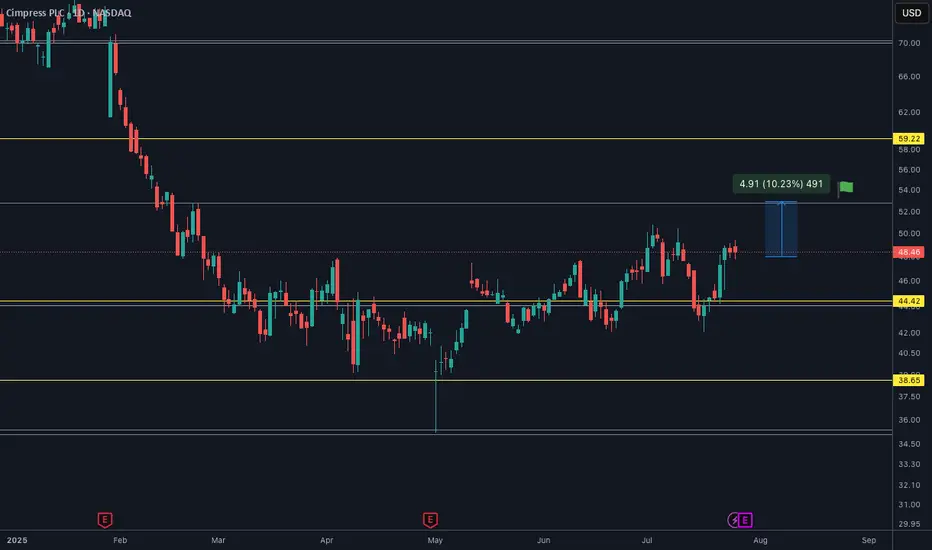
CMPR is ready for $53It will soon go to $53 I assume. Only question is quarterly releasing on 29th of July so in case things go wrong below $44 is not wanted.
Stockstobuy
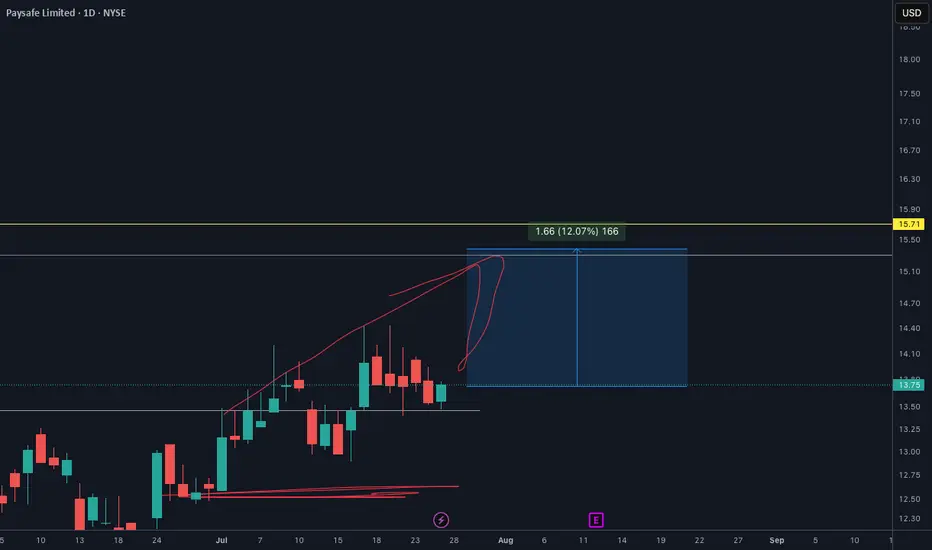
PSFE will EXPLODE soon. Make sure you check out my analysisPSFE price target is definetly $15.30. And It will happen so soon I see.
I shared this one on my youtube channel and X as well. You make sure go to my profile and follow for more.
RF 1D: Breakout or Just a Bullish Pause?Regions Financial (ticker: RF) finally escaped the descending channel it had been stuck in for nearly 8 months — like someone who missed their stop and woke up in a different state. The breakout came with volume and a hold above the 50-day MA, which technically gives the bulls a reason to stretch their legs — cautiously.
The price has already cleared the 0.618 Fibonacci level (~21.66), and is now pushing toward the 0.5 zone (~22.87). If momentum holds, the next key area is target 1 around 24.00–24.50. Beyond that — and this is where things get ambitious — we have target 2 in the 27.50–28.50 range, which aligns with pre-breakdown resistance from late 2024.
RSI is climbing into overbought territory but still confirms the breakout rather than warning of a top — at least for now.
On the macro side: U.S. regional banks have had a rough ride in early 2025, but RF has held up better than many peers. The recent earnings beat and visible uptick in volume suggest growing institutional interest. If bond yields keep cooling and risk appetite returns to the value sector, RF could remain in favor.
That said, bulls need to see a confirmed hold above 22.80. Otherwise, this could end up as another failed retest — and bears are always lurking just outside the channel.

AMD 1W: If Not Now — Then When?The weekly chart of AMD looks like it’s holding its breath: a well-defined falling wedge, double bottom support, and price pressing right against long-term trendline resistance. Everything’s in place — now it just needs to break and run, preferably without tripping over nearby Fibonacci levels.
The stock is trading around $114 and attempting to hold above the 50-week MA. Just ahead is the 200-week MA (~131) — not only a technical hurdle but also a psychological pivot. A move above it could reignite talk of $150+ targets.
The wedge has been narrowing since late 2024. After repeated bounces off support, price has returned to the top of the pattern. A confirmed weekly close above the wedge could trigger a real breakout. Without that — it risks yet another scripted pullback.
Key Fibonacci levels:
0.618 — $133.60
0.5 — $151.42
0.382 — $169.25
0.236 — $191.30
0.0 — $226.95 (all-time high)
The roadmap looks clean — but only if volume follows through. There are signs of quiet accumulation at the bottom, but no explosive buying just yet.
Fundamentals:
AMD delivered solid Q1 results: revenue is growing, EPS beat expectations, and margins are holding. More importantly, the company launched a new $6 billion stock buyback program — showing clear internal confidence in its long-term trajectory.
There’s also a strategic AI partnership underway with a Middle Eastern tech group. This move positions AMD to challenge not just for GPU market share, but for future AI infrastructure dominance — long game stuff.
Analyst sentiment has turned bullish again, with new price targets in the $130–150 range. All of this makes the current chart structure more than just technical noise — it’s backed by strong tailwinds.

GRAB 1W: Two Years of Silence — One Loud BreakoutGRAB 1W: When stocks go quiet for two years just to slap bears across both cheeks
The weekly chart of GRAB shows a textbook long-term accumulation. After spending nearly two years in a range between $2.88 and $4.64, the price is finally compressing into a symmetrical triangle. We’ve already seen a breakout of the descending trendline, a bullish retest, and the golden cross between MA50 and MA200. Volume is rising, and the visible profile shows clear demand with little resistance overhead.
The $4.31–$4.64 zone is key. Holding this level opens the path to $5.73 (1.0 Fibo), $6.51 (1.272), and $7.50 (1.618). The structure is clean, momentum is building, and this accumulation doesn’t smell like retail — it smells institutional.
Fundamentally, GRAB is a leading Southeast Asian tech platform combining ride-hailing, delivery, fintech, and financial services. Yes, it’s still unprofitable (–$485M net loss in 2024), but revenue is growing fast, recently crossing $2.3B. Adjusted EBITDA has been improving steadily, and the company holds $5.5B in cash equivalents with minimal debt — giving it excellent liquidity and expansion flexibility.
Valued at ~$18B, GRAB operates in the world’s fastest-growing digital market, with increasing institutional exposure from players like SoftBank and BlackRock. The 2-year base hints at smart money preparing for the next big move.
Tactical plan:
— Entry: by market
— Targets: $5.73 → $6.51 → $7.50
— Stop: below $4.00 or trendline
If a stock sleeps for 2 years and forms a golden cross — it’s not snoring, it’s preparing for liftoff. The only thing left? Don’t blink when it moves.

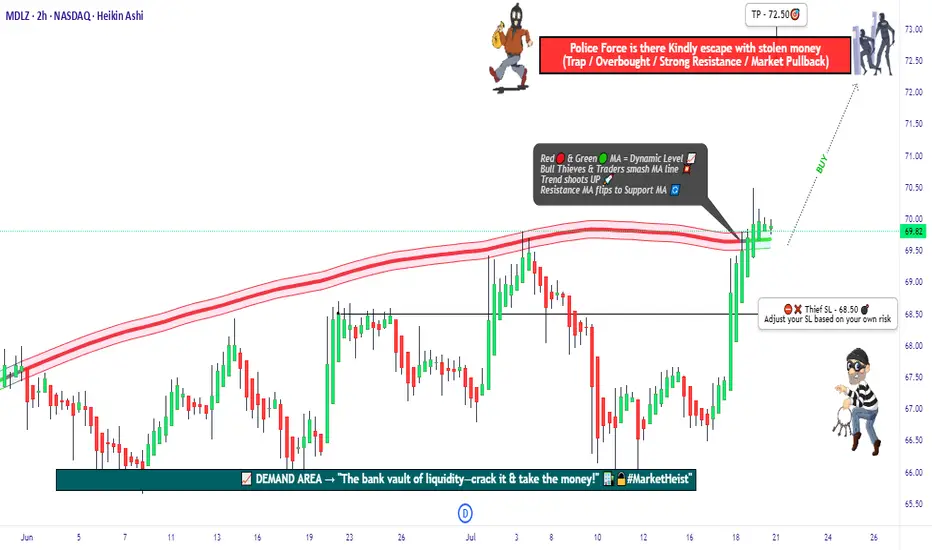
"MDLZ Heist LIVE! Quick Profit Grab Before Reversal!"🚨 MONDELEZ HEIST ALERT: Bullish Loot Zone! (Swing/Day Trade Plan) 🚨
Thief Trading Strategy | High-Risk, High-Reward Play
🌟 Greetings, Market Pirates! 🌟
Hola! Oi! Bonjour! Hallo! Marhaba!
To all Money Makers & Strategic Robbers 🤑💸—this is your blueprint to plunder "MONDELEZ INTERNATIONAL, INC" with precision.
🔎 THIEF TRADING ANALYSIS (Technical + Fundamental)
The Vault is Open! Bullish momentum detected, but caution—this is a high-risk police barricade zone (resistance level).
Overbought? Consolidation? Reversal? Yes. Bears lurk here, but we’re stealing profits before the trap snaps.
🎯 Target: 72.50 (or escape earlier if momentum fades).
🚨 Scalpers: Long-only! Use trailing stops to protect gains.
📈 ENTRY: How to Swipe the Loot
"Buy the Dip" Strategy: Optimal entries on pullbacks (15m/30m timeframe).
DCA/Layering Tactics: Spread limit orders for better risk control.
Aggressive Robbers: Enter now. Patient Thieves: Wait for retests.
🛑 STOP LOSS: Survival Rules
SL at 68.50 (nearest swing low wick on 2H chart).
Adjust based on risk/lot size—protect your capital!
⚡ CRITICAL ALERTS
📰 News Volatility: Avoid new trades during major releases. Lock profits with trailing stops!
📊 Fundamental Drivers: Check COT reports, macro trends, and sector sentiment Klick the 🔗.
⚠️ Reminder: This is NOT financial advice. DYOR and manage risk!
💥 BOOST THE HEIST!
Like 👍 + Boost 🔄 to fuel our next market robbery plan. Together, we trade smarter, steal bigger, and profit faster!
🚀 Stay tuned—more heists coming soon! 🤑🔥
JUPITER WAGONS - UPTREND JUPITER WAGONS - BUY
Trade Reason :
Weekly says - Good uptrend (Higher Low) and Strong Support Level.
Market Trend Reversed - Wait for Little bit correction are Retest .
Entry - 507 Rs or Entry Now
Target - 688 Rs
Stoploss - 415 Rs
Happy Trading ...

GRMOVER - UPTREND BUY Stock Name - GRM Overseas
Trade Setup :
Weekly - Uptrend & Fibonacci Golden ration activated .
Day - Uptrend Continue
Suggestion :
Wait for Retest Or Retracement ..
Entry - 205 Rs
Stoploss - 176 Rs
Target - 264 Rs
Expected - 28 % Return ...
Happy Trading - Thank you ..

SOUTHBANK - BUY SOUTHBANK - BUY NOW
Key points :
South Indian Bank strong Fundamentals .
Stock PE - 5.47
Industry PE - 10.8
Stock Price Trade at Below Book Value ..
Company Price - Possible to Double
Technical :
Monthly - Take Support
Day - Symmetrical Triangle Pattern Breakout
Entry - 25.45 Rs
Target - 35.55 Rs
Stoploss - 21 Rs
Expected - 39 %
This is Only for My Trade Setup . Dont follow Blindly . Take Educational Purpose Only .
We not any responsiblities for Profit and loss ..
Thank You . Happy Trading ..

EDELWEISSAfter a strong uptrend , Price consolidated near the resistance forming a tight closing base
Price is breaking out of the range.

SMCI: When a chart says it’s time to reconnect with the AI hypeOn the daily chart, Super Micro Computer Inc. (SMCI) is showing a clean bullish setup. Price broke out of a descending trendline (green dashed), confirmed it with a retest, and is now consolidating above the breakout zone. The golden cross — where the MA50 crossed above the MA200 — confirms a long-term trend reversal.
Volume profile indicates strong accumulation near $41–43. The 0.5 Fibonacci level at $41.84 acted as support. Above the current range, there’s low volume resistance up to $63.57 (0.786), followed by $66.44 and a final extension target at $79.82 (1.272).
Fundamentals: SMCI is a leading server hardware manufacturer. Demand for their systems has soared with the explosion of AI infrastructure. The company maintains solid financials, with rising quarterly revenue and growing presence in the cloud sector. Institutional investors have been actively increasing their positions since late 2023 — a sign of strong long-term conviction.
Tactical plan:
— Entry: market $42–43
— Target 1: $55.91
— Target 2: $63.57
When technicals scream textbook breakout and fundamentals bring AI momentum to the table — it might just be one of the best late entries in the AI wave this summer.

Is it right time and choice to buy UNH Stock - {15/07/2025}Educational Analysis says that UNH Stock (USA) may give trend Trading opportunities from this range, according to my technical analysis.
Broker - NA
So, my analysis is based on a top-down approach from weekly to trend range to internal trend range.
So my analysis comprises of two structures: 1) Break of structure on weekly range and 2) Trading Range to fill the remaining fair value gap
Let's see what this Stock brings to the table for us in the future.
Please check the comment section to see how this turned out.
DISCLAIMER:-
This is not an entry signal. THIS IS FOR EDUCATIONAL PURPOSES ONLY.
I HAVE NO CONCERNS WITH YOUR PROFIT OR LOSS,
Happy Trading.

RGTI Heading to $17+ Good evening trading family
So currently due to price action it appears we are on our way to 17 dollar target however we expect a little bit of a correction at the 15 range.
However worst scenario if we go below 11 dollars be prepared for a sinker down to 8.
Trade Smarter Live Better
Kris/ Mindbloome Exchange

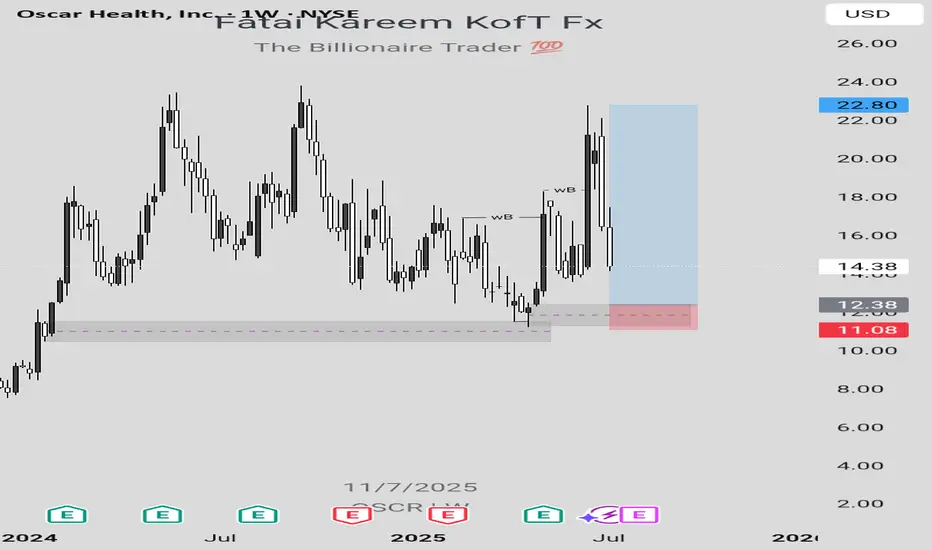
OSCR LONG IDEALooking at the weekly chart of OSCR stock, there's a long opportunity which can be taken advantage of to make some money provided that market follows the projection.
In order to take advantage of this long opportunity, a buy order limit can be placed at $12.38 while the exit can be at $11.09 and the final target can be at $22.80.
Confluences for this long idea are as follows:
1. Weekly break of structure
2. Valid Inducement (structural liquidity)
3. Orderflow
4. Sweep
5. Valid demand zone in the discount level
6. Imbalance
7. Pattern confirmation formed after mitigation of a demand zone indicating that there's a bullish change of trend.
Disclaimer: This is not a financial advice. The outcome maybe different from the projection. Don't take the signal if you're not willing to accept the risk.
NVDA Analysis To 164?Quick breakdown of NVDA
Appears we hit our corrected level, we could go deeper possibly or hold at this level and drive up to 164
This is looking like a nice little setup long indeed
Trade Smarter Live Better
Kris/Mindbloome Exchange

MSFT Correction then to 504?Morning everyone
Currently we are seeing a possible correction to the 495 zone with a possible break to the upside to 504 is what we are currently seeing.
Trade Smarter Live Better
Kris/Mindbloome Exchange

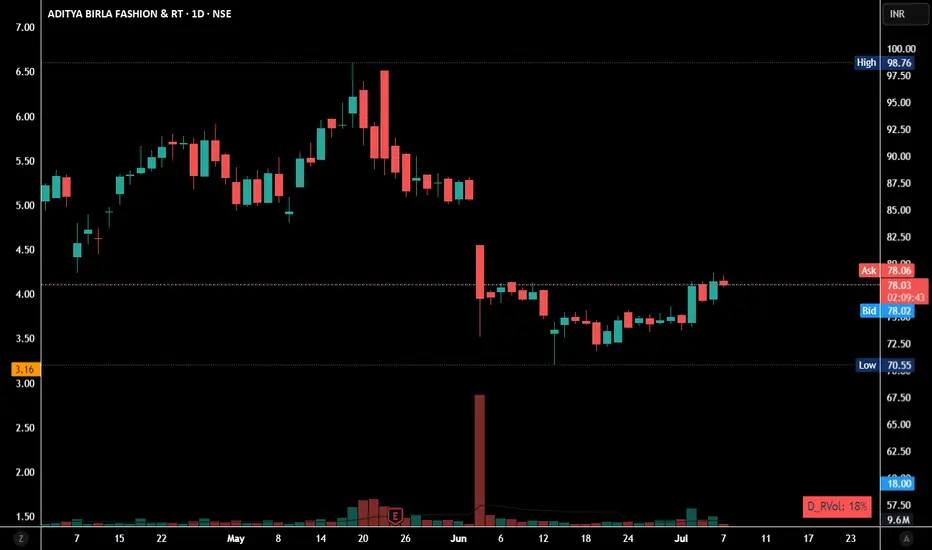
Rising Institutional Buying
Rising Institutional buying has been seen in this stock. This quarter is full of their accumulation it seems. It'll be interesting to see whether it holds 80-90 level.
Chart is for educational purpose, not a Buy/Sell Reco.
RSKD - breakout confirmed, now waiting for retestRiskified (RSKD) shows a textbook breakout setup: daily triangle plus 4H bullish flag. Price already broke out and is now retesting the 0.618 Fibonacci retracement at $5.21, which also matches the flag resistance flip and EMA cluster. This is a clean buy zone with strong technical alignment.
Volume spiked during the breakout, trend structure remains intact, and moving averages are converging — usually a precursor to strong moves. The current pullback is orderly, and if buyers show strength on this retest, the price could target $6.00, then $6.54, and potentially $7.25 (1.618 extension).
Fundamentally, Riskified offers fraud prevention tech for e-commerce. The business is benefiting from global growth in online transactions and improved margin control. While still unprofitable, recent quarters showed progress toward positive operating leverage and strong client acquisition.
Tactical plan:
— Entry on confirmation from $5.21 retest
— TP1: $6.00
— TP2: $6.54
— TP3: $7.25
— SL: below $4.90 or $4.43 support zone
You’ve been watching this one. The triangle broke. The pullback is clean. Maybe it’s time to stop watching and start participating.

Kalyan Jewellers is going to touch the target soon.kalyan jewellers stock is on bullish structure now and our next target is marked with green line ,just waiting for the target.

AAPL Poised for Continued GrowthIf you haven`t bought AAPL before the rally:
What to consider now:
1. AI-Driven iPhone Upgrade CycleApple’s integration of Apple Intelligence, its proprietary AI platform, is set to catalyze a significant iPhone replacement cycle. Posts on X highlight positive sentiment around AI-driven demand, with estimates suggesting a 40% year-over-year surge in iPhone shipments in China during May 2024, signaling strong consumer interest. New AI features, such as on-device processing for enhanced privacy and functionality, are expected to drive accelerated hardware upgrades. Analysts, including Bernstein, project these features could boost upgrade rates, with even a 1% increase in upgrades driving meaningful revenue growth. With the iPhone 15 and future iterations leveraging AI, Apple is likely to capture pent-up demand, as noted by industry observers who see long-term revenue growth from its 7% year-over-year increase in active installed base.
2. Strong Ecosystem and Services GrowthApple’s ecosystem—spanning iPhones, iPads, Macs, and wearables—continues to drive customer loyalty and recurring revenue. The company reported record services growth in Q2 2025, with revenue reaching $95.4 billion, up 5% year-over-year. Services like Apple Music, iCloud, and Apple TV+ benefit from the growing active device base, which ensures sticky, high-margin revenue streams. This ecosystem strength mitigates concerns about short-term iPhone sales fluctuations, as Apple captures upgrade revenue over time. The seamless integration of hardware and services creates a moat that competitors struggle to replicate, reinforcing AAPL’s long-term growth potential.
3. Technical Bullish MomentumFrom a technical perspective, AAPL exhibits strong bullish patterns across multiple timeframes. TradingView analyses point to a rising bullish channel, with higher highs and higher lows signaling sustained upward momentum. Key bullish patterns, such as an ascending wedge and triangle, are forming around current price levels, suggesting potential breakouts. For instance, if AAPL clears $203.21 with volume, it could target $204.98 or higher, with some analyses eyeing $240 as a near-term resistance. Technical indicators like a rising RSI and MACD convergence further support short-term bullish momentum. Despite recent consolidation, reduced volatility and a strong setup pattern indicate AAPL is primed for a breakout.
4. Analyst Optimism and Market SentimentAnalyst sentiment remains overwhelmingly positive, with a consensus “Buy” rating and a 12-month price target of $228.85, implying a 14.05% upside from the current price of $200.66 as of June 2025. Hedge funds like Third Point see “significant” upside, driven by AI features that could meaningfully boost earnings. Bernstein’s raised price target to $240 reflects confidence in Apple’s ability to monetize AI through hardware and services. Posts on X also highlight investor optimism, with AAPL’s $350 billion market cap increase in a single day underscoring strong market confidence in its AI-driven growth chapter.
5. Global Expansion and Emerging MarketsApple’s growth in emerging markets, particularly India and China, bolsters its bullish case. Improved guidance for December 2023, driven by iPhone 15 adoption and India’s market potential, signals untapped opportunities. Apple’s ability to penetrate these high-growth regions, combined with its premium brand appeal, positions it to capture a larger share of global smartphone and tech markets.
Disclosure: I am part of Trade Nation's Influencer program and receive a monthly fee for using their TradingView charts in my analysis.

Sklz 7.55-8.09 new floor ?!Big volume, i think july 18 calls are micely valued for 7$
Based on chart purely, i think the set up is there for the move north.
Big volume spike on 4hr looking like a nice green week. SKLZ ANS PARADISE TO THE MOON. 10$ by december
Not financial advice but i think its a nice price.

#FORTIS Today this stock brooked ATH level with strong volume. Through It can be predicted here that this will be a good investment option for the short term and long term.
CMP - 790
Key level:-
1) triangle pattern breakout
2) high volume
3) stock sustaining previous high
4) retest like formation

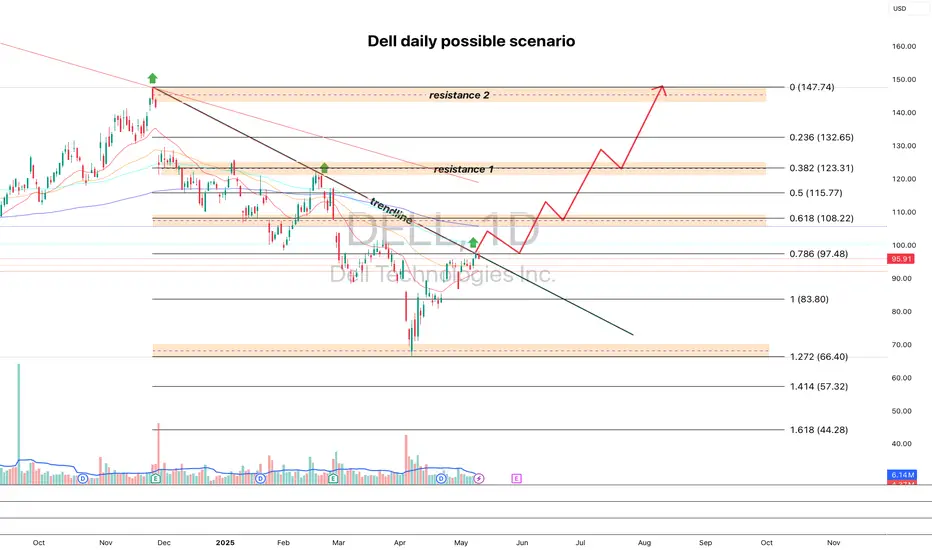
DELL looks good for pump dailyI'm watching DELL for a breakout of the trendline and a cross above the 100 MA — targeting a move toward 108.22, followed by a retest of the breakout and further upside targets at 123.31 and 147.74.
Fundamentally, the company looks strong, and the next earnings report is expected on May 29.
If you like the analysis, hit that rocket 🚀