Intel Corporation | INTCIntel reported second quarter earnings on Thursday, showing a return to profitability after two straight quarters of losses and issuing a stronger-than-expected forecast. the stock rose 7% in extended trading.
Here’s how Intel did versus Refinitiv consensus expectations for the quarter ended July 1:
Earnings per share: 13 cents, adjusted, versus a loss of 3 cents expected by Refinitiv.
Revenue: $12.9 billion, versus $12.13 billion expected by Refinitiv.
For the third quarter, Intel expects earnings of 20 cents per share, adjusted, on revenue of $13.4 billion at the midpoint, versus analyst expectations of 16 cents per share on $13.23 billion in sales.
Intel posted net income of $1.5 billion, or 35 cents per share, versus a net loss of $454 million, or a loss of 11 cents per share, in the same quarter last year.
Revenue fell 15% to $12.9 billion from $15.3 billion a year ago, marking the sixth consecutive quarter of declining sales.
Intel CEO Pat Gelsinger said on a call with analysts the company still sees “persistent weakness” in all segments of its business through year-end, and that server chip sales won’t recover until the fourth quarter. He also said that cloud companies were focusing more on securing graphics processors for artificial intelligence instead of Intel’s central processors.
David Zinsner, Intel’s finance chief, said in a statement that part of the reason the report was stronger than expected was because of the progress the company has made toward slashing $3 billion in costs this year. Earlier this year, Intel slashed its dividend and announced plans to save $10 billion per year by 2025, including through layoffs.
“We have now exited nine lines of business since Gelsinger rejoined the company, with a combined annual savings of more than $1.7 billion,” said Zinsner.
Revenue in Intel’s Client Computing group, which includes the company’s laptop and desktop processor shipments, fell 12% to $6.8 billion. The overall PC market has been slumping for over a year. Intel’s server chip division, which is reported as Data Center and AI, saw sales decline 15% to $4 billion plus Intel’s Network and Edge division, which sells networking products for telecommunications, recorded a 38% decline in revenue to $1.4 billion.moreover Mobileye, a publicly traded Intel subsidiary focusing on self-driving cars, saw sales slip 1% on an annual basis to $454 million and Intel Foundry Services, the business that makes chips for other companies, reported $232 million in revenue.
Intel’s gross margin was nearly 40% on an adjusted basis, topping the company’s previous forecast of 37.5%. Investors want to see gross margins expand even as the company invests heavily in manufacturing capability.
In the first quarter, the company posted its largest loss ever as the PC and server markets slumped and demand declined for its central processors. Intel’s results on Thursday beat the forecast that management gave for the second quarter at the time.
Intel management has said the turnaround will take time and that the company is aiming to match TSMC’s chip-manufacturing prowess by 2026, which would enable it to bid to make the most advanced mobile processors for other companies, a strategy the company calls “five nodes in four years.” Intel said on Thursday that it remained on track to hit those goals.
Nvidia has had an amazing run, but any emerging technology, such as AI, which is bottlenecked by a single company will have issues in growth. Consulting firm McKinsey has pegged the AI market to be worth $1 trillion by 2030, but also that it was in an experimental and in early phases of commercial deployment.
While Nvidia will likely retain its leadership in GPU hardware as applied to AI for the foreseeable future, it is likely that other hardware solutions for AI systems will also be successful as AI matures. While technologist may quibble on specifics, all major AI hardware today are based on GPU architectures, and as such I will use the terms and concepts of AI hardware and GPU architecture somewhat interchangeably.
One likely candidate for AI related growth may be AMD (AMD), which has had GPU products since acquiring ATI in 2006.However, unlike Nvidia, which had a clear vision for of general-purpose GPU products (GPGPU), historically, AMD had largely kept its focus on the traditional gaming applications. AMD has developed an AI architecture called XDNA, and an AI accelerator called Alveo and announced its MI300, an integrated chip with GPU acceleration for high-performance computing and machine learning. How AMD can and may evolve in the AI may be subject of a different article.
Another contender for success in the AI applications using GPU is Intel, who is the focus of this article. Intel has maintained a consistent, if low key focus on GPU hardware focused on AI applications over the last decade. Intel’s integrated HD Graphics is built into most modern processor ICs; however, these are insufficient compared to dedicated GPUs for high-end inferencing or machine learning tasks.
It has 2 primary GPU architectures in production release:
In 2019 Intel Corporation acquired Habana Labs, an Israel-based developer of programmable deep learning accelerators for the data center for approximately $2 billion. Habana Labs’ Gaudi AI product line from its inception focused on AI deep learning processor technologies, rather than as GPU that has been extended to AI applications. As a result, Gaudi microarchitecture was designed from the start for the acceleration of training and inferencing. In 2022 Intel announced Gaudi2 and Greco processors for AI deep learning applications, implemented in 7-nanometer (TSMC) technology and manufactured on Habana’s high-efficiency architecture. Habana Labs benchmarked Gaudi2’s training throughput performance for the ResNet-50 computer vision model and the BERT natural language processing model delivering twice the training throughput over the Nvidia high end A100-80GB GPU. So, Gaudi appears to give Intel a competitive chip for AI applications.
Concurrent with the Habana Labs’ Gaudi development, Intel has internally developed the Xe GPU family, as dedicated graphics card to address high-end inferencing or machine learning tasks as well as more traditional high-end gaming. Iris® Xe GPU family consists of a series of microarchitectures, ranging from integrated/low power (Xe-LP) to enthusiast/high performance gaming (Xe-HPG), data center/AI (Xe-HP) and high-performance computing (Xe-HPC). The architecture has been commercialized in Intel® Data Center GPU Flex Series (formerly codenamed Arctic Sound) and Intel® Arc GPU cards. There is some question on Xe GPU future and evolution. Intel has shown less commitment to the traditional GPU space compared to Gaudi. Nonetheless, it does demonstrate Intel ability to design and field complex GPU products as its business requires.
Intel has many other AI projects underway. The Sapphire Rapids chips implements AI specific acceleration blocks including technology called AMX (Advanced Matrix Extensions), which provides acceleration inside the CPU for efficient matrix multiplications used in on-chip inferencing and machine learning processing by speeding up data movement and compression. Intel has supporting technologies such as Optane, which while cancelled as a production line, is available for their needs of a high-performance non-volatile memory, one of the intrinsic components in any AI product.
Based on the above, Intel appears to have competitive hardware solutions, however if we look at Nvidia success in AI, it is a result of a much a software and systems focus as it is the GPGPU hardware itself. Can Intel compete on that front. Ignoring for the moment that Intel has a huge software engineer (approx. 15,000) resource, it also has- access to one of the leading success stories in perhaps the most competitive AI application – self driving cars.
Mobileye, who was acquired by Intel in 2017, has been an early adopter and leader, with over 20 years of experience in automotive automated driving and vision systems. As such, Mobileye has a deep resource of AI domain information that should be relevant to many applications. Mobileye has announced that it is working closely with Habana, as related divisions within Intel. While Intel is in the process of re-spinning out Mobileye as public company, Mobileye Global Inc. (MBLY), at present Intel still owns over 95% of shares, keeping it effectively an Intel division.
In looking at Intel, we have a company with the history, resources, and technology to compete with Nvidia and infrastructure. They have made significant investment and commitment to the emerging AI market, in times when they have exited other profitable businesses. It should also be understood that AI related product are a small percentage of overall Intel revenues (INTC revenue are more than twice NVDA, even if NVDA has 6x its market cap), and continues to keep its primary business focus on its processor and foundry business.
Hopefully for shareholders, Intel continues to push their AI technology and business efforts. Their current position is that this is strategic, but Intel is in a very fluid time and priorities may change based on business, finances, and of course the general interest and enthusiasm for AI. It is always worth noting that AI as a technical concept is mature, and appears to be cyclical, with interest in the technical community rising and falling in hype and interest once every decade or so. I remember working on AI applications, at the time labeled as expert systems in the 1980s. If we are currently at a high hype point, this may be temporary, based on near term success and disappointment in what AI does achieve. Of course, as always, “this time is different” and the building blocks of effective AI systems currently exist, where for previous iterations, it was more speculative.
Stockstobuy

#SRF Trading Zone & predictions 5 may 2025 1st ragistance 3033
2nd ragistanc 3123
1st support 2780
2nd suport 2618
OI Deta Base trade Negetive
RSi Base Negetive
Praise Action base negetive Retresment move fib level 0.5 to 0.618
mor all detail in chart pls chek it chart

Bitcoin (BITX) getting ready for a parabolic move? Here is a chart of probably my favorite swing trade for the year.
I am keeping it simple with this chart though. I am a firm believer in simple when it comes to trading. I think the previous descension and breakout is playing out very similarly to the current one. Both had a double top rejecting from their respective trendlines following the initial breaks of structure. BITX is currently making its second tap of the the trendline. If it plays out like the previous structure did that would suggest w could see one more low in store.
I don't believe this to be the case but if it is this run could be postponed until the end summer/beginning of fall. I think it is more important to point out the relative strength in Bitcoin as of late, the weakness in the US dollar, as well as global liquidity having broke out months ago.
I think the most likely scenario is a pullback from this point which will be followed by a higher low printing. I will say I also expect this pullback to be steeper than the one from the previous descension. Bitcoin and Indices are a lot more overextended than they were last time around and the structure in indices is a lot weaker than before.
All this being said I am expecting a breakout to occur over the next several weeks just based off probabilities. It all depends on if BTC and indices and hold their respective demand/support levels. Bitcoin needs to hold 85k in order for a summer breakout to occur. For the S&P equivalent level this could be somewhere around 5200-5300.
If these assets are not able to hold these levels my confidence will shift pretty dramatically. I would still expect a major rally to take place around the Q4 timeframe but I would be expecting a lot less upside. Price would likely have to chop around for a while before deciding if it wants to continue to the upside. I am basing this off market structure/Dow theory. It is important to take all possibilities into account and ultimately let the charts do the talking.

MCHP Breakout to 64 if we stay above 48Looks like a great break out trade for 4 bucks possibly more if your interested. MCHP looks like its driving up
Kris/Mindbloome Exchange
Trade Smarter Live Better

BBTC BUY NOW BBTC - BOMBAT BURMAH TRADING COMPANY
STRONG FUNDAMENTAL STOCK
See Technical View
Monthly - Higher Low
Day - Trend Reversed
Entry - 1829 Rs
StopLoss - 1586 Rs
Target - 2867 Rs
Expected Return - 56 %
Thank You .. Happy Trading

Quantum's Walmart (WMT) Trading Guide 4/28/25WMT’s weekly outlook balances its defensive resilience against macroeconomic headwinds, with a comprehensive synthesis of technical, market, and strategic factors guiding its trajectory for weekly options contracts. The FAME framework underscores WMT’s long-term bullish potential, driven by robust fundamentals (+5% revenue, $0.58 EPS, 21% e-commerce growth) and adaptability (AI, Walmart+), positioning it as a resilient player in a risk-off regime. However, elevated yields (10-year 4.255%, 20-year 4.738%, 30-year 4.721%) and a stable DXY at 99.58 amplify tariff pressures and margin concerns, capping upside and reinforcing a cautious stance. A tactical long bias is favored for weekly contracts, targeting a bounce from $94.36 to $96.47–$98.50, with a short stance viable below $88.50 if support fails.
Technical implications highlight bullish momentum on daily (RSI ~40, Stochastic ~28) and weekly (RSI ~44, Stochastic ~32) timeframes, with oversold conditions signaling a rebound potential for weekly contracts if $94.36 holds. Monthly neutral momentum (RSI ~50) suggests consolidation, requiring a breakout above $96.47 to confirm bullish strength. This supports a short-term bounce but advises monitoring for sustained moves.
Market influence implications reflect a risk-off environment, with high yields and a stable DXY increasing import costs, particularly amid tariff uncertainty from WMT’s upcoming Trump meeting. The VIX at 24.84 amplifies volatility, favoring WMT’s defensive appeal but heightening risks. WMT’s Q3 FY25 strength and e-commerce growth provide stability, supporting resilience near $94.36.
OFD summary and implications reveal bearish pressure from Vanna (-$0.04), Charm (-$0.02), and DEX (-$0.06), driven by put-heavy flow and hedging demand tied to tariff fears. However, GEX (+$0.08) at the $95 strike pins price, stabilizing volatility and supporting a neutral-to-bullish bounce for weekly contracts if $94.36 holds, aligning with oversold technicals.
Edge insights bolster the case for a bounce, with institutional buying at $94–$95 signaling accumulation, defensive retail sector strength outperforming cyclicals, and low short interest (1.4%) offering squeeze potential above $96.47. These factors enhance confidence in a tactical long bias for weekly contracts, provided support holds.
Strategic outlook implications emphasize consolidation near $95.09, with $94.36 as a critical pivot. A break below risks $88.50, driven by tariff fears and bearish options flow, while a move above $96.47 targets $98.50, fueled by oversold signals and institutional support. The VIX at 24.84 and put-heavy options flow underscore volatility, but WMT’s defensive positioning mitigates downside, favoring a bounce in a risk-off regime.
In summary, WMT’s weekly outlook hinges on defending $94.36, with oversold technicals, GEX pinning, and institutional buying supporting a bounce to $96.47–$98.50 for weekly contracts. Tariff risks, high yields, and DXY stability maintain a risk-off backdrop, capping upside and requiring vigilance for a break below support, which could shift bias to bearish. This balanced approach leverages WMT’s defensive strengths while navigating weekly volatility, aligning with Buffett’s preference for resilient businesses with tactical opportunities.

DIVISLAB: Impulse formationStock is rising in an impulsive manner and currently started it's 5th wave which shall take the prices towards 7000/7600 zone in the coming weeks. On the downside key level is 5400. One should remain bullish as long as prices are trading above this level.

MFSL: Cup & HandleStock has given a breakout of Cup & Handle pattern and retested the neckline in Jan'25. The measured target for the same is coming in the region of 1900. On the downside the key level can be 1080.

Nokia:Inverted Head and Shoulders Structure + Retest of BreakoutOn the weekly chart of Nokia, a classic Inverted Head and Shoulders reversal pattern has formed. The breakout above the neckline occurred with increased volume, confirming the strength of the move. Currently, the price is undergoing a standard technical retest of the neckline from above — a typical phase before a potential continuation higher.
The structure remains active: the projected height (H) points to an initial target at $5.48, based on the distance from the neckline to the head. If momentum continues, Fibonacci extension targets are located at $6.18 (1.272), $6.55 (1.414), and $7.08 (1.618).
Technical view: the retest of the neckline is happening on declining volume, strengthening the probability of a bullish reversal. EMA 50/100/200 are beginning to align in a bullish crossover. The ascending channel structure also supports the upward movement.
Fundamentals: Nokia is progressing with its strategic programs in 5G and upcoming 6G network technologies, reinforcing its long-term growth prospects. Improved financial performance and the recovery in demand for telecommunications infrastructure amid global digitalization trends continue to support investor interest in the stock.
The Inverted Head and Shoulders pattern is confirmed by the breakout and current retest. As long as the price holds above the neckline, the bullish scenario toward $5.48 and beyond remains intact. This is a medium-term trend reversal structure — strong setups like this form the foundation for major moves. Don’t miss them.

Kotak Bank: Impulse formationStock is rising in an impulsive manner and currently trading under wave-4 correction. This correction is likely to conclude in the zone of 2215-2200 zone and then we can expect another rally on the upside under wave-5 towards 2350 zone.

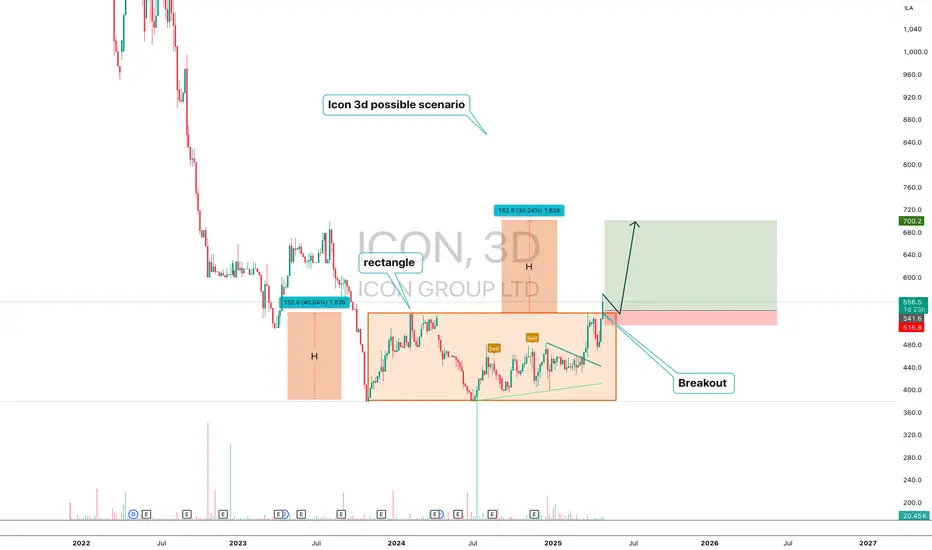
ICON — Breakout from Rectangle with H Projection Targeting $700ICON (3D) — Technical Structure Analysis
ICON has broken out from a prolonged horizontal rectangle pattern ($380–$540). The move activated a measured move structure with two H-sized waves. The first H was completed. The second H projects a move to the $700 area.
Key points:
-Confirmed breakout from range
-First H = 153 pts, completed
-Second H = 162 pts, targeting $700
-Price holding above breakout zone ($515–$541)
ICON has moved out of accumulation and entered trend expansion. As long as the support holds, the scenario remains valid. The technical model targets the $700 area.
LIC | Technical Structure Forming – View Only🔍 Stock: LIC (NS: LICI)
📌 Type: View Only – Not a Buy/Sell Recommendation
LIC has been consolidating after a decent upside move in recent weeks. Currently, the stock is trading around a key demand zone, indicating potential accumulation — but confirmation is still awaited.
🧩 Technical Overview:
Support Zone: ₹802 – ₹816
Resistance Zone: ₹842 – ₹861
Trend: Bulish
🚫 Note:
This analysis is shared for educational and observational purposes only. It is not intended as a buy or sell recommendation. Please do your own research or consult a financial advisor before taking any action.
💬 Share your views or charts below!
Tags:
#LIC #LICIndia #LICI #NSE #StockMarketIndia #TechnicalAnalysis #TradingViewIndia #PriceAction #ViewOnly #NotARecommendation #EducationalPurposeOnly

SBI: Inverse H&S BreakoutThe Inverse Head and Shoulders pattern is a bullish reversal chart pattern that signals a potential trend reversal from bearish to bullish. It consists of three key components:
Structure of the Pattern:
Left Shoulder: A price decline followed by a temporary rally.
Head: A deeper decline forming the lowest point, followed by another rally.
Right Shoulder: A decline similar in size to the left shoulder but not as deep as the head, followed by a move higher.
Neckline: A resistance level that connects the highs of the two rallies after the left shoulder and head.
The Inverse Head and Shoulders pattern in SBI, with a neckline at ₹783, indicates a potential bullish reversal. The stock has formed a well-defined left shoulder, head, and right shoulder, suggesting that selling pressure is weakening. The target price for this breakout is ₹900 calculated by measuring the distance from the head’s low to the neckline and projecting it upwards. If the stock sustains above the neckline, it could gain further momentum. However, traders should consider placing a stop-loss at 730 to manage risk in case of a failed breakout.

CHSN Price Watch: Critical Levels to MonitorCHSN is approaching a key decision point. If we see a confirmed break above the $0.33 high, there’s strong potential for a move up to $0.58, with $0.75 as a possible extension.
On the flip side, if the price breaks below the $0.29 low, we could see a retracement down to the $0.21 level.
Kris/Mindbloome Exchange
Trade Smarter Live Better

Quantum's Premium IWM Weekly OutlookSentiment
Overall Sentiment: Bearish with potential for reversal.
Options Activity: Recent data shows elevated put volume over calls (e.g., 8 puts Ascending Triangle DEX suggests a bearish directional bias. Posts on X indicate traders are eyeing short setups, reinforcing this sentiment.
1 OTM Premiums:
0DTE (April 7 expiration):
Call: $182 strike, premium $1.20 (moderate IV, ~35%).
Put: $180 strike, premium $1.35 (moderate IV, ~35%).
Weekly (April 11 expiration):
Call: $182 strike, premium $1.45 (moderate IV, ~32%).
Put: $180 strike, premium $1.40 (moderate IV, ~32%).
Notes: Premiums are kept under $1.50 for cost efficiency in 0DTE and weekly trades. IV levels are moderate, reflecting recent volatility spikes but not extreme conditions, making these contracts attractive for short-term plays.
Technical Indicators:
Weekly EMAs (8/13/48): The 8-week EMA ($198.50) is below the 13-week ($202.10) and 48-week ($208.30), confirming a downtrend.
RSI (14-week): 32, nearing oversold territory, hinting at a possible bounce.
Market Context: Small-cap stocks like IWM have been under pressure due to tariff fears and a hawkish Fed stance. However, oversold conditions and seasonal strength in April could signal a relief rally.
Potential: Continuation of the downtrend is likely unless a catalyst reverses sentiment, but a short-term bounce to $185–$190 is plausible given oversold readings.
Tariff Impact
Exposure: Moderate to severe.
Analysis: IWM tracks the Russell 2000, comprising small-cap U.S. companies, many of which are domestically focused (e.g., manufacturing, retail). A 10% universal tariff, 25% on Canada/Mexico, or 46% on Vietnam could raise input costs for these firms, squeezing margins. Sectors like industrials (20% of IWM) and consumer discretionary (15%) are particularly vulnerable. However, tariff impact may be overstated—rising interest rates and a strong dollar are likely stronger drivers of recent weakness. Critically, the narrative around tariffs often amplifies fear beyond fundamentals, offering contrarian opportunities if panic subsides.
News/Catalysts
Recent News: Trump’s tariff rhetoric intensified last week, with small-caps hit hardest (IWM down 9.5% in 1M). The Fed’s hawkish December stance continues to weigh on risk assets.
Upcoming Events:
April 8: Consumer Credit data release—could signal consumer health, critical for small-cap earnings.
Mid-week: Potential tariff policy updates—speculative but impactful.
Speculative Catalysts: X posts highlight short interest in IWM and oversold conditions, suggesting a squeeze potential. A surprise Fed pivot or tariff rollback could spark a massive rally.
Alignment: Small-caps are sensitive to economic data and policy shifts, making IWM a prime candidate for volatility-driven moves.
Technical Setup
Weekly Chart:
Key Levels:
High Volume Node (HVN): $195–$199 (prior support, now resistance).
Monthly Open: $199.78 (resistance).
Weekly Low: $176.67 (support).
Trend: Downtrend since March peak ($208.52), testing year-lows.
One-Hour Chart:
Support: $179–$180 (confluence with weekly low).
Resistance: $182.50–$184 (prior consolidation zone).
10-Minute Chart:
Entry/Exit:
Bullish: Break above $181.50 (8-EMA) with a hammer candle for a long to $183.
Bearish: Breakdown below $180 with volume for a short to $177.
EMAs (8/13/48): 8 ($181.20) > 13 ($181.00) < 48 ($182.30)—choppy, no clear trend intraday.
Indicators:
RSI (14): 38 (10-min), neutral but rising—watch for divergence.
MACD: Near zero line, flat—momentum stalling.
Options Data Weekly Overview
Gamma Exposure (GEX): Bearish—pinning near $180–$182, dealers hedging accelerates downside below $180.
Delta Exposure (DEX): Bearish—put-heavy activity signals directional selling.
Vega Exposure (VEX): Neutral—moderate volatility potential, no extreme IV spike expected.
Implied Volatility (IV): Moderate (~32–35%)—elevated but manageable, favoring sellers over buyers.
Open Interest (OI): Bearish—high OI at $180 put and $185 call strikes, capping upside.
Potential Price Targets
Bullish: $185 (+2.2%)—tests weekly HVN; $190 (+5%) if momentum builds.
Bearish: $177 (-2.3%)—revisits year-low; $170 (-6.2%) on tariff escalation.
Trade Idea
Bullish 0DTE (April 7):
Trade: Buy $182 Call @ $1.20.
Entry: Break above $181.50.
Target: $183 (profit $0.80, +66%).
Stop: $180.50 (loss $0.70, -58%).
Bearish 0DTE (April 7):
Trade: Buy $180 Put @ $1.35.
Entry: Breakdown below $180.
Target: $178 (profit $0.65, +48%).
Stop: $181 (loss $0.85, -63%).

Berkshire Hathaway | No More Apple Pie & Bank Bread!No More Apple Pie and Bank Bread | Buffett’s Recipe for Market Caution
Berkshire Hathaway has recently disclosed its earnings amid fluctuating around a $1 trillion valuation. A notable update is its continued reduction of stakes in overvalued assets, including a 20% decrease in holdings of Apple and Bank of America, boosting its cash reserves to $325 billion
Although Warren Buffett himself isn't favoring share buybacks at present, Berkshire Hathaway stands as a compelling investment option
Why Berkshire Hathaway's $325 Billion Cash Pile Signals Market Caution
The company's net earnings remain subject to significant fluctuations due to rules requiring valuation changes of investment holdings. However, there was a slight decline in operating earnings, mainly driven by lower insurance underwriting income. Despite this, that segment is historically volatile, and year over year aka YoY, the company has maintained strong performance.
Yea2date aka YTD, operating earnings have risen over 10%, totaling just under $33 billion compared to just below $29 billion last year. This points to an annualized earnings estimate of approximately $44 billion, implying a price2earnings aka P/E ratio of about 22, without factoring in over $320 billion in cash and significant investment holdings.
Excluding cash and investments, the adjusted P/E ratio is closer to single digits. Share buybacks have paused, reflected in a ~1% decrease in the outstanding shares YoY, signaling Berkshire's assessment of current market valuations.
Segment Highlights
The various business units within Berkshire Hathaway showcase its robust asset base and earning capacity. Insurance underwriting income saw a sharp YoY drop, but other business areas performed strongly. Income from insurance investments remained solid, and BNSF, its railroad subsidiary, also showed strong results despite a double digit YoY decline.
Berkshire Hathaway Energy continues its growth, cementing its position in the utility sector with significant renewable energy ventures. For context, NextEra Energy (NEE), with a market capitalization of $160 billion, posted quarterly earnings around 10% higher.
Berkshire's other controlled and non-controlled businesses contribute over $13 billion annually, underpinning its diversification and consistent earnings performance. This strength across segments underscores its formidable financial health.
Market Context
Currently, market valuations are elevated by historical standards.
Excluding periods of earnings dips, market enthusiasm is exceptionally high, with the S&P 500 P/E ratio nearing 30x, approaching levels last seen in 1999. Buffett and Berkshire appear to view a 3% yield from such a P/E as unattractive, especially when bonds offer higher returns.
The 2008 Playbook
Berkshire's track record of effectively utilizing its cash reserves is notable. Excluding its insurance float, the company still holds $150 billion in cash.
During the 2008 financial crisis, Berkshire leveraged its liquidity for strategic investments in companies like General Electric, Swiss Re, Dow Chemical, and Bank of America, as well as finalizing the full acquisition of BNSF in 2010. This proactive use of capital proved advantageous.
The current strategic sale of assets suggests Berkshire is preparing for potential market downturns. Given high S&P 500 valuations, reallocating part of an S&P 500 position into Berkshire Hathaway could be wise, ensuring exposure to a cash-rich portfolio capable of seizing future opportunities. Meanwhile, Berkshire’s earnings are valued lower than the broader market, potentially minimizing major downturn risks.
Investment Risks
A key risk is that timing the market is inherently challenging, with the adage "time in the market beats timing the market" serving as a caution. If Berkshire's market outlook is incorrect, its $300+ billion in cash could underperform while broader markets remain strong, which would diminish its appeal as an investment.
Final Thoughts
Berkshire Hathaway has taken the bold step of liquidating some of its most significant and priciest holdings, opting to incur capital gains taxes to increase liquidity. This move has bolstered its cash position to $325 billion, $150 billion above its float level. Meanwhile, its strong operational businesses continue generating healthy cash flow.
Drawing on its successful strategies during the 2008 crisis, Berkshire appears to be positioning itself for another downturn amid current high market valuations. We advise investors to consider shifting part of their S&P 500 exposure into Berkshire Hathaway for enhanced diversification and potential benefits in a market correction, long story short Berkshire Hathaway remains a robust investment opportunity but wont make millionaire!
What do you think moonypto fam?

Snow White's very low ratings - Bullish Disney stock ?The SnowWhite IMDB rating can't get any worse - could the same be said of Disney stock?
Price is the ultimate proof but buying the shares of a well established company when sentiment is at a low point can be a fruitful endevour.
The poor box office showing + very weak ratings for Snow White - maybe a contrarian buy signal ?
A) The stock is attempting a long term double bottom via is 2020 + 2023 lows
B) A breakout over the downtrend line (orange) could confirm a bullish trend change
Bottom of the ratings ➡️ Bottom in the stock? NYSE:DIS

Buy Brinker InternationalShort Term Trading Advice by Naranj Capital
Buy Brinker International
● Buy Range- 151 - 156
● Target- 166 - 169
● StopLoss- 145
● Potential Return- 6-8%
● Duration- 14-15 Trading Days

STOCKWATCH $BWwith the moving average starting to level out for 50 days and the volume weighted price also beginning to level out price will begin to magnetise as price rises volume will increase a swing Trade is on the cards
BULLISH

Crown Castle Inc. (CCI) 1WTechnical Analysis
- The weekly chart of Crown Castle Inc. (CCI) shows a potential reversal after a prolonged downtrend.
- A breakout above the descending trendline and consolidation above $110.85 (0.786 Fibonacci) could signal the start of an upward movement.
- Key Resistance Levels: $132.06 – $146.95 – $161.85 – $180.28 – $210.07.
- Key Support Zone: $83.83 - $90.
- CCI and RSI indicators confirm improving sentiment.
A sustained breakout above $110-112 could lead to mid-term growth.
Fundamental Analysis
Crown Castle is one of the largest telecommunications infrastructure operators in the US.
- Stable revenues due to long-term contracts with telecom providers.
- Dividend yield of ~6%, making it attractive for long-term investors.
- 5G expansion and IoT growth create long-term opportunities.
Risks: High debt burden, interest rate impact, and competition with American Tower.
CCI has growth potential if it breaks above the $110-112 zone. However, macroeconomic risks remain relevant.

TTD LONG SET UP (The Trade Desk)Entry 1 $55.50
Entry 2 $45.50
Stop loss $35.50
Take profit 1- $65.50
(Close 25%)
Take profit 2- $75.50
(Close 50%)
Take profit 3-$90.50
(Close 75%)
Take profit 4-$110.50
(Close 100%)

CIPLA CHANNEL BREAKOUT AND FORMING CUP HANDLECipla broke long term Channel and doing retest on Daily TF
Cup and handle forming on 1 hr TF
Buy on dips till 1440-1445
Idea Invalid if closing below 1434 on Daily TF

Adyen (ADYEN) – Technical Analysis and 1W OutlookTechnical Analysis
Adyen's stock is forming a symmetrical triangle, indicating a potential breakout. The recent price surge confirmed the pattern's breakout, but a correction toward the 0.618 Fibonacci level (1457.2 EUR) is possible, acting as a key buying zone.
Key Levels:
Resistance: 1720.8 EUR (0.5 Fibonacci), 2311 EUR (0.236 Fibonacci)
Support: 1457.2 EUR (0.618 Fibonacci), 1081.8 EUR (0.786 Fibonacci)
Target: 2838 EUR
Indicators suggest a potential continuation of the uptrend:
MACD is signaling bullish momentum
Stochastic indicates a possible correction before further upside
Fundamental Analysis
Adyen is a leading player in the payment technology sector, serving major companies like Uber, Spotify, and Microsoft.
Key Factors Impacting the Stock:
Financial Performance: Recent earnings reports showed revenue growth driven by increased payment volumes.
Macroeconomics: Lower inflation and potential interest rate cuts could benefit the tech sector.
Competition: Pressure from PayPal and Stripe remains a key risk.
Adyen maintains bullish potential following the triangle breakout. The 1457-1500 EUR zone is crucial for trend confirmation, with a possible long-term target at 2838 EUR. However, a short-term correction remains possible.
