SURFI : 93% ACHIEVED IN 5 WEEKS ; TARGET 120%HELLO TRADERS!
First of all I'm extremely sorry that I was not able to post any chart for a long time for my hectic schedule.
This trade BSE:SURFI I took about 5 weeks ago and its 92% up till then. target is just to hit in a week or two. Through this chart I want to show how this pattern work.
For more detailed analysis and learnings you can watch my videos on other platfrms.
Stockstobuy

CUMMINSIND Intraday Trading SetupCUMMISIND Intraday Trading setup. Buy above 1460.
TARGETS - 1490-1500.

BECTOR FOOD BREAKOUTA Strong Breakout Stock!
BECTORFOOD
1- Relative Strength Candidate
2- Short, Medium term MA🆙
3- Huge Volume Spurt Seen
Keep on Radar.

CG POWER NEAR BREAKOUT NSE:CGPOWER
CG POWER NEAR BREAKOUT IN 1 HR TIMEFRAME..... BUY ON CMP WITH 305 STOP LOSS

BBBY in My Top Stock Picks for 2023BBBY Bed Bath & Beyond has the potential to become the next GME GameStop or AMC Entertainment.
Heavily shorted, analysts saying that the stock May Not Make It to 2023.
Perfect for a short squeeze.
BBBY Bed Bath & Beyond is one of My Top Stock Picks for 2023!
Looking at the options chain, i would buy the $3 strike price Calls with
2023-3-17 expiration date for about
$0.70 premium.
Looking forward to read your opinion about it.

RITM Rithm Capital could be the Call of the Week! RITM Rithm Capital to report earnings on February 8, 2023 prior to the opening of the New York Stock Exchange.
If we look at fundamentals, this stock at $9.46 looks extremely cheap.
2.02 EPS
10.57% DIVIDEND YIELD
4.92 P/E ratio
But what is more impressive are the calls for this stock:
Looking at the RITM Rithm Capital options chain ahead of earnings , I would buy the $10 strike price Call with
2023-2-17 expiration date for ONLY
$0.05 premium.
In case this stock goes to $10.50 after earnings, which is not excluded considering the price history, those calls could give a return of 10X!
Looking forward to read your opinion about it.

Can S&P500 break 4100.00 during huge FOMC & Earnings week?The S&P 500 is headed for its best January since 2019, when it gained nearly 8%. So far, the market index is up ~5.0% this year, following a 19% loss last year. But this rally might have paused for the time being, as the Federal Open Market Committee begins its 2-day meeting. After which, the Federal Reserve is expected to hike its interest rate by 25 basis points. Investors will be watching carefully for any change in market sentiment regarding this forecast in the lead up to the decision. While the economy is starting to slow, US unemployment is still at 3.5% (a 50 year low) and wage growth is still strong. This means that the 25-basis-point hike is not a foregone conclusion, with 50 basis points the next likely option. Adding to the complication of forecasting the S&P 500, is the fact that more than 20% of the companies in the index are reporting quarterly earnings this week. McDonald’s, Apple, Meta Platforms, Amazon.com, and Alphabet are all set to update the market.
The question to ask ourselves is whether the S&P500 has finally entered a reversal period, or is the long-term downtrend still in place? We can also see that the previous week's candle closed above the downward trend line and the 200EMA. Although, we can look at the fake outs that took place in August and December last year, when the candles closed above the 200 EMA, but this did not result in a bullish continuation.
We can use the Aroon indicator in an attempt to gain some clues to confirm if the trend to the upside is strong. Presently, the Aroon indicator registers a strong bullish signal, as the blue line is above 70% while the red line stays below 30%. Yet, a strong key resistance, marked at around the 4100.00 area, appears to be a significant problem for the S&P 500.


MSFT Microsoft Bought 49% Stake in OpenAI creator of ChatGPTMSFT has reached our Buy area:
Microsoft purchased a 49% stake in OpenAI, creator of ChatGPT, for $10 billion.
Which i think it will turn out to be the best investment in MSFT history!
Microsoft Corporation (MSFT) integrates Chat GPT into its Bing, Office, and it Azure service!
Now looking at the MSFT Microsoft options chain ahead of earnings , I would buy the $245 strike price Calls with
2023-2-27 expiration date for about
$1.60 premium.
If the options turn out to be profitable Before the earnings release, i would sell at least 50%.
Or at least buy shares for the long run! They will compete with GOOGL thanks to OpenAI.
Looking forward to read your opinion about it.

RITM Rithm Capital Ready for a Breakout!RITM Rithm Capital to release Q4 and full year 2022 financial results for the period ended December 31, 2022 on Wednesday, February 8, 2023 prior to the opening of the New York Stock Exchange!
2.02 EPS
4.363B MARKET CAP
10.86% DIV YIELD!!!
4.73 P/E Ratio!!!
Extremely undervalued in my opinion!
But now comes the best part! You can buy the following options:
2023-2-17 expiration date
$10 strike price
for only $0.05 premium now!
So the expiration date is after the earnings, if the stock goes to $11, and i wouldn`t be surprised if the results are great, then this is a 20X call that you are reading about.
This is a premium call in my opinion, do you research before investing, as you know!

Indiamart may get a start soon...IndiaMart Intermesh is an India e-commerce company that provides B2B and customer to customer sales service via its web portal. IndiaMart intermesh is an India’s largest online B2B market place, connecting buyers with supplies. CMP – 4549.60. Negatives of the company are high valuation (P.E. = 48.8) and declining annual net profit. Positive of the company are MFs and FIIs are increasing stake. No debt, zero promoter pledge, improving cash from operating activity annual and improving book value per share. Entry in the stock can be taken after closing above 4698. The Long Term Target in the stock will be 4908 and 5082. In a very long run the stock can reach 5277 and 5400+. Stop Loss should be maintained at a closing below 4400. For Paper Trading.

Mahindra Lifespace may move upward in full flow. Mahindra lifespaces Developers is an Indian real estate and infrastructure development company. Mahindra lifespaces businesses is Residential Homes, Integrated Cities and Industrial clusters. CMP of the stock is 372.05. Negatives of the company are moderately high valuation (P.E. = 25.1), declining cash from operating activity annual and MFs decreasing stake. Positive aspects of the company are that FIIs are increasing the stake, annual net profit is increasing, Mahindra Lifespace is a low debt with zero promoter pledge. Entry in the stock can be taken after closing above 376. Targets will be 404, 415 and 448. Long term target in the company is 475+. Stop loss in the company should be maintained at closing below 344. Mahindra Lifespace is a Long term investment idea. For Paper Trading.

Long for irctc levelsBuy Whenever Take bounce from this line long term targets above 820
entry 630 (safe entry above close 680)

Atul Auto now has an Electric Moto...Atul Auto has created a niche market for themselves over 30years. Atul has emerged as the only player with complete range of 3wheeler products across the fuel range – Diesel, Petrol, CNG, LPG and now venturing into Electric. Company turnover has grown by three folds. CMP – 282.15. Negatives of the company is decreasing net cash flow. Positives of the company are low debt, improving quarterly net profit, improving annual net profit, zero promoter pledge and FIIs are increasing stake. Entry in the stock can be taken after closing above 291. The target will be 301 and 311. Long term target in the stock will be 330. Stop Loss should be maintained at a closing below 260.

Crisil coming out of Cold; Looks Bold.Crisil limited is an Indian analytical company providing ratings, research, risk and policy advisory services. Crisil operates in wide range of essential financial products for a wide range of market segments. CMP – 3044.50. Negatives of the company are that they have high valuation (P.E = 38.7), declining quarterly net profit, declining annual net profit and decreasing net cash flow. Positives of the company are that they have no debt, zero promoter pledge, improving book value per share, FIIs and MFs are increasing stake. Entry in the stock can be taken after closing above 3095. Targets will be 3190 and 3306. Stop loss in the company should be maintained at closing below 2940.

VSSL - Long viewA short term trade - VSSL
Buy VSSL range 329.80-333
Target 360
Stop Loss below 298
RSI = 63.4
MACD Trend = Bullish
Price Action = Above all imp EMA
Bullish Flag

NVTA My Top Stock Picks for 2023Buyout Rumors on August 10, 2022: price spiked to $9.01.
$17.58 Ark`s average. Biggest shareholder: 30 Million Shares.
NVTA Invitae Corporation is one of My Top Stock Picks for 2023.
A potential buyout is expected this year.
Looking at the NVTA Invitae Corporation options chain, I would buy the $2 strike price Calls with
2023-3-17 expiration date for about
$0.50 premium.
Looking forward to read your opinion about it.

JEF Jefferies Options Ahead of EarningsLooking at the JEF Jefferies Financial Group options chain ahead of earnings , I would buy the $37.5 strike price at the money Puts with
2023-1-20 expiration date for about
$1.30 premium.
If the options turn out to be profitable Before the earnings release, i would sell at least 50%.
Looking forward to read your opinion about it.

Godrej Industries looking goodGodrej Industries ltd. is a part of a Godrej group. Godrej is over 125 years old group. Godrej Industries is the holding company of Godrej group. Godrej conglomerate produces products that are related to Chemicals, Financial services, Appliances and a lot of other things. CMP of the stock is 451.30. Negatives of the company are that they have high promoter pledge and Mutual Funds are decreasing stake. Positives of the company are that their net cash flow is increasing and FIIs are increasing their stake in the company. Entry in the stock can be taken after closing above 463. Targets will be 491, 505 and 515. Stop loss in the company should be maintained at closing below 420.

Grindwell Norton may go North (Positive)Grindwell Norton Ltd. is a company involved in business related to Industrial Abrasives, adhesives, High performance ceramics and plastics, exterior architectural products and products related to cyber security and infrastructure. For abrasives in the industry the company has a cult status. CMP of the company is 1936.15. Negative aspects of the company are that they have high valuation (P.E = 62.7). At the same time positives aspect of the company are that FIIs and MFs are increasing stake. Debt on the company is very low and there is Zero promoter pledge. Book value of the share and annual net profit of the company is improving. Entry in the stock can be taken after closing above 1953. The target will be 2042. Closing above 2042 can open the doors for 2113 and 2192. Stop Loss should be maintained at a closing below 1780.


Momentum Finally rains on Rain Industries. Rain Industries is one of the biggest producer of Calcined Petroleum Coke. The company operates in 3 business verticals Carbon, Advanced material and Cement. A negative aspect of the company is decreasing ROCE. Positive aspect of the company is Zero Promoter pledge as well as FIIs and MFs increasing the stake. Entry in the stock can be taken after closing above 181. Targets will be 190 and 197. Long term target in the stock will be 206. Stop loss in the company should be maintained at a closing below 155.

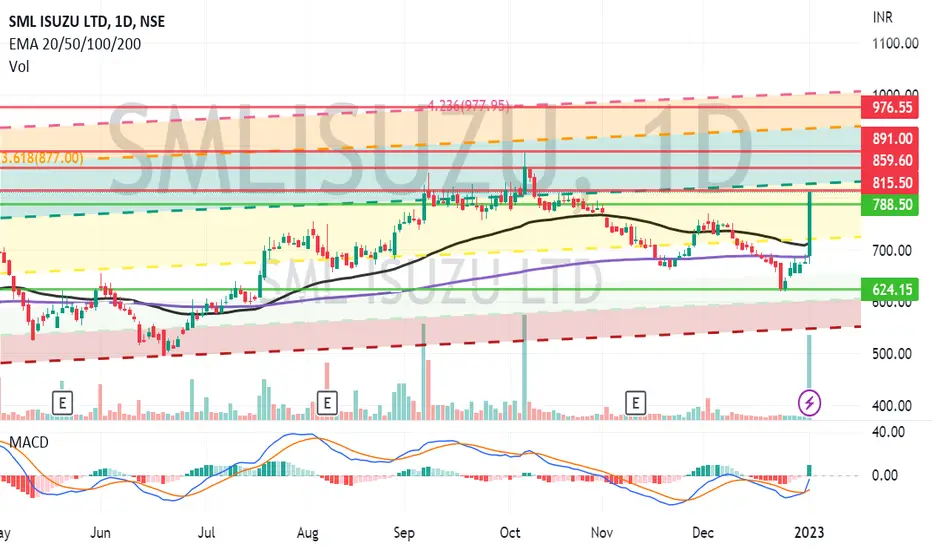
SML Isuzu is looking in good momentumSML ISUZU is a commercial vehicles manufacturer which manufactures buses, ambulances and customized vehicles. Negative aspects being net Profit of the company was seen decreasing in the recent results. Positive aspects being improving cash flow, FIIs increasing stake and Zero promoter pledge. Entry in the stock can be taken after closing above 816. Target for the stock will be 859 and 891. Long term target in the company can be 976. Stop loss in the stock should be kept at closing below 750.