AEGIS LOGISTICS Triangle Pattern• CMP: ₹800| Stop Loss: ₹750| Target:*900 | ₹1000
DISCLAIMER: I am NOT a SEBI registered advisor or a financial adviser. All the views are for educational purpose only.
Stockstobuy

GUJRAT GAS: INVERSE H&SThe Inverse Head and Shoulders pattern is a bullish reversal chart pattern that signals a potential trend reversal from bearish to bullish. It consists of three key components:
Structure of the Pattern:
Left Shoulder: A price decline followed by a temporary rally.
Head: A deeper decline forming the lowest point, followed by another rally.
Right Shoulder: A decline similar in size to the left shoulder but not as deep as the head, followed by a move higher.
Neckline: A resistance level that connects the highs of the two rallies after the left shoulder and head.
The Inverse Head and Shoulders pattern in Gujrat Gas, with a neckline at ₹396, indicates a potential bullish reversal. The stock has formed a well-defined left shoulder, head, and right shoulder, suggesting that selling pressure is weakening. A breakout above ₹406, supported by strong volume, could confirm the pattern and trigger an upward move. The target price for this breakout is ₹440, calculated by measuring the distance from the head’s low to the neckline and projecting it upwards. If the stock sustains above the neckline, it could gain further momentum. However, traders should consider placing a stop-loss below the right shoulder i.e. 376 to manage risk in case of a failed breakout.

Watch This Before Trading Delta Airlines Stock in 2025!The Art of Trading: Price Action, Supply and Demand, and Patience in Delta Airlines. Trading in the stock market is a skill that requires a deep understanding of market dynamics, disciplined decision-making, and the ability to remain patient in the face of volatility. Among the most effective strategies for achieving consistent success are price action analysis, supply and demand principles, and meticulous money management. This supply and demand stock analysis will explore how these strategies can be applied to Delta Airlines (DAL), focusing on key price levels, candlestick patterns, and the importance of patience in making informed investment decisions.
A strong demand level for Delta Airlines (DAL) has been identified at $43. This level represents a price zone where buyers have historically shown significant interest, leading to price reversals. By waiting for the stock to retrace to this level, traders can enter positions with a higher probability of success as the likelihood of renewed buying pressure increases.

KOTAK BANK: PREPARING FOR A BREAKOUTStock traded in a range of 2060 and 1640 since Oct'21. The current price action suggests for a breakout of the rectangular range. A sustained breakout shall push the prices higher towards 2590-2600 zone in the coming weeks and months ahead.

Time to buy TESLA stocks? $TSLA March came with a lot of bloodbath for the US stock market, among these sea of red was Tesla NASDAQ:TSLA ; but it seems the giant American EV company might be gearing for a massive move upwards as it nears its buying zone.
What do you think?

QMCO: 19.24 Holds or Crashes to 18? #BullRun to 25.61? It appears if we can hold 19.24 and price action continues bulish we can see levels of 25.61 being hit. However if we hold below 21 dollars next level down is 18. Let me know what you think love to hear your thoughts below

Reversal Trade - Godfrey PhilipGodfrey Philip
This stock is forming good Weekly Tighter Close. Let's wait & check out how it behaves this week.
17 Feb Week Rejection is alarming.
No follow through to that rejection in last week. This week is defending last weekly low so far.
Highly Risky Trade, Rs.600, I am targeting 10% i.e. 24 Feb 25 Weekly High.
This is not a Buy Reco, Do your own Diligence. This is purely for educational purpose.

BHARAT FORGE: INVERSE H&SThe Inverse Head and Shoulders pattern is a bullish reversal chart pattern that signals a potential trend reversal from bearish to bullish. It consists of three key components:
Structure of the Pattern:
Left Shoulder: A price decline followed by a temporary rally.
Head: A deeper decline forming the lowest point, followed by another rally.
Right Shoulder: A decline similar in size to the left shoulder but not as deep as the head, followed by a move higher.
Neckline: A resistance level that connects the highs of the two rallies after the left shoulder and head.
The Inverse Head and Shoulders pattern in Bharat Forge, with a neckline at ₹1100, indicates a potential bullish reversal. The stock has formed a well-defined left shoulder, head, and right shoulder, suggesting that selling pressure is weakening. A breakout above ₹1100, supported by strong volume, could confirm the pattern and trigger an upward move. The target price for this breakout is ₹1200, calculated by measuring the distance from the head’s low to the neckline and projecting it upwards. If the stock sustains above the neckline, it could gain further momentum. However, traders should consider placing a stop-loss below the right shoulder to manage risk in case of a failed breakout.

SRF: Breakout of Symmetrical TriangleA symmetrical triangle is a chart pattern in technical analysis that forms when the price consolidates with lower highs and higher lows, creating a converging triangle shape. This pattern indicates a period of consolidation before the price breaks out in either direction.
SRF stock has already given a bullish breakout. One should go long on the stock with Stop loss below 2550 for the measured target of 3475-80 zone.

SHRIRAM FINANCESince the low in January 2024, the stock has been rising impulsively and is currently trading within wave 3. This indicates that any pullback should remain above the 590 zone, with prices expected to continue trending toward 730 in the coming weeks to complete the wave-4 and wave-5.

#TATAMOTORS Demand ZoneBuying pressure is strong enough to overcome selling pressure.
The price has historically reversed upward from this zone.
Traders expect the price to bounce back if it reaches this zone again.

2 Minute DXYZ Analysis: Key Levels to Watch for the Next MoveWe hit our 34 target on DXY, but what’s next? If we break above 49, we could see a solid bull run. However, if weakness continues, we might test lower levels at 31, then 29, and possibly 23.50 for a deeper correction.
Watching these levels closely—what’s your outlook on DXY? Drop your thoughts below.
Kris/Mindbloome Exchange
Trade Smarter Live Better

Nike (NKE) at a Pivotal Point: Reversal or Further Decline?The weekly chart of Nike (NKE) displays a prolonged downtrend, with price action respecting a descending trendline. A harmonic Bat pattern has formed, with key Fibonacci retracement levels indicating potential reversal zones. The price has recently tested the AB=CD completion zone around $77.17 and $69.90, aligning with historical support.
Technical indicators suggest oversold conditions, as both momentum oscillators (stochastic and RSI) show signs of bullish divergence. A breakout above the trendline and sustained buying pressure could trigger a move towards T1 ($107.99) and T2 ($132.31). However, failure to hold support may lead to further downside continuation.

Finolex Cables: Unveiling the Bullish Momentum Beyond Resistancewww.tradingview.com
Current Market Overview
Finolex Cables Ltd. has exhibited significant price movements recently, indicating potential future trends. The stock is currently priced at 914.95, with notable highs and lows. Analyzing key technical indicators and historical data, we can formulate a well-rounded prediction.
Technical Indicators
Price Levels:
--------------
-> Support Levels: 800, 700
-> Resistance Levels: 1,090, 1,345.75, 1,577
Volume Profile:
------------------
Strong volume around 11,757,413 suggests significant interest and potential support at this level.
Break of Structure (BOS):
-----------------------------
Multiple BOS annotations indicate significant trend changes, highlighting key reversal points.
Order Blocks and D-Key Levels:
-------------------------------------
Order blocks (OB) and D-Key levels mark areas of high trading activity and potential reversal zones.
Historical Performance
The chart showcases several Break of Structure (BOS) points, signaling critical trend reversals. The recent price action around the 800 support level suggests a potential rebound, while resistance levels at 1,090, 1,345.75, and 1,577 indicate possible challenges ahead.
Future Projections
Based on the current analysis, we can outline three potential scenarios:
Bullish Scenario:
-------------------
-> Minimum Projection: 1,090 (+17.38%)
-> Average Projection: 1,345.75 (+47.08%)
-> Maximum Projection: 1,577 (+72.36%)
If the stock breaks above the 1,090 resistance level and sustains this momentum, it may target higher levels. This would require strong buying pressure and favorable market conditions.
Bearish Scenario:
---------------------
If the stock fails to break above 1,090 and instead breaks below the 800 support level, it could decline further towards 700. This would indicate continued bearish pressure and lack of buying interest.
Conclusion
-------------
The technical analysis suggests a potential bullish trend for Finolex Cables Ltd. The support levels around 800 and 700 provide a strong foundation, while the resistance levels at 1,090, 1,345.75, and 1,577 offer potential targets. Traders should monitor these levels closely and consider the projections when making trading decisions.

Price is never random! TSLA Tesla nice bounce. Did you eat?✅Nice bounce off Tesla. 👌
ℹ️Remember PRICE is just one point and in my opinion always second to TIME.
🟢When the WHERE (price) matches the WHEN (time) that is when it all comes together and the magic happens.

SOFI Ready to Break Out to $30+ ?I’ve been watching this move closely, and right now, we’re heading toward $16.49—a level that could decide the next big move. If we break through $16.98, there’s a real shot at pushing toward $18.33 and beyond, with a longer-term target of $30+.
But here’s the flip side: if we reject at $16.49, we could see a pullback to $15.50, maybe even $14.50 if buyers don’t step in. That $1 range is where things could get really interesting.
I know a lot of you are in SOFI or watching it closely. What’s your plan? Are you holding, adding, or waiting for a dip?
Kris/ Mindbloome Exchange
Trade Smarter Live Better

STOCKS | AI | Amazon, Meta & MSFTPeople who are saying that AI is just a bubble are missing the big picture. Huge tech companies are pouring serious money into it, which shows they believe AI is here to stay.
We're talking massive investments – like over $320 billion in AI infrastructure by 2025, according to the Financial Times. Amazon is planning over $100 billion in capital expenditures in 2025, mainly focused on AI infrastructure. This could be huge not only for NASDAQ:AMZN as a whole but also for the AI industry.
Alphabet is also throwing in around $75 billion this year to boost its AI capabilities. These kinds of investments from the top players make it clear: they know you have to spend big to win in the AI game and clearly there is a race going on, especially after the release of DeepSeekAI. American companies don't want to be left behind, and it's likely that they will pour money into integrating AI to improve their business operation - with the ultimate aim to improve profit - which is great for stock prices. How they make money from AI might change over time, but the overall direction is obvious – AI is changing everything and driving innovation.
According to Statista, the global AI market is predicted to reach around $826 billion by 2030. That kind of growth tells you AI is going to be a major force in just about every industry. And therefore I believe that all the companies making major investment in AI will also see exponential growth over the next 5 years - meaning it may be a longer term game play.
_______________
NASDAQ:MSFT NASDAQ:META

Where does cnvs go from here been saying buy since .80-1.80$ Does cnvs reach 6.20-7 and if so 10$ after....!?
Crazy movement and insane roi over 6 months, heavy shares owned by public it seems and poised for an ER x3 of there previous quarter.. in revenue, the biggest issue in passed was no revenue. Let's see where it takes us! Macd swinging up on 1d 1w and 4h broke out of the bull pendant with massive volume
Goals
6.20 most probable
7 probable
10 low
20 low

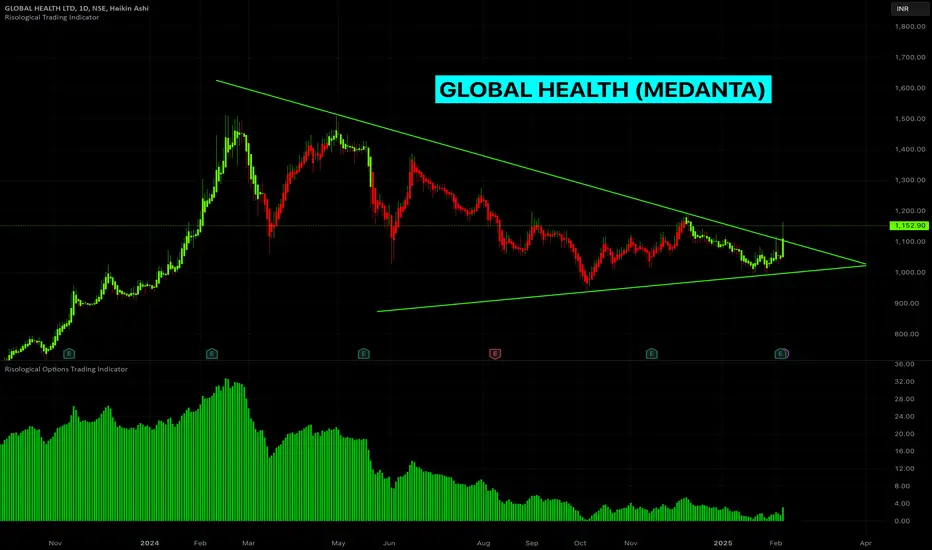
GLOBAL HEALTH LTD - Symmetrical Triangle BreakoutThis is still an open candle and need to wait till this candle closes in GREEN on Friday end of the day. If the candle is green and is clearly breaking out from the triangle on Friday, it is a Bullish sign.
On the daily time frame, the daily candle has closed in GREEN, which is a good sign.
The Risological indicators confirm the bullish movement as seen below.
ENTRY:
The stock can be purchased on the daily time frame as the Risological indicators gave the confirmation
EXIT:
Hold the BUY position till the Risological indicator gives a reversal
Exit on first RED candle close on the daily time frame.
OR, Exit if the Risological options trading indicator turns into RED.
Hope this helps!
Cheers!
__All info = educational only__
BABA its time to go Long!Alibaba Group Holding Limited (BABA) Cloud Integrates DeepSeek AI Models, Enabling No-Code AI Deployment (Yahoo.com)
In terms of technical analysis, we have 3 confirmations that give us a good signal to entry for go Long!

Innotek: the company stay optimistic abt its long-term prospectsInnoTek
InnoTek, trading at \$0.43, has been navigating a transformative journey since selling its core disk-drive components business over 15 years ago. The precision components manufacturer pivoted to grow its small stamping business and has since diversified into promising sectors such as electric vehicles (EVs) and graphics processing unit (GPU) servers, which are riding the artificial intelligence (AI) wave. These efforts are now bearing fruit, with revenue for the first half of 2024 rising 30.9% year-on-year to S\$121.6 million.
The diversification strategy has been driven by growth in GPU server-related projects for AI applications, which now account for about 27% of InnoTek’s revenue, up from 14% a year earlier. The automotive segment remains its largest contributor, accounting for 33% of revenue, bolstered by the strong EV market in China. Other segments, including office automation, TVs and displays, also contribute significantly to its topline.
However, profitability has taken a hit, with net profit for H1 2024 slipping 8.3% to S\$3.2 million. This was attributed to extraordinary costs linked to shifting business strategies and geopolitical tensions driving the “China+1” manufacturing strategy. InnoTek has been strategically expanding its footprint in ASEAN countries, with facilities in Thailand and Vietnam, and plans to further invest in Malaysia due to its favorable infrastructure and skilled workforce.
Despite short-term challenges, the company remains optimistic about its long-term prospects. With a market capitalization of \$100 million, InnoTek trades at 0.6x its book value of 76 cents. Its strong balance sheet, featuring net cash of \$56 million, supports a sustainable dividend payout of 2 cents per share, translating to a yield of 4.6%. Analysts recommend an “Accumulate on Weakness” strategy, citing the company’s strong positioning for longer-term growth.

Meta's Q3 Financial Results | Growth and the Future of AI & AR Meta's Q3 Earnings: AI Investments Shape the Future of Engagement and Monetization
Last week, Meta shared its Q3 earnings, revealing a familiar trend: while the results were strong, rising AI investments cast a shadow. With over 3.2 billion daily users across Meta’s apps, the company alongside Google and YouTube is in a prime position to bring AI into the mainstream. However, this shift could potentially disrupt the creator economy as we know it
So, how will this affect the future of Meta’s apps?
Did you know META is 222% up since our first analysis ?
Let’s break down the quarter and explore the latest updates
Today’s Highlights
- Overview of Meta Q3 FY24
- Recent business highlights
- Key quotes from the earnings call
- The potential decline of the creator economy
1. Meta Q3 FY24 Overview
Meta operates within two main segments
FoA: Family of Apps (Facebook, Instagram, Messenger, and WhatsApp)
RL: Reality Labs (virtual reality hardware and software)
Daily Active People in FoA grew by 5% year over year, reaching 3.29 billion. However, user growth has slowed, with Meta adding 20 million daily users in Q3 2024 down from 50 million earlier in 2024.
Meta’s reach now extends to over half of the global population aged 15 to 80, meaning future growth will hinge more on engagement and ad efficiency than adding new users.
Key Insights from Zuckerberg:
-Facebook: Positive engagement trends among Gen Z in the U.S.
-Instagram: Sustains “strong” growth globally.
-WhatsApp: Now surpasses 2 billion calls daily.
-Meta AI: 500 million monthly active users.
-Threads: 275 million monthly active users, up from 200 million in Q2, with notable growth in regions like the U.S., Taiwan, and Japan (currently not monetized and unlikely to drive significant revenue by 2025).
Advertising Performance:
- Ad impressions grew 7% year-over-year (compared to 10% in Q2).
- Average ad price increased by 11% year-over-year (10% in Q2).
- Average revenue per user grew by 12% year-over-year, reaching $12.29 (compared to Snap at $3.10 and Reddit at $3.58).
- Despite some critics suggesting potential inflation due to bot activity, ARPU growth points to real ad value; fake users can’t generate revenue.
Financials
- Revenue rose 19% year-over-year to $40.6 billion.
- FoA saw a 19% increase, reaching $40.3 billion.
- RL grew by 29% to $0.3 billion.
- Gross margin was 82% (-1pp Y/Y, +1pp Q/Q).
- Operating margin stood at 43% (+2pp Y/Y, +5pp Q/Q).
- FoA operating profit was $21.8 billion (54% margin, +2pp Y/Y).
- RL reported an operating loss of $4.4 billion (down slightly from $4.5 billion in Q2).
- EPS rose by 37% year-over-year to $6.03.
Cash Flow
- Operating cash flow was $24.7 billion (61% margin, +1pp Y/Y).
- Free cash flow was $15.5 billion (38% margin, -2pp Y/Y).
Balance Sheet
- Cash and marketable securities totaled $71 billion
- Long-term debt was $29 billion
Guidance:
- Q4 FY24 revenue is forecasted at $46.5 billion in the mid-range
- FY24 expenses estimated at $96-$98 billion (previously $96-$99 billion)
- FY24 Capex is expected to be $38-40 billion (previously $37-$40 billion)
Summary Analysis
Revenue growth was 20% in constant currency (compared to 23% in Q2), with ad revenue growth driven by increased ad prices. Strong demand for ads continued, largely due to higher ad performance, especially in online commerce, healthcare, and entertainment. Geographically, North America and Europe led growth at 21%, while Asia slowed from 28% to 15%.
Reality Labs’ revenue rose 29%, mainly from hardware sales, though the division continues to post significant losses. As shown in the visuals, FoA operating profit reached an all-time high, while RL’s losses remain around $4 billion quarterly.
Headcount increased by 9% year-over-year to 72,404, signaling a return to hiring, particularly in priority areas such as monetization, infrastructure, Reality Labs, and generative AI.
Stock buybacks amounted to nearly $9 billion in Q3, up from $6 billion in Q2, though lower than the $15 billion in Q1. Management’s confidence in Meta’s stock remains strong, with an additional $1.3 billion paid in dividends.
Capital expenditures climbed by 36% to $9.2 billion compared to $8.5 billion in Q2, with guidance staying on track. Management anticipates “significant acceleration in infrastructure expenses” for 2025, which will affect both the cost of revenue and R&D expenses.
Despite heavy AI spending, Meta remains highly profitable, generating nearly $52 billion in free cash flow over the past 12 months—just shy of Alphabet’s $56 billion over the same period.
Q4 FY24 revenue guidance points to deceleration, with mid-range growth forecasted at 16%.
Let’s examine Meta’s investments and market position further.
2. Recent Business Highlights
Meta Orion
Meta's Orion AR glasses mark an ambitious step towards a future beyond smartphones, showcasing the potential of augmented reality (AR):
-Prototype Status: Orion is a high-tech AR prototype, equipped with advanced features, but high production costs keep it out of reach for consumers.
-Advanced AR Display: Using Micro LED projectors and silicon carbide lenses, Orion offers a broad field of view with sharper visuals than most current AR devices.
-Interactive AI Integration: With Meta's generative AI, Orion enables users to interact with virtual elements, identify real-world objects, and create immediate solutions, such as recipes.
-Complex Hardware: Orion relies on a neural wristband for control and a wireless compute puck, creating a multi-part system.
-High Cost & Limited Production: With a price tag estimated at $10,000, Orion isn’t ready for mass production. Meta has produced around 1,000 units for demonstrations and internal testing.
- Future Vision: Meta aims to release a consumer-friendly AR device within a few years, working toward a slimmer, more affordable model that could rival smartphone prices.
Orion reflects Meta's goal to lead the next wave of computing, though significant technological and cost hurdles remain.
Timing and Competitive Landscape**: Zuckerberg’s reveal of Orion may aim to justify Reality Labs' annual $16-20 billion operating loss to shareholders and gather feedback. Meanwhile, Apple has initiated its “Atlas” project to explore the smart glasses market, indicating potential plans to shift focus from the high-end $3,500 Vision Pro VR headset.
How AI Is Already Impacting Meta
Beyond future-oriented projects like Orion, Meta’s AI advancements are actively enhancing its core business in two strategic areas: engagement and monetization.
-Engagement: Meta's recommendation engine uses AI to tailor feeds with highly relevant video content, keeping users engaged. AI-driven prediction systems further increase app usage by showing content that maximizes interaction.
-Monetization: AI boosts ad efficiency across the entire lifecycle—from creation to performance tracking. Generative AI assists with ad copy, images, and video, while advanced models analyze user behavior to serve targeted ads, improving conversion rates incrementally.
-Meta AI Studio: This platform allows developers to create, train, and deploy custom AI models within Meta’s ecosystem. By enabling personalized assistants, interactive AI, and AR applications, Meta seeks to drive new consumer apps and maximize ad potential across its platforms.
Market Share
Meta’s advertising revenue hit $39.9 billion in Q3, reaching 81% of Google’s search revenue, up from 76% last year. Meta’s ad revenue is expanding at the same rate as Amazon’s, despite Meta’s larger base, signaling regained market share and effective adaptation to the post-ATT environment.
3. Key Quotes from the Earnings Call
CEO Mark Zuckerberg
- On AI and the Family of Apps: “Improvements to our AI-driven feed and video recommendations have led to an 8% increase in time spent on Facebook and a 6% increase on Instagram this year alone. More than a million advertisers used our GenAI tools to create over 15 million ads last month, and we estimate businesses using Image Generation are seeing a 7% conversion lift.”
-On Llama 4: “We're training the Llama 4 models on a cluster larger than 100,000 H100s, more extensive than anything reported elsewhere.”
-On RayBan Meta Glasses: “Glasses are the ideal AI form factor as they let your AI see, hear, and communicate with you. Demand remains strong, with the new clear edition selling out quickly.”
-On Meta AI: “We’re on track for Meta AI to become the world’s most used AI assistant by year-end, with popular uses including information gathering, task assistance, and content exploration.”
CFO Susan Li
-On Recommendations: “Inspired by scaling laws observed in large language models, we’ve developed new ranking architectures for Facebook video that enhance relevance and increase watch time”
-On Capital Allocation: “We’re optimistic about our opportunities and believe that investing now in infrastructure and talent will accelerate progress and returns.”
4. The Potential Decline of the Creator Economy
Facebook and Instagram have evolved from social networks to content networks, benefiting creators with wide-reaching platforms. However, this era may be coming to a close.
-AI-Generated Content: Zuckerberg shared plans to introduce AI-generated and AI-summarized content on Facebook, Instagram, and potentially Threads, gradually shifting away from creator-generated content as the primary engagement driver.
-Impact on Creators: As AI learns to identify and generate engaging content, creators could struggle to compete, with algorithms delivering exactly what audiences want. Over time, creators may face a landscape where AI determines the most engaging posts, relegating them to the sidelines in a world increasingly powered by self-generating content.
-Why It Matters: Platforms like YouTube share 55% of ad revenue with creators, but Meta does not, meaning that an AI-driven shift isn’t primarily about cost-cutting. Instead, it allows for more integrated ad placements within algorithmic feeds, potentially boosting impressions and conversions.
Although AI generated feeds may sound dystopian, current high engagement accounts already use tactics to maximize engagement, meaning the shift to AI might go largely unnoticed by audiences.

NVDA Technical analysis and my view on the stockIn my opinion, NVDA is still robust and is establishing a low on the 200 MA.In spite of the current dispute with Deepseek, NVDA remains a robust stock and business.
Currect support $120 + 200 EMA.
