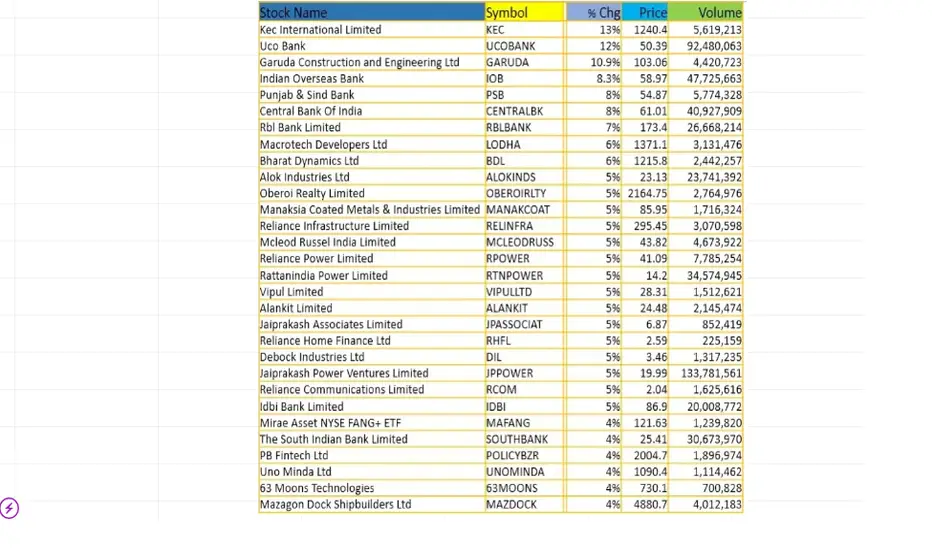
Intraday moving average stocks for (05/Dec/2024)Technical Analysis of Moving average stocks (05/Dec/2024)
follow for more updates and information
Stockstobuy
SAP’s Cloud & AI MomentumSAP’s Cloud and AI Momentum: Why This Tech Giant Remains a Top Buy in 2024
SAP is a Germany based company specializing in enterprise application software
It operates through three key segments:
1.Applications, Technology & Services: This segment focuses on selling software licenses, subscriptions to SAP’s cloud applications, and related services. It encompasses support services, various professional services, implementation services for SAP’s software products, and educational services to help customers effectively use SAP solutions
2.SAP Business Network:This segment includes SAP’s cloud-based collaborative business networks and related services. It covers cloud applications and professional and educational services related to the SAP Business Network. This segment also encompasses cloud offerings developed by SAP Ariba, SAP Fieldglass, and Concur, which facilitate supplier collaboration, workforce management, and expense management.
3.Customer Experience:This segment offers both on-premise and cloud-based products designed to manage front-office functions, focusing on customer experience management. It provides solutions that help businesses enhance and streamline interactions with customers.
These segments enable SAP to offer a wide range of solutions, addressing enterprise needs from back-office functions to collaborative networks and customer-facing operations.
SAP remains a top pick, with clear growth momentum that could accelerate further and potential for margin improvements. My buy rating remains unchanged.
SAP reported its Q3 2024 earnings, showing a 10% year-over-year revenue increase in constant currency (CC) to €8.5 billion, maintaining the same growth momentum as Q2 2024. The highlight is the cloud segment’s revenue growth, reaching €4.35 billion, with a y/y CC growth rate accelerating from 25% in Q2 2024 to 27% in Q3 2024. This aligns well with my expectations, as the current cloud backlog (CCB) grew by 29% y/y CC, improving 100 basis points from Q2 2024. By product category, the Cloud ERP Suite showed 36% y/y CC growth, a 300bps sequential improvement. License revenue, though still declining, saw a slower drop from -27% in Q2 to -14% in Q3, and maintenance revenue declines also eased from -3% to -2%. This solid revenue performance contributed to a strong profit outcome, with adjusted EBIT beating estimates by approximately 9% at €2.24 billion, and a major free cash flow (FCF) beat of €1.25 billion, far surpassing the consensus of -€676 million.
Given this strong performance, it wasn’t surprising that management raised guidance, which is certainly encouraging. They now forecast adjusted EBIT in the range of €7.8 to €8 billion, a €150 million increase at the midpoint, implying y/y growth of 20% to 23% CC, up from the previous 17% to 21%. Cloud and software revenue guidance also increased by €400 million at the midpoint, with a new range of €29.5 to €29.8 billion, reflecting 10% to 11% y/y CC growth versus the previous 8% to 10%. Additionally, adjusted FCF is now projected between €3.5 to €4 billion, compared to the prior €3.5 billion.
I am confident that SAP can meet these targets for several reasons. First, the S/4HANA migration remains strong, as indicated by 29% y/y CC CCB growth and 36% y/y CC growth in the Cloud ERP Suite, which accounts for approximately 84% of total cloud revenue. Second, nearly one-third of deals signed in the quarter involved AI, highlighting increased demand for embedded AI solutions. This reinforces my previous view that AI adoption is driving SAP’s cloud migration efforts, as customers must utilize the cloud to fully leverage these AI capabilities. Notably, SAP is moving to the “expand” phase of its strategy by adding generative AI (GenAI) capabilities.
With SAP introducing more AI features, the company is well-positioned to continue capitalizing on this growth driver. For example, its AI-based assistant, Joule, now offers collaborative agent capabilities, allowing it to manage multiple AI agents for complex tasks—resulting in significant productivity gains. Additionally, the Knowledge Graph, a part of SAP’s GenAI suite, connects language and data to help users navigate SAP systems more efficiently. SAP has over 100 GenAI use cases and has added more than 500 skills to Joule so far, suggesting substantial growth potential.
AI adoption remains robust, as evidenced by AI’s central role in SAP’s sales strategy. Around 20% of deals now include premium AI features, and all ERP and LoB deals involve discussions around AI, signaling that AI is a key growth driver for SAP, especially considering that AI integration was minimal a few years ago.
I reaffirm my model assumptions and see continued attractive upside potential, even after SAP’s strong year-to-date share price rally. SAP is increasingly likely to achieve 10% growth for FY24, with further acceleration expected in FY25/26, driven by strong cloud migration and rising AI demand. Management’s upward revision of FY24 adjusted EBIT indicates that earnings margins will improve. Year-to-date, the adjusted earnings margin stands at around 21.1%, making my full-year target of 21.5% feasible. As growth accelerates and SAP completes its restructuring (which impacts 9,000 to 10,000 positions as announced in January 2024), margins should rise to the mid-20% range. I’ve added 300 basis points based on trends from FY22 to FY24. Additionally, with no visible slowdown in growth momentum, I expect the market to continue valuing SAP at a premium, at 36x forward PE compared to the three-year average of 23x.
The macroeconomic environment poses risks, especially if supply chain challenges persist or interest rates rise. Political uncertainties, such as the upcoming U.S. election, could lead to reduced business investment, impacting corporate IT budgets and SAP’s sales. Additionally, if SAP’s S/4HANA and cloud products underperform, or if there are delays in product development or launches, investor expectations may be disappointed, particularly regarding S/4HANA.
To conclude, I maintain my buy rating on SAP. The company’s strong Q3 2024 performance and revised guidance have reinforced my positive view. The accelerating growth in cloud revenue, driven by solid S/4 HANA migration and increased AI adoption, is highly encouraging. While macro risks remain, SAP’s robust fundamentals and favorable growth outlook support a buy rating.

JAIBALAJI : uplift is coming?1. Jai Balaji Industries Ltd
Analysis:
Wave Structure: Identifies an Elliott Wave correction (ABC structure). Wave C is nearing completion in the 860-841 INR zone.
Buying Range: Highlighted between 860-841 INR.
Target Zone: Marked at 1218-1261 INR, suggesting strong upside potential.
Stop Loss: Defined at 817 INR, just below the buying zone.
Trading Plan:
Action: Place buy orders in the range of 860-841 INR using a staggered accumulation strategy.
Stop Loss: Set at 817 INR to account for potential false breakdowns.
Targets:
First Target: 1218 INR.
Final Target: 1261 INR.
Reasoning:
Wave C completion near the buying range suggests a potential reversal.
Targets align with historical resistance levels, making them logical profit zones.

Meta I Potential correction and more growthWelcome back! Let me know your thoughts in the comments!
** Meta Analysis - Listen to video!
We recommend that you keep this pair on your watchlist and enter when the entry criteria of your strategy is met.
Please support this idea with a LIKE and COMMENT if you find it useful and Click "Follow" on our profile if you'd like these trade ideas delivered straight to your email in the future.
Thanks for your continued support!Welcome back! Let me know your thoughts in the comments!

When is a stock too high to buy? (Example: IHG)How do you know when you’ve missed the boat?
A stock has already gone up a tonne, so bascally you are too late!
Sometimes, you just have to let go, right?
Sometimes yes, but not always - let’s look at an example.
International Hotels Group (IHG)
Back in 2020, LSE:IHG IHG shares were trading down at ~2000 GBX, now they are a hairs breadth from 10,000 - that’s 5X in about 4 years. Not bad.
Can you really even think about buying shares at 10,000 that were 2,000 only 4 years ago. 🤔
We’re saying YES.. if you follow some guidelines.
Clearly this is not a value investment - this is a momentum trade.
To be buying IHG shares up here, one is basically arguing that the price at new highs indicates and buyers are in charge and the price is going to keep going up for the time being.
This helps define the trade risk very well.
If the trade is that IHG has broken out over the previous peak at ~8,800. We don’t want to be owning shares below this level - if they’re back below 8,800 the momentum has stalled and we need to be out.
To put it another way, we are not buying just under 10,000 and willing to hold the shares all the way back down to 2,000 again - no. We want to ride the momentum up - not down !
From here there’s a pretty good chance that momentum takes the price up to the 10,000 level. As a big round number, there is also a good chance that profit taking takes place here too.
That creates our buy zone between 8,800 and the current market price (9,750).
So what might a trading strategy look like to capture this situation?
The following is a way to have:
An intial risk of £1000 to test the waters
A total risk £3000 if/when the trade starts working
A 2X profit potential (with the opportunity to capture more)
Spread Betting Strategy: Target £6000+ Profit with £1000 Initial Risk
Entry Points and Stops
9000 GBX Entry:
Stop Loss: 8600 GBX.
Bet Size: £2.50 per point.
Risk: £1000.
9200 GBX Entry:
Stop Loss: 8800 GBX.
Bet Size: £2.50 per point.
Risk: £1000.
9400 GBX Entry:
Stop Loss: Trailing 400 points.
Bet Size: £2.50 per point.
Initial Risk: £1000.
Profit Targets
First Position (9000):
Gain: 1000 points.
Profit: £2500.
Second Position (9200):
Gain: 800 points.
Profit: £2000.
Third Position (9400):
Trailing Stop Profit Example:
10,400 GBX: Profit = £2500.
11,000 GBX: Profit = £4000 or more.
Summary
Total Risk: £3000.
Fixed Profit (First Two Positions): £4500.
Potential Profit (Third Position): Variable, based on trailing stop.
Reward-to-Risk Ratio: 2:1 or higher, depending on trend continuation.

ADANIENT // What to do?www.tradingview.com
ADANIENT: Everyone should have a partner like ADANI...the GQG Partners :). Whenever Adani stocks are in trouble, they come as savior.
Jokes apart, here are the findings. The lower gaps are filled now.
The upper gaps are still open so there are chances it may go to fill them.
The Resistances are 2420 / 2544 / 2667 / 2755
The Support are 2020 / 1763 / 1500
I would prefer to enter for a buy position once it breaks and sustains above 2420 atleast and target will be 2750 for short term. The most safe or stable buy can be above 2900.

FINPIPE - Finolex Industries: A Perfect Wave SetupFinolex Industries Ltd: Wave Structure and Fibonacci Confluence Analysis
1. Overview
This chart analysis of Finolex Industries Ltd leverages Elliott Wave Theory and Fibonacci retracement zones to identify high-probability price movements. It captures the interaction of a primary wave (blue) and an intermediate wave (red), providing insight into the potential price reversal and future targets.
2. Technical Breakdown
Primary Wave (Blue): Reflects the major downtrend that defines the broader bearish structure of the market.
Intermediate Corrective Wave (Red): Represents the corrective structure of the ABC pattern, indicating a possible reversal zone.
Wave A: Initiates the corrective sequence with bearish pressure.
Wave B: Forms a minor retracement, lacking strong upward momentum.
Wave C: Extended downward move, aligning with the critical retracement zone of 113%–127% Fibonacci.
Critical Fibonacci Zone (113%–127%):
Acts as a key reversal zone. The completion of Wave C in this area often signals a potential bullish reversal.
Break of Structure (BoS):
The chart highlights a BoS, which suggests a shift in price action structure. If the price sustains above the ₹241–₹249 zone, it could lead to bullish momentum.
Target Zone (₹344–₹356):
Price is expected to head toward the retracement of the last high swing once the Wave C correction concludes.
Stop-Loss Placement:
Set below ₹235.55 on a day-close basis to manage risk. A failure to hold this level could lead to a deeper correction toward ₹214.39.
3. Logical Interpretation of Price Action
Elliott Wave Theory:
The corrective ABC wave structure is a classic setup for identifying potential reversals. Here, Wave C extends into the 113%–127% Fibonacci zone, a typical completion point for corrective patterns.
Break of Structure (BoS):
A BoS above ₹249 confirms structural strength. This is critical in signaling a shift in sentiment from bearish to bullish.
Volume Analysis:
The lack of significant volume during Wave B confirms limited buyer strength. A strong breakout above the BoS zone with volume would confirm bullish interest.
4. Strategy Recommendations
Entry Points:
Wait for bullish confirmation near the ₹241–₹249 zone (e.g., bullish candlestick pattern, volume surge).
Targets:
First Target: ₹344–₹356 (retracement of the last high swing).
Stop-Loss:
Below ₹235.55 on a day-close basis to manage downside risk.
Alternative Scenario:
If the price breaks below ₹241, expect a deeper correction toward the ₹214.39 support zone.
5. Educational Insights
Extended Fibonacci Levels (113%–127%):
These levels are critical in identifying the completion of corrective waves, particularly in Wave C structures. They often act as zones of reversal, offering high-probability trade setups.
Break of Structure (BoS):
A BoS above a key price level is a significant indicator of sentiment shift. Combined with volume and candlestick analysis, it helps traders build conviction.
Wave ABC Patterns:
Understanding corrective wave patterns allows traders to predict potential trend continuation or reversal points, aiding in better entry and exit timing.
6. Summary
This analysis of Finolex Industries Ltd combines Elliott Wave Theory and Fibonacci retracements to outline a potential bullish scenario. The setup offers a clear risk-reward strategy for traders, emphasizing key zones like the ₹241–₹249 support area and the ₹344–₹356 target zone. Adopting disciplined risk management with stop-loss placement ensures effective trade execution in a volatile market.

Can Tencent salvage Ubisoft's sinking ship?Ubisoft’s stock pumped 35% couple of days ago following a Bloomberg report suggesting that Tencent may either acquire the company or take it private
Although the French gaming company didn’t confirm or deny the speculation, it did state that it’s considering "all strategic options" for the benefit of its stakeholders and will notify the market when necessary
If Tencent proceeds, it would mark another significant acquisition in a wave of major gaming deals over recent years:
- Activision Blizzard acquired by Microsoft for $69 billion in 2023.
- Zynga acquired by Take-Two for $12.7 billion in 2022.
- ZeniMax Media acquired by Microsoft for $7.5 billion in 2021.
- Savvy Games acquired by Scopely for $4.9 billion in 2023.
- Bungie acquired by Sony for $3.7 billion in 2022.
- Glu Mobile acquired by EA for $2.4 billion in 2021.
- Keywords Studios acquired by EQT for $2.4 billion in 2024.
Ubisoft’s valuation sits at just $2 billion, nearly 90% below its peak in 2021! The stock fell by more than 40% in September alone, so this recent surge is only a brief reprieve. Given its diminished value, a potential buyer offering a premium wouldn’t necessarily be a massive win.
So, how should we interpret this news, and what can we anticipate for future gaming M&A activity? Let’s break it down.
Key Points
1.Ubisoft’s Challenges
2.Potential Buyers
3.IP Gold Rush
4.Future of Gaming M&A
1. Ubisoft’s Challenges
Ubisoft has faced setbacks including canceled games, delays, and a dip in quality in the post-pandemic era. Let’s take a look at the fiscal year 2024, which ends in March.
Consider this metric reflects the total amount spent by users within a period, covering game sales, in-game purchases, subscriptions, and downloadable content (DLC). It’s an important measure of business performance, with net bookings recognized as revenue over time, depending on content delivery and user engagement
Key takeaways:
Digital-first: 86% of Ubisoft's net bookings come from digital sales (premium, free-to-play, and subscriptions). It was 12% in 2013, illustrating the transformative past decade.
Far behind on mobile: Ubisoft has trailed its peers, with only 7% of revenue coming from mobile. In contrast, nearly half of the industry’s revenue comes from smartphones.
Margins improved after cost-cutting: Digital games are a high gross margin business, particularly with the back catalog (title released in previous years) making up nearly two-thirds of net bookings. Targeted restructurings impacted FY23, making the short-term margin trend misleading. Ubisoft laid off 1,700 employees between September 2022 and March 2024, roughly 6% of its workforce.
Short-lived turnaround: FY23 was a challenging year, with Net bookings collapsing by 18% with the underperformance of Mario + Rabbids: Sparks of Hope and Just Dance 2023. In FY24, Net bookings rebounded sharply, growing 34% with the successful release of Assassin’s Creed Mirage and The Crew Motorfest.
FY25 Collapses in a Week: After the underperformance of Star Wars Outlaws (released at the end of August and originally expected to be a blockbuster) and the delayed launch of Assassin’s Creed Shadows from November to February, Ubisoft revised its FY25 net bookings forecast down to €1.95 billion, a 16% decline year-over-year (compared to the "solid growth" expected earlier). The company now anticipates barely breaking even on an adjusted basis.
The decision to delay Assassin’s Creed Shadows just weeks before its scheduled release was influenced by the poor reception of *Star Wars Outlaws*. However, the three-month delay might not be enough to resolve concerns over game quality or criticisms from the Japanese community regarding historical and cultural inaccuracies.
But that’s not all!
In addition to these financial and operational difficulties, Ubisoft has faced allegations of a toxic workplace. Several former executives from the *Assassin’s Creed* studio were arrested as part of an investigation into sexual assault and harassment.
This situation mirrors the downfall of Activision Blizzard in the months leading up to its acquisition by Microsoft, which leads us to potential buyers for Ubisoft.
2. Potential Buyers
Ubisoft remains a family-run company, largely overseen by its founders.
The latest annual report reveals the following voting rights:
- The Guillemot family controls 20.5%
- Tencent owns 9.2%
In September, minority shareholder AJ Investments claimed it had gained backing from 10% of shareholders and called for Ubisoft to be sold or taken private, estimating a fair value of €40 to €45 per share. With shares currently trading at €13, this seems highly optimistic.
So, who are the likely candidates for a Ubisoft buyout?
Key Players:
-Tencent: Already a significant shareholder, Tencent could increase its stake or seek majority control. As the largest gaming company globally by revenue, Tencent has a history of acquisitions, such as its purchase of Finnish publisher Supercell (*Clash of Clans*) for $8.6 billion in 2016. However, Tencent's aggressive expansion has drawn regulatory scrutiny, especially in the US and Europe, which could complicate any attempt to acquire majority control of Ubisoft.
Guillemot Family: The founding family might be interested in reclaiming greater control of Ubisoft and steering it in a new direction. To finance the buyout, they could collaborate with a private equity firm or a strategic investor. However, given Ubisoft's current size and the significant cost associated with a buyout, it could be difficult for the Guillemot family to pursue this path on their own.
Other Potential Investors: Private equity firms or strategic investors within the gaming sector might also join a buyout consortium. These investors could be drawn to Ubisoft’s valuable intellectual property (IP) and see potential for a turnaround under new leadership.
Gaming Companies: Besides Tencent, the largest gaming revenue players in 2023 are highlighted in the visual.
-Apple and Google: Although both tech giants have been expanding into gaming, acquiring Ubisoft seems unlikely given their current antitrust scrutiny.
-NetEase, EA, and TakeTwo: These companies would find an Ubisoft acquisition to be a straightforward studio consolidation. NetEase, in particular, might find it appealing to broaden its console and PC presence in the West, but Tencent’s involvement could complicate this.
-Sony and Microsoft: As first-party publishers, both would benefit from boosting their subscription services with exclusive content. They’ve aggressively acquired studios in recent years. Given that the Activision Blizzard deal was approved, there’s no reason a Ubisoft acquisition couldn’t pass as well. In their latest fiscal year, gaming accounted for 32% of Sony’s revenue and less than 9% of Microsoft’s.
3. IP Gold Rush
In the gaming industry, intellectual property (IP) is crucial. Iconic franchises like *Call of Duty*, *Mario*, and *Grand Theft Auto* are multi-billion-dollar assets that significantly impact a company’s future. As a result, many companies are eager to acquire established IPs or gain access to the teams behind them.
Why is IP so valuable?
-Lower risk: Developing a new AAA game can cost hundreds of millions and take years, with no guarantee of success. Acquiring a popular IP allows companies to tap into an existing fanbase and reduces the risk of failure.
-Brand power: Consumers are more inclined to purchase games with familiar characters, worlds, or studios behind them. Well-known creators like Hideo Kojima (*Metal Gear*) and Hidetaka Miyazaki (*Elden Ring*) are just as significant.
-Content scalability: Famous IPs can generate revenue through sequels, spin-offs, and licensing deals. Large publishers have the infrastructure to maximize returns across multiple channels.
This strategy isn’t unique to gaming. Media giants follow similar patterns:
-Amazon’s acquisition of MGM: In 2021, Amazon acquired MGM for $8.5 billion, gaining access to franchises like *James Bond* to enhance its Prime Video content.
-Disney’s acquisition of Lucasfilm and Marvel: These acquisitions have delivered massive returns through movies, TV series, and licensing opportunities.
Why now?
-Consolidation pressure: Subscription services and cross-platform gaming are driving consolidation. Big companies want to secure valuable IPs to differentiate their services and attract loyal customers. Meanwhile, smaller studios are more open to selling early to avoid competing in an increasingly crowded and capital-intensive market.
-Value in ownership: Owning IPs in gaming allows companies to create expansive worlds and engage players long-term through updates, expansions, and live services. This keeps players coming back and generates recurring revenue, which is harder to achieve in video content.
-Cross media expansion: Popular games can expand into movies, TV series, or theme parks. For instance, *The Last of Us* became a hit HBO show, and Sony is developing TV adaptations for Horizon Zero Dawn and God of War. This leads to more revenue, a broader audience, and long-lasting IP appeal.
The Ubisoft Angle
Ubisoft’s IPs, like *Assassin’s Creed*, *Far Cry*, and *Tom Clancy’s Rainbow Six*, have significant potential for future growth, despite recent struggles. However, realizing that potential might require new leadership or a fresh strategy, which a new owner could provide.
Even though Ubisoft faces challenges, its strong portfolio might attract various buyers. For the right acquirer, Ubisoft's problems could represent a chance to buy low and rework its creative direction.
As more studios seek to hedge their risks in this changing industry, we can expect more mergers and acquisitions (M&A) in the future.
4. The Future of Gaming M&A
The gaming industry is constantly evolving, and several trends are fueling a surge in mergers and acquisitions:
-Mobile-first: Mobile gaming is the largest and fastest-growing segment, making companies with a strong mobile presence attractive. Examples include Playrix (Gardenscapes,Homescapes) and Scopely (MONOPOLY GO!,Stumble Guys)
-Cross-platform: Cross-platform play is becoming the standard, and companies with expertise in this area are in high demand. Unity and Epic Games play vital roles with their popular game engines, while major studios are also building in-house solutions.
- Cloud gaming: Still in its early stages, cloud gaming has the potential to revolutionize how games are played. Companies with cloud infrastructure are becoming more valuable, with leaders like Microsoft (Game Pass Ultimate), Sony (PlayStation Plus Premium), and NVIDIA (GeForce Now) pushing the trend.
-Metaverse: Beyond AR/VR, virtual worlds like *Roblox* and *Fortnite* have created immersive, social spaces that keep players engaged beyond traditional gameplay. Companies developing these experiences are attractive targets for firms looking to capitalize on this trend.
-Web3 & Blockchain: Web3 games enable decentralized ownership and in-game economies powered by blockchain. This trend lets players own and trade digital assets, opening new revenue streams and drawing interest from companies exploring the intersection of gaming and crypto.
-AI driven studios: AI is already influencing game development, and its role will only grow. Companies with AI expertise, particularly in game design and player behavior analysis, are becoming highly sought after. As AI reduces development costs, budgets could shift towards live services and marketing.
The Big Picture
The gaming industry is consolidating, with major players acquiring valuable studios and IPs. While there will always be space for indie games—especially as AI lowers the barrier to entry—industry consolidation will likely strengthen the top companies and leave less room for those in the middle.
If a company like Ubisoft, valued at over $12 billion in 2021, is struggling to survive on its own, the future looks bleak for many smaller studios

Tesla’s Autonomous AmbitionsMusk’s Vision vs. Reality: Tesla’s Path to Revolutionizing Transportation
Tesla recently experienced its best trading day since 2013, with the stock soaring 23% following the release of its Q3 earnings report. While the financial results were solid, investors are largely drawn to Elon Musk’s ambitious vision for autonomy a vision that presents significant challenges but holds substantial potential
Tesla’s rebound in deliveries, higher profit margins, and an unexpected forecast projecting 20% to 30% sales growth for next year reinvigorated investor confidence after a somewhat muted response to the October 10th 'We, Robot' event
The event showcased new products like the highly anticipated Cybercab (robotaxi) and Optimus (a humanoid robot) Despite the excitement, the presentation lacked detailed information, causing Tesla’s stock to decline by nearly 10% the following day
Despite being over 20 years old, the investment appeal of Tesla is still driven more by its future potential than its current state. Musk envisions mass-producing autonomous vehicles and robots, aspiring to make Tesla the largest company globally. Traditional valuation models based on recent performance can’t fully capture this long term vision
Tesla’s journey can’t be understood in isolation
Just three days after the 'We, Robot' event, SpaceX successfully launched its Starship spacecraft for the fifth time. The SpaceX “chopsticks” system successfully caught the Super Heavy booster after liftoff a crucial step toward making the booster completely reusable. This breakthrough could transform space travel by significantly reducing turnaround times and reshaping cost structures.
Elon Musk, at the helm of both Tesla and SpaceX, has a talent for transforming bold ideas into reality. SpaceX’s success in making rockets reusable has drastically reduced the cost of space travel, demonstrating that affordability can drive broader adoption.
This strategy mirrors Tesla’s vision for autonomous vehicles: by creating self-driving cars like the Cybercab, Tesla aims to reshape transportation with similar cost-efficiency principles. However, as with any disruptive technology, the range of possible outcomes is vast.
A balanced perspective considers Musk’s track record while acknowledging that his timelines can often be highly optimistic.
In 2021, Benedict Evans described Musk as “a bullshitter who delivers.” Whether Tesla’s vision for full autonomy will come to fruition remains uncertain, and fully autonomous fleets could still be years away. Nonetheless, Musk’s accomplishments with SpaceX add weight to Tesla’s ambitions, granting him credibility in the eyes of many.
The question remains: Will Musk’s ambitious autonomy vision fully take shape?
Today’s highlights:
- Tesla Q3 FY24 Results
- Key takeaways from the 'We, Robot' event
- Notable quotes from the earnings call
- Insights on Waymo, Uber, and the future of ridesharing
Tesla Q3 FY24 Overview
Tesla’s revenue is primarily generated from three segments
1. Automotive (80% of revenue): This includes the sale of electric vehicles, such as models S, 3, X, Y, and the Cybertruck.
2. Services and Other (11% of revenue): This segment encompasses vehicle services, the Supercharger network, and sales of automotive parts and accessories.
3.Energy Generation and Storage (9% of revenue): Revenue from solar products and energy storage solutions like the Solar Roof and Powerwall.
Key Metrics for Q3 FY24:
-Production: 470,000 vehicles produced (+9% YoY, +14% QoQ).
-Deliveries: 463,000 vehicles delivered (+6% YoY, +4% QoQ), which was slightly below analysts’ expectations of 464,000 and fell short of the Q4 2023 record of 484,000 deliveries. Despite price cuts over the last two years, Tesla’s auto sales growth has leveled off.
Financial Highlights:
-Revenue: $25.2 billion, an 8% YoY increase but fell short of expectations by $0.5 billion.
-Gross Margin: 20% (+2 percentage points QoQ and YoY).
-Operating Margin: 11% (+5 percentage points QoQ, +3 percentage points YoY).
-Adjusted EPS: $0.72, beating estimates by $0.12.
Gross Margin Insights:
-Automotive Gross Margin: 17% (excluding regulatory credits), up from 15% in Q2 and 16% a year earlier. The cost per vehicle dropped to an all-time low of $35,100. Notably, the Cybertruck achieved a positive gross margin for the first time. The automotive segment included $326 million in software revenue.
-Services and Other Gross Margin: Reached 9%, marking the 10th consecutive quarter of positive margins and a new record high.
-Energy Generation and Storage Gross Margin: The highest margin segment at 31%, also hitting a record high.
Overall, while Tesla faced some delivery shortfalls and plateauing auto sales, it managed to improve profitability across its segments, with key milestones in cost reductions and positive trends in gross margins.
Tesla’s Margins and Cash Flow Performance
Tesla’s industry-leading margins are driven by three major advantages:
1.Economies of Scale: Achieved through its expansive gigafactories.
2.Direct-to-Consumer Sales**: Tesla sells directly online and through its showrooms, bypassing traditional dealership networks.
3.Low Marketing Costs: Tesla spends very little on advertising compared to traditional automakers.
While Tesla expects its margins to expand over time due to growth in its non-automotive segments and software sales, its automotive margins have been pressured by price cuts in the last two years to sustain demand.
Cash Flow Highlights:
-Operating Cash Flow**: Increased by 89%, reaching $6.3 billion
-Free Cash Flow**: Jumped by 223%, hitting $2.7 billion
These cash flow figures stood out in the quarterly report, demonstrating Tesla’s ability to fund its ambitious plans for autonomy despite heavy investments in AI.
Guidance
1.FY24 Improvement: Tesla now expects slight growth in vehicle deliveries for FY24 (previous guidance indicated “notably lower” growth), implying a record-setting Q4 to make up for a weaker first half. Energy storage deployment is projected to more than double.
2.FY25 Outlook Surprise: During the earnings call, Musk forecasted 20% to 30% delivery growth in FY25, surpassing market expectations. A new, more affordable model is anticipated to launch in the first half of FY25, potentially easing investor concerns about competition.
3.New Product Strategy: The upcoming affordable vehicles in 2025 will be based on Tesla’s existing platform, indicating less dramatic cost reductions than previously suggested. However, the Robotaxi will bring a fresh manufacturing strategy.
Key Takeaways
1.Volumes Rebounded: After a 7% decline in deliveries during the first half of 2024, volumes recovered in Q3. Prices have stabilized, and Tesla’s focus on reducing unit costs contributed to improved automotive gross margins. Management’s priorities remain on unit volume and maintaining low inventory levels.
2.More than Just EVs: Non-automotive segments, such as Energy and Services, accounted for 20% of Tesla’s revenue this quarter, up from 16% a year ago. Likewise, these segments contributed about 20% of Tesla’s gross margin, nearly double from the previous year. As these segments grow, their impact on Tesla’s profitability will become increasingly significant.
3.Operating Margin Gains: Improved by 3 percentage points year-over-year:
-Negative Impact: Price cuts, mainly due to financing incentives.
-Positive Impact**: Lower costs per vehicle, growth in non-auto segments, FSD revenue, increased deliveries, and higher regulatory credit revenue.
4.Free Cash Flow Surge: Doubled sequentially to $2.7 billion. Capital expenditures increased by 43% to $3.5 billion, largely driven by investments in AI infrastructure. Tesla plans to spend over $10 billion on AI this year.
5.Strong Balance Sheet: Tesla maintains a net cash position of nearly $30 billion, which management believes provides ample liquidity to support its product roadmap and sustain positive cash flow margins.
We, Robot’ Event Takeaways
Key insights from the recent announcements include:
- Cybercab (Robotaxi): Tesla introduced the much-awaited Cybercab, a sleek two-seater, but key technical details—such as sensor configurations and processing capabilities—were notably absent. Musk’s decision to forgo lidar technology, a feature commonly used by competitors like Waymo, could potentially raise regulatory concerns about safety and compliance.
1.Optimus (Humanoid Robot): While the Optimus robots were a hit at the event, performing tasks like serving drinks and dancing, this entertaining display overshadowed the reality of how far the technology is from practical use. Reports indicated that the robots were primarily operated by humans, raising questions about their actual autonomous capabilities and readiness for industrial applications.
2.Robovan: A surprise announcement was the debut of the Robovan, a versatile vehicle intended for both mass transit and cargo transport. Its stylish Art Deco-inspired design drew attention, but like the Cybercab, it lacked concrete details or technical insights to convince analysts that the product is close to entering production. The presentation didn’t provide enough information to quell investor skepticism about its feasibility.
3. Full Self-Driving (FSD) Progress: Elon Musk projected that Tesla’s FSD technology would achieve full autonomy by 2026, with the Cybercab and current models (like the Model 3 and Model Y) spearheading this effort in Texas and California. However, Musk’s history of ambitious FSD promises has been met with ongoing skepticism, and this presentation did little to change that. No new safety data or significant updates were provided to address reliability concerns, leaving regulatory and safety issues unresolved. Tesla still faces significant challenges in proving its FSD capabilities are ready for public use without human oversight and in obtaining regulatory approval at both federal and state levels.
4.Market Reaction: Analysts expressed mixed feelings about the event. While some found the futuristic concepts inspiring, others noted the lack of substantial progress and the vague nature of Musk’s promises. This left investors questioning how close Tesla truly is to achieving its autonomy and robotics goals. For many, the event leaned more towards spectacle than solid evidence of progress.
Shareholder Deck Updates
1.Supercharger Network: Tesla’s Supercharger Network received widespread industry support, with most automakers now adopting Tesla’s North American Charging Standard (NACS). This acceptance is likely to boost Tesla’s Services segment and improve its margins in the long term. The number of Supercharger stations increased by 20% year-over-year to 6,706. Tesla also rehired some of the nearly 500 Supercharger team members who had been laid off earlier in the year, indicating renewed focus on this segment.
2.Market Share: Tesla’s market share remained steady in North America and Europe on a sequential basis, but saw a noticeable improvement in China, signaling stronger competitiveness in the region.
These details paint a picture of a company with promising ambitions but facing significant challenges in bringing its bold visions to reality. Investors will be watching closely for concrete progress and clearer timelines moving forward.
Key Updates from the Earnings Call
Full Self-Driving (FSD) Progress
- Tesla has surpassed 2 billion miles driven using its FSD (supervised) technology, which forms a core part of the company’s data advantage. This milestone underpins Tesla’s long-term autonomy thesis. Additionally, Tesla launched **FSD version 12.5** and introduced the Actually Smart Summon feature, enabling vehicles to autonomously drive to their owners in parking lots.
AI Training Capacity
- Musk shared that Tesla expects to have **nearly 90,000 H100 clusters dedicated to AI training** by the end of the year, enhancing the company’s machine learning capabilities.
Energy Storage Deployments
- Tesla deployed **6.9 GWh of energy storage** in Q3, although this fell short of the record 9.4 GWh achieved in Q2. The 40 GWh Megafactory in Lathrop is ramping up production, reaching 200 Megapacks in a single week. The **Shanghai Megafactory** is set to start shipping Megapacks in Q1 2025 with a run rate of 20 GWh. Tesla noted that energy deployments are inherently lumpy due to factors such as customer readiness and geographic order locations.
Key Quotes from the Earnings Call
Elon on the Cybercab:
- “I do feel confident of Cybercab reaching volume production in ‘26. We’re aiming for at least 2 million units a year, maybe 4 million ultimately.”
Musk envisions the Cybercab becoming a global, high-volume autonomous vehicle service. However, achieving this scale requires overcoming two major challenges: delivering level 5 autonomy at a competitive cost and navigating regulatory approval across regions with varying laws, road conditions, and weather considerations.
- Musk also dismissed the notion of a regular low-cost model, stating, “I think having a regular $ 25,000 model* is pointless.” He emphasized focusing on the Cybercab as a generational leap forward.
Musk on FSD:
- “Our internal estimate is **Q2 of next year** to be safer than human and then to continue with rapid improvements thereafter.”
He expressed confidence that full autonomy could be achieved in 2025 with existing vehicle models, although regulatory hurdles and safety standards remain significant barriers.
On Tesla’s Ridesharing App
- Tesla is already testing a *ridesharing capability* in the Bay Area for employees, with safety drivers currently in place. Musk anticipates launching the service for the public in California and Texas next year, pending regulatory approval. He added, “**I’d be shocked if we don’t get approval next year**,” but acknowledged that regulatory timelines are out of Tesla’s control.
Musk on Optimus:
- “We’re the only company that really has all of the ingredients necessary to scale humanoid robots.” He believes that the *Optimus robot* could become the “most valuable product ever made,” owing to Tesla’s combined AI and manufacturing advantages. However, the product remains at an early development stage and will likely take years to fully commercialize.
On Tesla’s Valuation:
- Musk reiterated his bold prediction: “Tesla will become the most valuable company in the world and probably by a long shot” He argued that Tesla’s strategic focus on future advancements in energy, transport, robotics, and AI sets it apart from competitors who are only targeting short-term trends.
Waymo, Uber, and Rideshare Future
There are two distinct paths to achieving full autonomy
1.Waymo’s Approach: Waymo focuses on highly structured, geo-fenced environments with extensive pre-mapping and sensor-based systems like lidar to ensure safety.
2.Tesla’s Approach: Tesla aims to develop a generalized self-driving system that works with computer vision and AI, relying on its fleet’s extensive data advantage and scaling software improvements. However, Tesla’s reluctance to use lidar technology and regulatory challenges could hinder its timeline for achieving level 5 autonomy.
These differing strategies highlight the varied paths to delivering a future of autonomous transportation, with each approach facing unique technical and regulatory hurdles.
Levels of Autonomy
- Tesla's FSD (Supervised): Tesla’s Full Self-Driving system remains at **Level 2**, meaning it still requires driver supervision to operate. In contrast, **Waymo** operates at **Level 4** in certain cities, where its vehicles can drive without human intervention, albeit under specific conditions.
-Jumping Levels: Musk’s vision for the Cybercab aims to skip from Level 2 to **Level 5 autonomy**, which implies no need for human input at all—a huge leap.
Technology Approach
-Tesla’s Strategy: Tesla relies on a **camera and AI-only approach**, focusing on software and data scalability rather than expensive hardware. Musk’s bet is that advanced software can eventually solve all driving scenarios.
- Waymo’s Strategy: Waymo uses a **hardware-intensive model** with a combination of LiDAR, radar, and cameras**, providing highly precise navigation. However, the reliance on multiple sensors leads to higher production costs per vehicle, around **$200,000** each.
Scaling Challenges
-Waymo’s Limitation: The high cost of Waymo's vehicles has hindered its ability to scale quickly, while Tesla plans to leverage its extensive fleet data to improve its autonomous systems over time.
-Tesla’s Repeated Delays: Despite its aspirations, Tesla’s full autonomy timeline has faced numerous delays. Scaling quickly while achieving robust and safe autonomy remains a significant challenge for the company.
Safety and Regulation
-Waymo’s Approach: Waymo has built trust with regulators by deploying vehicles cautiously in select cities and prioritizing safety, but its operations remain limited geographically.
-Tesla’s Regulatory Hurdles: The Cybercab’s design lacks traditional controls like steering wheels and pedals, raising concerns about regulatory approval. These changes could face substantial scrutiny, particularly if safety standards require features Tesla’s design omits.
Tesla and Uber: Competitors or Partners?
-Potential Partnership: Uber CEO Dara Khosrowshahi found the Cybercab vision "pretty compelling" and didn’t dismiss the possibility of a collaboration. Uber already partners with Waymo to offer autonomous rides in cities like **Phoenix, Atlanta, and Austin**. Khosrowshahi’s openness to partnership means there’s potential for Tesla's Cybercab fleet owners to list their vehicles on Uber to boost earnings.
-Hybrid Model: By leveraging Uber’s vast network, Tesla could quickly gain scale in local markets, especially given Uber’s capability to serve diverse customer needs. This could lead to a hybrid model where Tesla’s autonomous vehicles are available on Uber alongside other options.
Regulatory Challenges: An Obstacle to Elon’s Vision ?
-Waymo’s Critique: Former Waymo CEO John Krafcik criticized the Cybercab, highlighting its impracticality for a large-scale robotaxi business. Waymo’s approach focuses on accessibility and safety with taller vehicles and high-mounted sensors, whereas Tesla’s design was light on crucial technical details.
-Possible Lidar Mandate: Krafcik also noted that if regulators eventually require LiDAR technology for safety compliance, Tesla’s camera-only approach could face a significant setback. Regulatory decisions are beyond Tesla’s control and could fundamentally reshape its autonomy strategy.
-Musk’s Political Maneuvering: Musk’s political activities and controversies could complicate Tesla’s regulatory relations. Building strong connections with regulators is critical, given their power to greenlight or halt the Cybercab’s deployment.
Final Thoughts
The coming years will be pivotal for Tesla as it strives to overcome both techno logical and regulatory challenges. The success of Tesla’s autonomy plans hinges not just on its technological progress but also on its ability to navigate complex and varied regulatory frameworks worldwide. Whether Musk’s bold vision for full autonomy becomes a realityor remains a distant dream will depend on a combination of innovative breakthroughs and the company’s capacity to gain and maintain regulatory approval.
Are you Moonish on Tesla or not?

Why Alibaba is the Top Stock to Buy. Long-Term Investment 2025A very strong weekly demand imbalance at $85 took control on Alibaba NYSE:BABA Chinese E-commerce giant. Expecting a decent rally in 2024 and 2025. Long-term swing trade investment trade idea.

NVDA | Unpacking NVIDIA’s Q3 FY25Building the Matrix, One GPU at a Time
This week, NVIDIA unveiled its October quarter results, capturing global attention as analysts closely monitored the stock's movements. While Wall Street often emphasizes short-term performance, a broader perspective highlights NVIDIA's remarkable rise. Over two years, its stock value has multiplied tenfold, outpacing tech giants like Alphabet and Amazon in profitability and edging closer to Microsoft and Apple in net income—a meteoric ascent for the history books.
The AI Inflection Point
NVIDIA's transformation began in November 2022 when OpenAI launched ChatGPT, described by CEO Jensen Huang as AI's "iPhone moment." Fast-forward two years, and NVIDIA's latest Blackwell GPU architecture is scaling up production, meeting surging demand. As Huang explained, "The age of AI is in full steam," driven by foundational model training and inference advancements. Two major trends underpin this shift:
-Platform evolution:Transitioning from traditional coding to machine learning.
-Emergence of AI factories:New industries powered by generative AI applications.
AI native startups are booming, and successful inference services are proliferating. If AI's trajectory mirrors the mobile revolution, this is akin to 2009 a pivotal moment with much more innovation ahead.
Q3 FY25 Highlights
NVIDIA's fiscal year ends in January, and the recently concluded October quarter (Q3 FY25) demonstrated strong momentum:
- Revenue: $35.1 billion (+17% quarter-over-quarter), exceeding expectations by $2 billion.
- Segment growth:**
- Data Center: +17% QoQ ($30.8 billion).
- Gaming: +14% QoQ ($3.3 billion).
- Automotive: +30% QoQ ($0.4 billion).
- Margins: Gross margin at 75%, operating margin at 62%.
- Cash flow: Operating cash flow of $17.6 billion; free cash flow of $16.8 billion.
- Q4 FY25 Guidance: Anticipates +7% revenue growth ($37.5 billion).
Key Drivers and Insights
-Data Center Dominance:Contributing 88% of overall revenue, driven by Hopper GPUs and the anticipated Blackwell production ramp.
-Gaming Growth:Propelled by GeForce RTX GPU demand and back-to-school sales.
-Automotive Innovation:Growth fueled by AI-powered autonomous driving solutions.
-Margins:Slight compression due to Blackwell production ramp, with recovery expected as production scales.
Looking ahead, demand for NVIDIA's Hopper and Blackwell GPUs outpaces supply, likely remaining constrained into FY26. However, challenges loom, including intensifying competition from AMD and custom AI chips.
The AI Scaling Debate
Skeptics argue AI scalability may be approaching its limits, but Huang is optimistic, citing advancements in reinforcement learning and inference-time scaling. He emphasized that AI's growth is driven by empirical laws, suggesting scalability could be extended through methods like post-training and test-time scaling.
CEO and CFO Perspectives
- Huang likens modern data centers to "AI factories," producing intelligence like power plants generate electricity.
- The shift to "physical AI" unlocks applications in industrial and robotics sectors, powered by NVIDIA's Omniverse.
- Blackwell GPUs are delivering significant cost reductions and accelerating AI workloads.
Investment Outlook
Despite valuation concerns, NVIDIA's profitability is tangible. However, the company's reliance on sustained GPU demand and a concentrated customer base presents risks. Meanwhile, competition from AMD is intensifying.
Final Thoughts
If ChatGPT was AI's "iPhone moment," the transformation is just beginning. Like the app economy in 2009, the AI-first revolution is poised to unlock entirely new markets and reshape industries. NVIDIA's leadership positions it at the forefront of this multi-trillion-dollar opportunity.

Analysis of Moving average stock (26/Nov/2024)Analysis of Moving average stock (25/Nov/2024)
follow for more updates and information
Understanding and analysing moving averages is vital when executing technical analysis on stocks and finding ideal stocks to invest in that match the investment strategy. However, finding stocks that fulfil the set moving average criteria is difficult as it requires taking stocks individually and determining if their moving average matches the criteria included in the investment strategy. The process is highly time-consuming and may lead to manual errors, forcing investors to make the wrong investment decisions.
A moving average screener is an ideal tool that assists investors in filtering thousands of stocks based on their moving averages to produce a list of stocks that have the same moving averages as the criteria set by the user. Investors can customise moving average stock screeners to meet specific criteria based on the trader's or investor's preferences. For example, some traders may use moving average crossovers to identify entry and exit points in a trade, while others may use moving average trends to identify long-term investment opportunities. However, investors must use the screeners along with other technical indicators and tools to make informed investment decisions.

3 Stocks in ACCUMULATION Phase | STOCKS | BABA, HOOD, PYPLIf you have patience, stock trading can be very rewarding.
Something a little different today - SOCKS ! 🧦 These are my top 3 picks for stocks at the moments - for the sake of duration, we'll look at 3 per video.
What I look for in stocks, is longer term holds. Ideally they must be in accumulation phase, or have just broken out of my ideal buy zone.
_____________________
NYSE:BABA NASDAQ:HOOD NASDAQ:PYPL

AT&T strong bullish expectations here
AT&T zone breaked, in last periods bearish market, now what we can expect is change in this market,- strong indications for bullish continuation.
TP1: 25
TP2: 28

PAIN REFORM Breakout Trade in Action!PAIN REFORM Trade Details:
A breakout in Pain Reform on the daily timeframe offers a promising long trade setup using the Risological swing trading indicator . Entry levels have been clearly identified, and the stock shows strong bullish momentum as it heads towards its profit targets.
Key Levels:
Entry: 1.32
Stop Loss (SL): 0.88
Take Profit Targets:
TP1: 1.88
TP2: 2.77
TP3: 3.66
TP4: 4.21
PAIN REFORM Analysis:
The chart signals a strong trend reversal, with the breakout confirming bullish sentiment. The risk-to-reward ratio appears favorable for this trade setup, and the stock is poised for further gains as it moves towards higher targets.
Outlook:
Monitor closely for momentum follow-through. With a robust breakout, the targets look achievable given sustained market interest and volume spikes.
Stay disciplined with stops to lock in profits!

Aclaris Rockets 300%, Smashes Targets!ACRIS (1D TF): Targets Smashed with 300% Gains!
Trade Details:
The long trade setup on the daily timeframe has exceeded expectations, blasting past all profit targets using the Risological Trading Indicator . The stock has delivered an impressive 300% gain, outperforming initial forecasts.
Key Levels:
Entry: 1.20
Stop Loss (SL): 1.16
Take Profit Targets:
TP1: 1.25 ✅
TP2: 1.32 ✅
TP3: 1.40 ✅
TP4: 1.45 ✅
Analysis:
This massive rally showcases strong bullish momentum, driven by high market interest. With such a breakout, Aclaris demonstrates its potential as a high-performing asset.
Outlook:
Momentum traders can consider monitoring for retracements or further bullish setups. A stellar move like this reinforces the power of spotting trends early!

MTARTECH Surges! Long Trade Hits All TargetsMTAR Technologies (15-Minute Timeframe): All Targets Hit!
Trade Details:
A textbook long trade setup on the 15-minute timeframe, perfectly executed using the Risological Trading Indicator . The trade delivered outstanding results with all targets achieved.
Key Levels:
Entry: 1583.90
Stop Loss (SL): 1570.45
Take Profit Targets:
TP1: 1600.50
TP2: 1627.35
TP3: 1654.25
TP4: 1670.85
Performance Analysis:
The strong uptrend, confirmed by moving averages and consistent bullish momentum, aligned with the indicator’s signals. The precise entry point and systematic target levels ensured maximum profit extraction.
Trade Outcome:
Every profit target was hit, reflecting the robustness of the strategy. Traders capitalized on a swift and powerful move, making this trade a standout performer.
Stay tuned for more opportunities like this with the Risological Indicator!

JINDAL WORLDWIDE - Massive Intraday LONG TradeJINDAL WORLDWIDE (15-Minute Timeframe) - Massive Long Trade Secured
Trade Setup:
A powerful bullish breakout captured on the 15-minute timeframe using the Risological Trading Indicator. This trade highlights an impressive rally with all targets hit.
Key Levels:
Entry: 282.75
Stop Loss (SL): 278.30
Take Profit Targets:
TP1: 288.20
TP2: 297.00
TP3: 305.85
TP4: 311.30
Technical Overview:
The price action reflects strong bullish momentum, supported by upward-trending moving averages and consistent buying pressure.
The Risological Indicator provided a timely entry signal, capitalizing on this rapid uptrend.
Results:
The trade successfully achieved all profit targets, delivering substantial gains for intraday traders. The well-defined stop-loss ensured controlled risk, allowing traders to maximize their returns.
Insight:
This trade underscores the effectiveness of the Risological Indicator in identifying high-probability entries and exits in dynamic market conditions.
Keep monitoring for further setups!

GARWARE New Short Trade OpportunityGARWARE TECH (15-Minute Timeframe) - Short Trade Opportunity
Trade Setup:
A clear short trade setup has emerged on the 15-minute timeframe for Garware Tech using the Risological swing trading indicator . The entry signal indicates a strong bearish move, supported by the break below key support levels.
Key Levels:
Entry: 4419.05
Stop Loss (SL): 4602.05
Take Profit Targets:
TP1: 4192.90
TP2: 3827.00
TP3: 3461.05
TP4: 3234.90
Technical Indicators:
The bearish crossover and the downward trajectory of the moving averages highlight the weakening momentum. The Risological Swing Trader Indicator confirms a high-confidence short entry with well-defined targets.
Strategy Note:
Traders are advised to monitor price action near TP1 and TP2 for potential retracements. Adjust stop-loss levels dynamically as the trade progresses to protect profits.
This short trade setup offers a promising risk-reward ratio for intraday traders! Stay disciplined and let the technicals lead the way.

ARIES AGRO: 50% Profit in Intraday TradeARIES AGRO (15-Minute Timeframe) - Intraday Sensation!
Trade Overview:
Aries Agro delivers a phenomenal intraday performance, achieving a 50% gain with 5x margin trading. All targets are marked with clear progression on the chart using the Risological trading indicator.
Key Levels:
Entry: 283.40
Stop Loss (SL): 281.75
Take Profit Targets:
TP1: 285.35
TP2: 288.60
TP3: 291.80
TP4: 293.80
Technical Insight:
The price rallied sharply, riding strong bullish momentum, with each target systematically achieved.
The Risological Swing Trader Indicator confirmed the long trade setup early, providing a low-risk, high-reward opportunity.
The upward slope of the moving averages added further confidence to the bullish scenario.
Strategy Tip:
Intraday traders using margin positions are advised to monitor momentum near TP4 for potential reversals or consolidation. Always ensure disciplined stop-loss placement.
A true powerhouse intraday trade — Aries Agro showcases the magic of leveraged trading!

NTDOY | NINTENDO & Nintendo Switch 2 🍄The next Nintendo console might arrive in 2024
Nintendo has reportedly demonstrated the Nintendo Switch 2 behind closed doors at Gamescom last month.some trusted developers got an early look at the Switch 2 and some tech demos of how games run on the unannounced system.
There was reportedly a demo of an improved version of Zelda: Breath of the Wild that’s designed to run on the more advanced hardware inside the Nintendo Switch 2, VGC corroborated the claims and revealed that Nintendo also showcased Epic Games’ The Matrix Awakens Unreal Engine 5 tech demo running on the type of hardware Nintendo is targeting for its next console. The demo reportedly used Nvidia’s DLSS upscaling technology with ray tracing enabled, suggesting Nintendo and Nvidia are working on a significant chip upgrade for this next-gen console. in July that a new Nintendo Switch is being planned for a 2024 release.
With 43 years of making immensely popular video games under its belt, you'd think that the video game pioneers at Nintendo probably have the business of success fully figured out.
But companies must change with the times and, according to Nintendo of America president Doug Bowser, that means finding a way to engage people with the legacy brand that might never pick up a video game controller.
Bowser spoke about what the company learned this year during the Nintendo Live event in Seattle, Wa. on Sept 1, referencing the enormous box office success of the "The Super Mario Bros. Movie" as one of its key indicators that Nintendo has the ability to reach an audience beyond those that naturally reach for a controller.
"We launched The Super Mario Bros. Movie, which very quickly became the second-largest box office grossing animated film of all time at $1.3 billion," Bowser said. "We launched The Legend of Zelda: Tears of the Kingdom, which, 18 million units later after a very brief period of time, it's one of our fastest launch titles ever, and then the event today. So it's really this drumbeat of activities, entertainment-based activities where we're trying to find ways to continue to introduce more and more people, not just players, but people to Nintendo IP… So that's what we're excited about."
Bowser also spoke about the launch of Super Nintendo World at Universal Hollywood, which delivered an impressive 25% bump to Comcast's Q1 earnings this year.
"And if I think about folding into the bigger strategy, this year has really been a very unique, and I dare say banner year for Nintendo in a lot of ways," Bowser said.Nintendo also continues to benefit from the sales of its aging Nintendo Switch console, with 129.53 million units sold worldwide. That makes it the company's second best-selling console of all time, right behind the handheld Nintendo DS, which sold 154.2 million units before it was discontinued in 2014.
The success of "The Super Mario Bros. Movie" drove rumors that another big feature film based on Nintendo's flagship Legend of Zelda series was coming as well, but Nintendo hasn't made a formal announcement about that ... yet.
Gaming is in the midst of an M&A arms race. The protracted pandemic has made sure of that. Companies from all sides of the market, Microsoft, Take Two, Sony to name a few, are cutting deals to secure content. The volume and scale of those deals point to where gaming is heading - the precipice of major shake-ups across its core commercial and distribution models. Microsoft's eye bulging $69 billion deal for Activision is a testament to that shift. Costly as the deal is, it's arguably a small price to pay to secure some of the biggest franchises in gaming: Call of Duty, Warcraft, Candy Crush and Overwatch. Even more so, considering those titles span a community of 400 million active monthly players. In other words, the deal is the boldest sign yet that content is the future of gaming, not consoles.
Should you invest in Nintendo?
The question comes down to whether you are willing to pay about SGX:40B for Nintendo's IP and potential earnings powers. To me, a company that continues to produce in-demand and profitable content is worth that price tag, especially after having generated a net profit of 432.7B yen, or $2.97B in FY2023. That's a P/E of about 13.5 after subtracting out Nintendo's current assets - not a hefty sum given everything Nintendo has going for it. Nintendo's strategy seems to be working, with The Super Mario Bros. Movie not only performing well on its own but also providing a boost to other Nintendo offerings. While there are concerns, there are also plenty of catalysts moving ahead. I am excited to see new Nintendo initiatives including more theatrical releases of their IP and their (positive) effects on the rest of the company's products.

Ferraci Stock $RACE swing long-term investment at weekly demandFerrari Stock NYSE:RACE swing long-term investment at weekly demand. The stock has reached a decent weekly demand level at $428 per share and it's trying to create a new bullish leg.

Key Observations on Xero's Journey🔰 ASX:XRO Key Observations on Xero's Journey
1. The Big Rally: June 2018 to February 2021
Growth: Xero experienced a significant rally, climbing 243% from around $46 to $158.
Timeframe: The rally spanned 126 weeks (882 days).
Volume: Total trading volume during this period was 361.303 million.
Key Insight: This rally followed a long consolidation phase, a typical setup for strong upward momentum in stocks.
2. Support and Resistance Levels
Support Zones:
The $100–$110 range acted as a strong support level, with the stock bouncing multiple times before moving higher.
Resistance Zones:
The $171 level became a key area of resistance during its historical highs.
Key Insight: Understanding historical support and resistance levels can help identify areas where stocks may reverse or consolidate.
🔰 Lessons from Xero's Stock Performance
Patterns Repeat, But Not Predictably
Historical performance offers valuable insights but does not guarantee future results. Always focus on the bigger picture.
Volume Confirms Strength
Rising volume during rallies can be a strong signal of market confidence, while declining volume might indicate weakening momentum.
Support and Resistance Matter
Understanding key price levels can help identify potential turning points in stock movement.
Earnings Drive Volatility
Always pay attention to earnings seasons as they historically trigger significant price movements.
🔰 Conclusion: What Can We Learn?
Xero’s historical data tells a story of growth, retracement, and strong investor interest during key phases. By analysing these patterns, investors can better understand how price, volume, and market cycles interact. However, it’s crucial to remember that past performance is not a predictor of future results.
✅ Join the Discussion
What trends or insights do you observe from Xero’s historical performance? Share your thoughts in the comments below
Disc: no holding , no recommendation to buy or sell - may buy or sell without any notification , treat this post as learning only. consult with your financial advisor before taking any financial decision
