Hindustan Unilever looks strong. Hindustan Unilever Ltd. engages in the manufacture of consumer goods. It operates through the following segments: Home Care, Beauty and Personal Care, Foods and Refreshments, and Others. It is one of leading company in FMCG sector.
Hindustan Unilever Closing price is 2453.60. Dividend Yield @CMP = 1.78%. The positive aspects of the company are Stocks Outperforming their Industry Price Change in the Quarter, Companies with Zero Promoter Pledge, Company able to generate Net Cash - Improving Net Cash Flow for last 2 years, FII / FPI or Institutions increasing their shareholding and MFs increased their shareholding last quarter. The Negative aspects of the company are high Valuation (P.E. = 53.9), Increasing Trend in Non-Core Income, Declining Revenue every quarter for the past 2 quarters and PEG greater than Industry PEG.
Entry can be taken after closing above 2460 Historical Resistance in the stock will be 2498 and 2534. PEAK Historic Resistance in the stock will be 2571 and 2601. Stop loss in the stock should be maintained at Closing below 2391 or 2369 depending upon your risk taking ability.
Disclaimer: The above information is provided for educational purpose, analysis and paper trading only. Please don't treat this as a buy or sell recommendation for the stock or index. The Techno-Funda analysis is based on data that is more than 3 months old. Supports and Resistances are determined by historic past peaks and Valley in the chart. Many other indicators and patterns like EMA, RSI, MACD, Volumes, Fibonacci, parallel channel etc. use historic data which is 3 months or older cyclical points. There is no guarantee they will work in future as markets are highly volatile and swings in prices are also due to macro and micro factors based on actions taken by the company as well as region and global events. Equity investment is subject to risks. I or my clients or family members might have positions in the stocks that we mention in our educational posts. We will not be responsible for any Profit or loss that may occur due to any financial decision taken based on any data provided in this message. Do consult your investment advisor before taking any financial decisions. Stop losses should be an important part of any investment in equity.
Stockstowatch

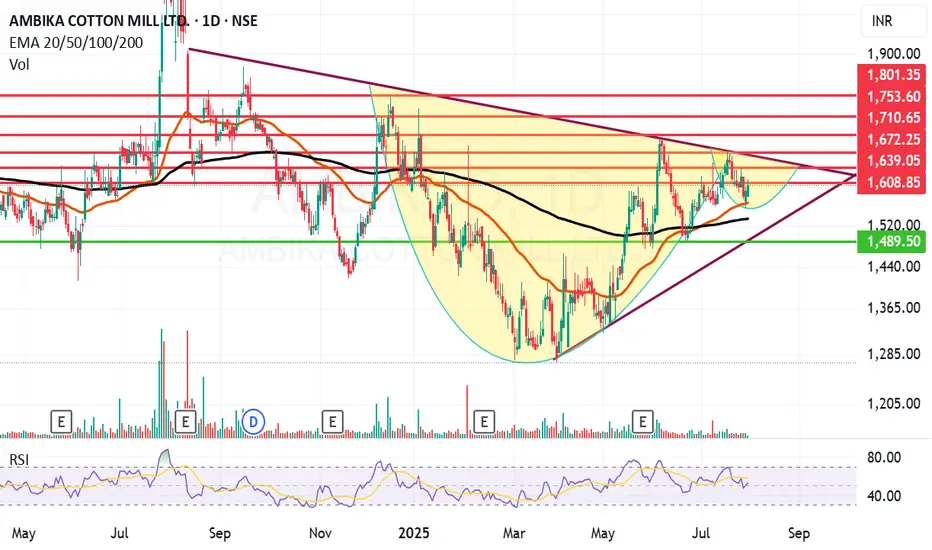
Ambika Cotton looking ambitious on the charts and fundamentally.Ambika Cotton Mills Ltd. engages in the provision of manufacturing and selling of cotton yarn catering to the needs of manufacturers of premium branded shirts and t-shirts.
Ambika Cotton Mills Ltd. Closing price is 1603.20 Dividend Yield @CMP = 2.35%. The positive aspects of the company are attractive Valuation (P.E. = 13.9), Stocks Outperforming their Industry Price Change in the Quarter, Companies with Zero Promoter Pledge, Companies with Low Debt, Rising Net Cash Flow and Cash from Operating activity and FII / FPI or Institutions increasing their shareholding. The Negative aspects of the company are Increasing Trend in Non-Core Income, Fall in Quarterly Revenue and Net Profit (YoY) and Companies with growing costs YoY for long term projects.
Entry can be taken after closing above 1609 Historical Resistance in the stock will be 1631, 1672 and 1710. PEAK Historic Resistance in the stock will be 1753 and 1801. Stop loss in the stock should be maintained at Closing below 1533 or 1489 depending upon your risk taking ability.
Disclaimer: The above information is provided for educational purpose, analysis and paper trading only. Please don't treat this as a buy or sell recommendation for the stock or index. The Techno-Funda analysis is based on data that is more than 3 months old. Supports and Resistances are determined by historic past peaks and Valley in the chart. Many other indicators and patterns like EMA, RSI, MACD, Volumes, Fibonacci, parallel channel etc. use historic data which is 3 months or older cyclical points. There is no guarantee they will work in future as markets are highly volatile and swings in prices are also due to macro and micro factors based on actions taken by the company as well as region and global events. Equity investment is subject to risks. I or my clients or family members might have positions in the stocks that we mention in our educational posts. We will not be responsible for any Profit or loss that may occur due to any financial decision taken based on any data provided in this message. Do consult your investment advisor before taking any financial decisions. Stop losses should be an important part of any investment in equity.
What to do with Reliance share after its drubbing today? Reliance looks weak post result however there is no spike in volume of sale that is a good point. The levels from which Reliance can recover seem to be 1427, 1370 or 1323. If we get a closing below 1323 the stock can fall to 1217 or even 1160 levels this is the reading as of now.
The result was looking good but on deeper scrutiny it was understood that major chunk was profit was due to sale of Reliance stake in Asian Paints business. This I think is not liked by the market specially the retail investors.
The stock has tanked close to 3% as of now but there is no huge selling seen from HNIs or MFs (As of now). (This is an assumption looking at the volume of sale) Volumes are similar to normal day of trade.
May be as retail investors panic MFs, HNIs and others might gulp the stock. Cant say clearly. We might reanalyze by end of the day but caution: Do not sell Reliance in Panic. Result was average it was not bad even if we ignore the Asian paint factor so. Currently I am not selling Reliance I am holding on to it. Might add at lower levels.
Disclaimer: The above information is provided for educational purpose, analysis and paper trading only. Please don't treat this as a buy or sell recommendation for the stock or index. The Techno-Funda analysis is based on data that is more than 3 months old. Supports and Resistances are determined by historic past peaks and Valley in the chart. Many other indicators and patterns like EMA, RSI, MACD, Volumes, Fibonacci, parallel channel etc. use historic data which is 3 months or older cyclical points. There is no guarantee they will work in future as markets are highly volatile and swings in prices are also due to macro and micro factors based on actions taken by the company as well as region and global events. Equity investment is subject to risks. I or my clients or family members might have positions in the stocks that we mention in our educational posts. We will not be responsible for any Profit or loss that may occur due to any financial decision taken based on any data provided in this message. Do consult your investment advisor before taking any financial decisions. Stop losses should be an important part of any investment in equity.

A BUY at $200?If this stock falls to $200, it's a great buy for the risk. Even a pullback to $300 would be a great return.

JUPITER WAGONS - UPTREND JUPITER WAGONS - BUY
Trade Reason :
Weekly says - Good uptrend (Higher Low) and Strong Support Level.
Market Trend Reversed - Wait for Little bit correction are Retest .
Entry - 507 Rs or Entry Now
Target - 688 Rs
Stoploss - 415 Rs
Happy Trading ...

Is it right time and choice to buy UNH Stock - {15/07/2025}Educational Analysis says that UNH Stock (USA) may give trend Trading opportunities from this range, according to my technical analysis.
Broker - NA
So, my analysis is based on a top-down approach from weekly to trend range to internal trend range.
So my analysis comprises of two structures: 1) Break of structure on weekly range and 2) Trading Range to fill the remaining fair value gap
Let's see what this Stock brings to the table for us in the future.
Please check the comment section to see how this turned out.
DISCLAIMER:-
This is not an entry signal. THIS IS FOR EDUCATIONAL PURPOSES ONLY.
I HAVE NO CONCERNS WITH YOUR PROFIT OR LOSS,
Happy Trading.

RGTI Heading to $17+ Good evening trading family
So currently due to price action it appears we are on our way to 17 dollar target however we expect a little bit of a correction at the 15 range.
However worst scenario if we go below 11 dollars be prepared for a sinker down to 8.
Trade Smarter Live Better
Kris/ Mindbloome Exchange

AAPL can we hit 260?
Appears we are making a correction down to the levels of 208 then if that does not hold 205 with a possible drive up to the 260.
Question is are we going drive deeper with the correction ?
Be Careful folks this is a wild one
Trade Smarter Live Better
Kris/Mindbloome Exchange

MSFT Correction then to 504?Morning everyone
Currently we are seeing a possible correction to the 495 zone with a possible break to the upside to 504 is what we are currently seeing.
Trade Smarter Live Better
Kris/Mindbloome Exchange

UNH How Far Down Are We Going $32 ? Based on the current class action lawsuit sentiment is negative and if it continues we can see levels of 258 being hit again. However if we break that level down then 163-150 level can possibly get hit followed by the 32-49 dollar range.
However despite all the negative news which does affect the market, if for whatever reasons we can break the high of 326 be prepared for a run up to 535 low probability but it is possible.
Trade Smarter Live Better
Kris/ Mindbloome Exchange

Uber’s Path to $95+Uber Technologies (UBER) is positioning itself for long-term growth by expanding beyond its core ride-hailing and delivery businesses into advertising, travel, service partnerships, and autonomous vehicle (AV) technology. These strategic moves aim to diversify revenue streams and enhance operational efficiency.
Key Growth Drivers:
- Strong Core Business Performance – Uber continues to benefit from robust demand in both ride-hailing and delivery, generating significant economic profit.
- Artificial Intelligence Integration – AI plays a crucial role in optimizing pricing, reducing wait times, personalizing user experiences, and preventing fraud.
- Autonomous Vehicle Expansion – Uber is increasingly leveraging AV technology to reduce driver-related costs and scale its services.
- Strategic Investments – The company is using its strong cash flow to fund innovation, product development, acquisitions, and minority investments, driving long-term value.
- Capital-Efficient Growth – Uber’s ability to expand its service platform with minimal capital investment is expected to accelerate revenue growth and shareholder value creation.
Price Target & Options Flow:
Tigress Financial has raised Uber’s price target from $103 to $110, maintaining a Buy rating. Additionally, option flow on Uber is showing strong bullish activity, suggesting institutional interest. Given this momentum, Uber could potentially surpass $95 before August, especially if AV advancements and AI-driven efficiencies continue to strengthen its financial outlook

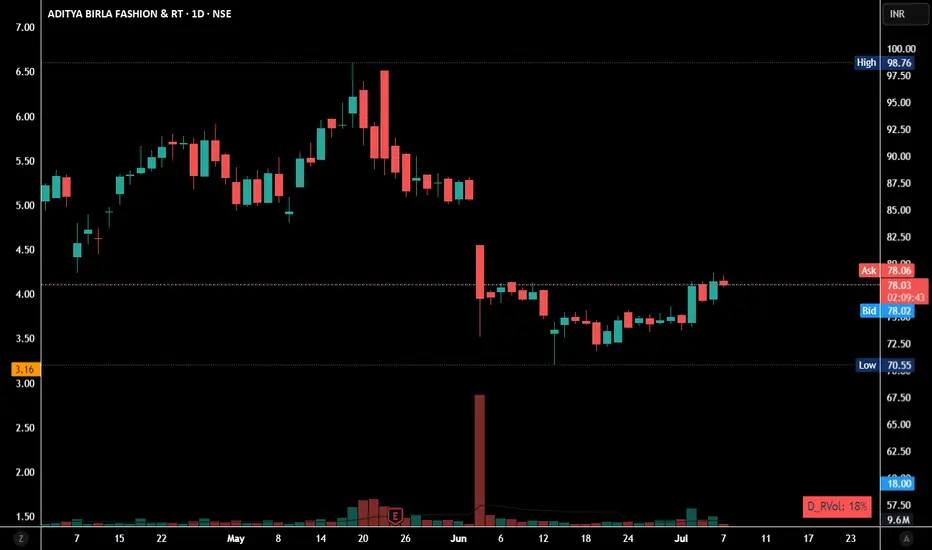
Rising Institutional Buying
Rising Institutional buying has been seen in this stock. This quarter is full of their accumulation it seems. It'll be interesting to see whether it holds 80-90 level.
Chart is for educational purpose, not a Buy/Sell Reco.
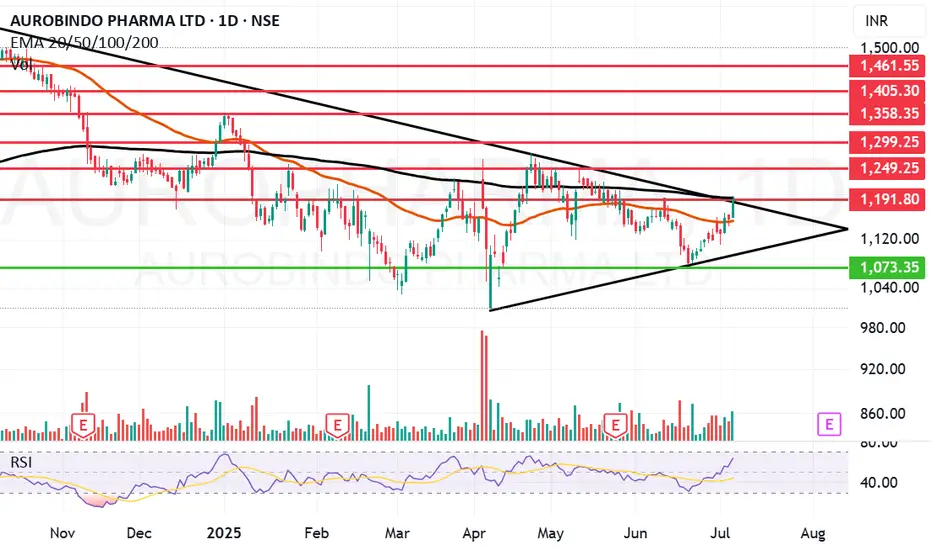
Aurobindo Pharma picking up momentum.Aurobindo Pharma Ltd. engages in the manufacturing of generic pharmaceuticals and active pharmaceutical ingredients. It operates under the following geographical segments: India, USA, Europe, and Rest of the World. Its portfolio includes antibiotics, anti-retroviral, cardiovascular, central nervous system, gastroenterological, anti-allergies, and anti-diabetics.
Aurobindo Pharma Ltd. Closing price is 1191.30. The positive aspects of the company are moderate Valuation (P.E. = 19.8), Strong cash generating ability from core business - Improving Cash Flow from operation, Companies with Low Debt, FII / FPI or Institutions increasing their shareholding, RSI indicating price strength and MFs increased their shareholding last quarter. The Negative aspects of the company are Stocks Underperforming their Industry Price Change in the Quarter and High promoter stock pledges.
Entry can be taken after closing above 1192 Historical Resistance in the stock will be 1249, 1299 and 1358. PEAK Historic Resistance in the stock will be 1403 and 1461. Stop loss in the stock should be maintained at Closing below 1073 or 986 depending upon your risk taking ability.
Disclaimer: The above information is provided for educational purpose, analysis and paper trading only. Please don't treat this as a buy or sell recommendation for the stock or index. The Techno-Funda analysis is based on data that is more than 3 months old. Supports and Resistances are determined by historic past peaks and Valley in the chart. Many other indicators and patterns like EMA, RSI, MACD, Volumes, Fibonacci, parallel channel etc. use historic data which is 3 months or older cyclical points. There is no guarantee they will work in future as markets are highly volatile and swings in prices are also due to macro and micro factors based on actions taken by the company as well as region and global events. Equity investment is subject to risks. I or my clients or family members might have positions in the stocks that we mention in our educational posts. We will not be responsible for any Profit or loss that may occur due to any financial decision taken based on any data provided in this message. Do consult your investment advisor before taking any financial decisions. Stop losses should be an important part of any investment in equity.
Niva Bupa gives a strong closing. Niva Bupa Health Insurance Co. Ltd. engages in the provision of health, travel, and corporate insurance services. It operates through the following segments: Health, Personal Accident, and Travel.
Niva Bupa Health Insurance Co. closing price is 85.05. The positive aspects of the company are Stocks Outperforming their Industry Price Change in the Quarter, Companies with Zero Promoter Pledge, Rising Net Cash Flow and Cash from Operating activity, RSI indicating price strength and FII / FPI or Institutions increasing their shareholding. The Negative aspects of the company are high Valuation (P.E. = 73.5), PE higher than Industry PE and MFs decreased their shareholding last quarter.
Entry can be taken after closing above 86 Historical Resistance in the stock will be 89.3, 94.8 and 99.2. PEAK Historic Resistance in the stock will be 102 and 106. Stop loss in the stock should be maintained at Closing below 79.58 or 75.2 depending upon your risk taking ability.
Disclaimer: The above information is provided for educational purpose, analysis and paper trading only. Please don't treat this as a buy or sell recommendation for the stock or index. The Techno-Funda analysis is based on data that is more than 3 months old. Supports and Resistances are determined by historic past peaks and Valley in the chart. Many other indicators and patterns like EMA, RSI, MACD, Volumes, Fibonacci, parallel channel etc. use historic data which is 3 months or older cyclical points. There is no guarantee they will work in future as markets are highly volatile and swings in prices are also due to macro and micro factors based on actions taken by the company as well as region and global events. Equity investment is subject to risks. I or my clients or family members might have positions in the stocks that we mention in our educational posts. We will not be responsible for any Profit or loss that may occur due to any financial decision taken based on any data provided in this message. Do consult your investment advisor before taking any financial decisions. Stop losses should be an important part of any investment in equity.

Mount Fuji Series- Old runners waking upMount Fuji Series- Old runners waking up -
TARC - started running after 50-70 levels.. hope getting ready again.
Realty company with good land holding. Funda strong company.

RAILTELsecond leg up soon? cooling off after a good move up north with volumes... good r:r for right now. also a cup & handle formation happening!

GH (Guardant Health) — Breakout Setup with Strong Upside PotentiGuardant Health (GH) is showing signs of completing a long-term accumulation phase and transitioning into a bullish trend. After breaking out of a major descending trendline and holding above key resistance at $38.30, the stock entered a tight consolidation range — a classic base formation before a potential breakout.
Technical Highlights:
– Confirmed trendline breakout
– Price is consolidating above previous highs
– Entry zone around $50–$51
– First target: $70 (+40%)
– Second target: $103 (+100% from current levels)
Fundamental Support:
Guardant Health is a leading precision oncology company specializing in liquid biopsy technologies for cancer screening and monitoring. The company continues to expand its product offerings, especially in early cancer detection — a market with huge long-term growth potential. Recent news includes positive developments in clinical trials and expanded partnerships, which could significantly boost revenue.
Institutional interest in GH has also been rising, with increased buying activity visible in the most recent 13F filings. The overall market sentiment toward biotech stocks with strong data pipelines is improving, which further supports the bullish outlook.
Conclusion:
GH is a strong candidate for medium- to long-term growth. The technical setup aligns with a fundamental narrative of innovation and market expansion. Partial profit-taking could be considered at $70 and $103. Due to the volatility of biotech stocks, proper risk management and position sizing are essential.

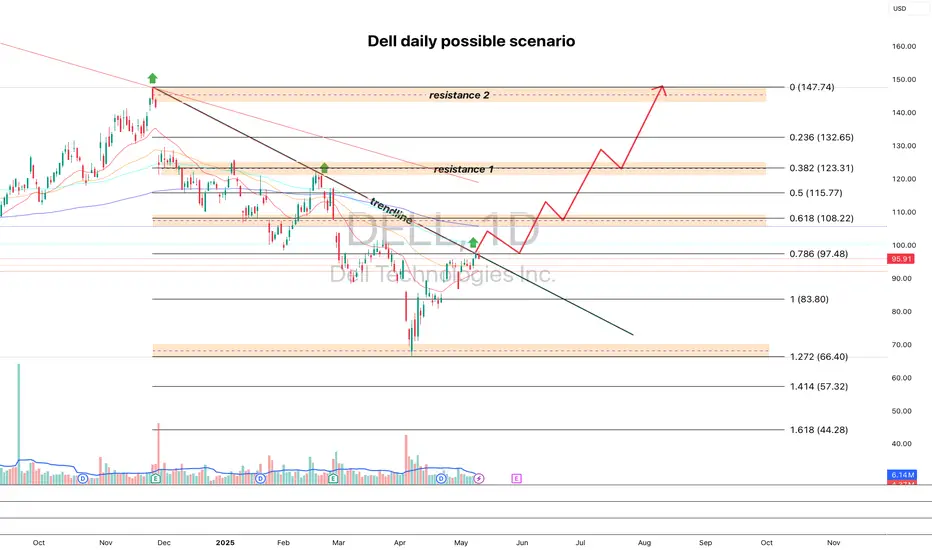
DELL looks good for pump dailyI'm watching DELL for a breakout of the trendline and a cross above the 100 MA — targeting a move toward 108.22, followed by a retest of the breakout and further upside targets at 123.31 and 147.74.
Fundamentally, the company looks strong, and the next earnings report is expected on May 29.
If you like the analysis, hit that rocket 🚀
Wipro in recovery mode on monthly chart.Wipro Ltd. is a global information technology, consulting and outsourcing company, which engages in the development and integration of solutions.
Wipro Closing price is 249.67. The positive aspects of the company are Attractive Valuation (P.E. = 19.9), Companies with Zero Promoter Pledge, Companies with Low Debt, Annual Profit Growth higher than Sector Profit Growth, Company able to generate Net Cash - Improving Net Cash Flow for last 2 years and FII / FPI or Institutions increasing their shareholding. The Negative aspects of the company are Stocks Underperforming their Industry Price Change in the Quarter, Promoter decreasing their shareholding, Increasing Trend in Non-Core Income and MFs decreased their shareholding last quarter.
Entry can be taken after closing above 251 Historical Resistance in the stock will be 257 and 277. PEAK Historic Resistance in the stock will be 292 and 312. Stop loss in the stock should be maintained at Closing below 227.
Disclaimer: The above information is provided for educational purpose, analysis and paper trading only. Please don't treat this as a buy or sell recommendation for the stock or index. The Techno-Funda analysis is based on data that is more than 3 months old. Supports and Resistances are determined by historic past peaks and Valley in the chart. Many other indicators and patterns like EMA, RSI, MACD, Volumes, Fibonacci, parallel channel etc. use historic data which is 3 months or older cyclical points. There is no guarantee they will work in future as markets are highly volatile and swings in prices are also due to macro and micro factors based on actions taken by the company as well as region and global events. Equity investment is subject to risks. I or my clients or family members might have positions in the stocks that we mention in our educational posts. We will not be responsible for any Profit or loss that may occur due to any financial decision taken based on any data provided in this message. Do consult your investment advisor before taking any financial decisions. Stop losses should be an important part of any investment in equity.

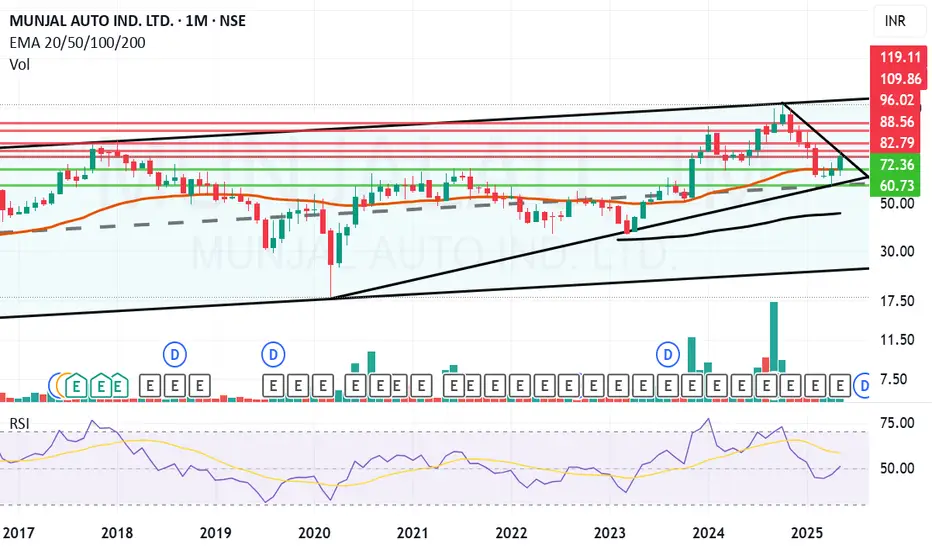
Munjal Auto giving a Breakout on Monthly chart. Munjal Auto Industries Ltd. engages in the production of automobile components. It operates through the Auto Components and Composite Products and Molds segments. It manufactures exhaust systems for two wheelers and four wheelers, spoke rims for two wheelers, steel wheel rims for two wheelers and four wheelers, fuel tanks for four wheelers, sheet metal components, seat frames for four wheelers, and other automotive assemblies.
Munjal Auto Closing price is 82.98. The positive aspects of the company are Companies with Zero Promoter Pledge, Companies with Low Debt and FII / FPI or Institutions increasing their shareholding. The Negative aspects of the company is Stocks Underperforming their Industry Price Change in the Quarter.
Entry can be taken after closing above 83 Historical Resistance in the stock will be 88.5 and 96. PEAK Historic Resistance in the stock will be 109 and 119. Stop loss in the stock should be maintained at Closing below 72.3 or 60.7 depending upon your risk taking ability.
Disclaimer: The above information is provided for educational purpose, analysis and paper trading only. Please don't treat this as a buy or sell recommendation for the stock or index. The Techno-Funda analysis is based on data that is more than 3 months old. Supports and Resistances are determined by historic past peaks and Valley in the chart. Many other indicators and patterns like EMA, RSI, MACD, Volumes, Fibonacci, parallel channel etc. use historic data which is 3 months or older cyclical points. There is no guarantee they will work in future as markets are highly volatile and swings in prices are also due to macro and micro factors based on actions taken by the company as well as region and global events. Equity investment is subject to risks. I or my clients or family members might have positions in the stocks that we mention in our educational posts. We will not be responsible for any Profit or loss that may occur due to any financial decision taken based on any data provided in this message. Do consult your investment advisor before taking any financial decisions. Stop losses should be an important part of any investment in equity.
Is This the Perfect Moment to Execute the Tesla Heist?💰 Tesla Stock Market Heist Blueprint 🚀
🌟 Hi! Hola! Ola! Bonjour! Hallo! Marhaba! 🌟
Dear Money Makers & Robbers, 🤑💰💸✈️
Here’s our grand plan: a 🔥Thief Trading Style heist🔥 targeting the TESLA stock! Let’s break in with this cunning strategy — chart-ready and primed for action!
🎯 Entry:
The vault’s open! Grab the bullish loot at any price — the heist is live!
Tip: For precision, use a buy limit order on 15m/30m swing highs or lows — that’s your perfect pullback entry!
🛑 Stop Loss:
Thief SL is stashed at the nearest swing low (or just below the MA on the daily chart ~300.00 for swing trades).
Tailor SL to your trade risk, lot size, and your thieving gang’s order plan.
🏴☠️ Target:
460.00 — or vanish before hitting the target to avoid the traps of the overbought zone!
💎 The Setup:
We’re seeing bullishness fueled by key factors: macro moves, fundamentals, sentiment, intermarket trends… it’s all in play! 📈🔗🌏
Check the macro, COT report, sentiment outlook, and future trend targets to stay ahead of the game!
⚠️ Trading Alert:
News releases can flip the game fast.
Avoid fresh trades during major news.
Use trailing stops to lock in those juicy profits and protect your loot.
❤️🔥 Support the Heist Crew!
💥Hit the Boost Button💥 — fuel our robbery plans and let’s keep cashing in every day!
The Thief Trading Style: slick, powerful, and ready for the next heist.
See you soon with another plan, fellow robbers! 🤑🐱👤🤩

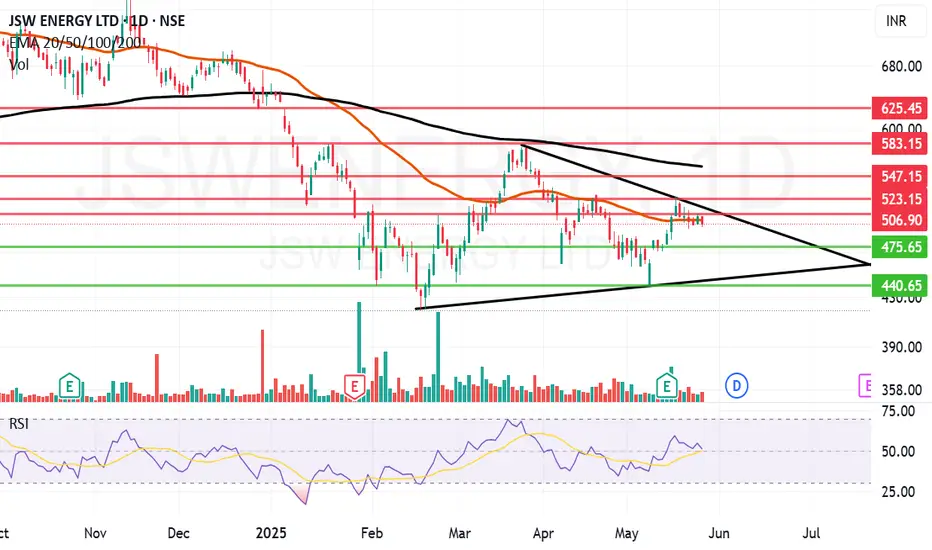
JSW Energy trying to gain some energy and momentum.JSW Energy Ltd. engages in the business of power generation. It operates through the following business segments: Power Generation, Power Transmission, and Power Trading. The company was founded by Om Prakash Jindal on March 10, 1994 and is headquartered in Mumbai, India.
JSW Energy Ltd. Closing price is 497.4. The positive aspects of the company are Annual Net Profits improving for last 2 years, Consistent Highest Return Stocks over Five Years and MFs increased their shareholding last quarter. The Negative aspects of the company are high Valuation (P.E. = 45.2), Stocks Underperforming their Industry Price Change in the Quarter, Increasing Trend in Non-Core Income, Companies with Increasing Debt, Promoter decreasing their shareholding and Companies with high market cap, lower public shareholding.
Entry can be taken after closing above 507 Historical Resistance in the stock will be 528, 547 and 567. PEAK Historic Resistance in the stock will be 583 and 625. Stop loss in the stock should be maintained at Closing below 475 or 440 depending upon your risk taking ability.
Disclaimer: The above information is provided for educational purpose, analysis and paper trading only. Please don't treat this as a buy or sell recommendation for the stock or index. The Techno-Funda analysis is based on data that is more than 3 months old. Supports and Resistances are determined by historic past peaks and Valley in the chart. Many other indicators and patterns like EMA, RSI, MACD, Volumes, Fibonacci, parallel channel etc. use historic data which is 3 months or older cyclical points. There is no guarantee they will work in future as markets are highly volatile and swings in prices are also due to macro and micro factors based on actions taken by the company as well as region and global events. Equity investment is subject to risks. I or my clients or family members might have positions in the stocks that we mention in our educational posts. We will not be responsible for any Profit or loss that may occur due to any financial decision taken based on any data provided in this message. Do consult your investment advisor before taking any financial decisions. Stop losses should be an important part of any investment in equity.
MSumi Wiring trying to wire up to old levelsMotherson Sumi Wiring India Ltd. engages in the manufacture and sale of wire harnesses, components, and wires to automotive original equipment manufacturers. The company was founded on July 2, 2020 and is headquartered in Mumbai, India.
Motherson Sumi Wiring India Ltd. Closing price is 59.35. The positive aspects of the company are Stocks Outperforming their Industry Price Change in the Quarter, Companies with Zero Promoter Pledge, Companies with Low Debt and FII / FPI or Institutions increasing their shareholding. The Negative aspects of the company are high Valuation (P.E. = 43.1), Increasing Trend in Non-Core Income, Declining Net Cash Flow : Companies not able to generate net cash, Companies with growing costs YoY for long term projects and MFs decreased their shareholding last quarter.
Entry can be taken after closing above 60 Historical Resistance in the stock will be 62.3 and 66.2. PEAK Historic Resistance in the stock will be 69.6 and 72.7. Stop loss in the stock should be maintained at Closing below 55.3 or 53.9 depending upon your risk taking ability.
Disclaimer: The above information is provided for educational purpose, analysis and paper trading only. Please don't treat this as a buy or sell recommendation for the stock or index. The Techno-Funda analysis is based on data that is more than 3 months old. Supports and Resistances are determined by historic past peaks and Valley in the chart. Many other indicators and patterns like EMA, RSI, MACD, Volumes, Fibonacci, parallel channel etc. use historic data which is 3 months or older cyclical points. There is no guarantee they will work in future as markets are highly volatile and swings in prices are also due to macro and micro factors based on actions taken by the company as well as region and global events. Equity investment is subject to risks. I or my clients or family members might have positions in the stocks that we mention in our educational posts. We will not be responsible for any Profit or loss that may occur due to any financial decision taken based on any data provided in this message. Do consult your investment advisor before taking any financial decisions. Stop losses should be an important part of any investment in equity.
