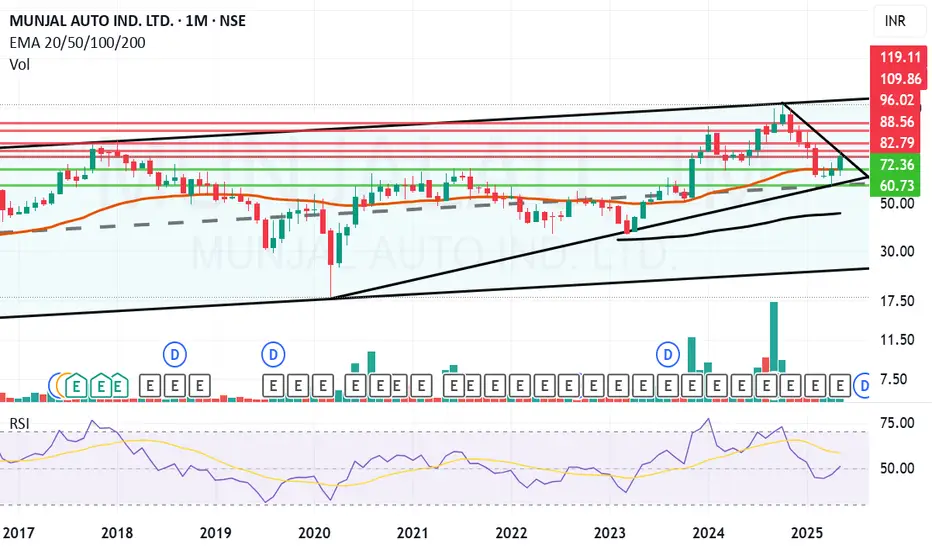
Munjal Auto giving a Breakout on Monthly chart. Munjal Auto Industries Ltd. engages in the production of automobile components. It operates through the Auto Components and Composite Products and Molds segments. It manufactures exhaust systems for two wheelers and four wheelers, spoke rims for two wheelers, steel wheel rims for two wheelers and four wheelers, fuel tanks for four wheelers, sheet metal components, seat frames for four wheelers, and other automotive assemblies.
Munjal Auto Closing price is 82.98. The positive aspects of the company are Companies with Zero Promoter Pledge, Companies with Low Debt and FII / FPI or Institutions increasing their shareholding. The Negative aspects of the company is Stocks Underperforming their Industry Price Change in the Quarter.
Entry can be taken after closing above 83 Historical Resistance in the stock will be 88.5 and 96. PEAK Historic Resistance in the stock will be 109 and 119. Stop loss in the stock should be maintained at Closing below 72.3 or 60.7 depending upon your risk taking ability.
Disclaimer: The above information is provided for educational purpose, analysis and paper trading only. Please don't treat this as a buy or sell recommendation for the stock or index. The Techno-Funda analysis is based on data that is more than 3 months old. Supports and Resistances are determined by historic past peaks and Valley in the chart. Many other indicators and patterns like EMA, RSI, MACD, Volumes, Fibonacci, parallel channel etc. use historic data which is 3 months or older cyclical points. There is no guarantee they will work in future as markets are highly volatile and swings in prices are also due to macro and micro factors based on actions taken by the company as well as region and global events. Equity investment is subject to risks. I or my clients or family members might have positions in the stocks that we mention in our educational posts. We will not be responsible for any Profit or loss that may occur due to any financial decision taken based on any data provided in this message. Do consult your investment advisor before taking any financial decisions. Stop losses should be an important part of any investment in equity.
Stockstowatch
Is This the Perfect Moment to Execute the Tesla Heist?💰 Tesla Stock Market Heist Blueprint 🚀
🌟 Hi! Hola! Ola! Bonjour! Hallo! Marhaba! 🌟
Dear Money Makers & Robbers, 🤑💰💸✈️
Here’s our grand plan: a 🔥Thief Trading Style heist🔥 targeting the TESLA stock! Let’s break in with this cunning strategy — chart-ready and primed for action!
🎯 Entry:
The vault’s open! Grab the bullish loot at any price — the heist is live!
Tip: For precision, use a buy limit order on 15m/30m swing highs or lows — that’s your perfect pullback entry!
🛑 Stop Loss:
Thief SL is stashed at the nearest swing low (or just below the MA on the daily chart ~300.00 for swing trades).
Tailor SL to your trade risk, lot size, and your thieving gang’s order plan.
🏴☠️ Target:
460.00 — or vanish before hitting the target to avoid the traps of the overbought zone!
💎 The Setup:
We’re seeing bullishness fueled by key factors: macro moves, fundamentals, sentiment, intermarket trends… it’s all in play! 📈🔗🌏
Check the macro, COT report, sentiment outlook, and future trend targets to stay ahead of the game!
⚠️ Trading Alert:
News releases can flip the game fast.
Avoid fresh trades during major news.
Use trailing stops to lock in those juicy profits and protect your loot.
❤️🔥 Support the Heist Crew!
💥Hit the Boost Button💥 — fuel our robbery plans and let’s keep cashing in every day!
The Thief Trading Style: slick, powerful, and ready for the next heist.
See you soon with another plan, fellow robbers! 🤑🐱👤🤩

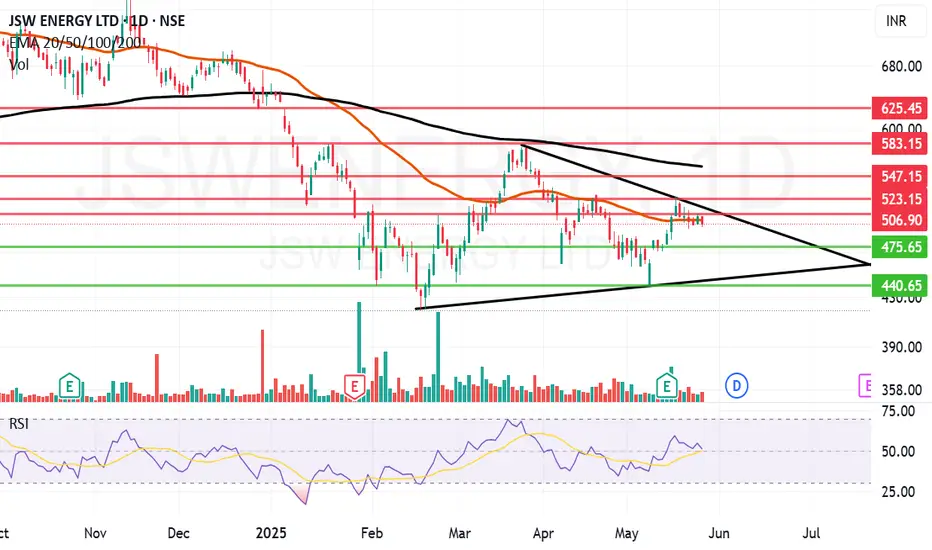
JSW Energy trying to gain some energy and momentum.JSW Energy Ltd. engages in the business of power generation. It operates through the following business segments: Power Generation, Power Transmission, and Power Trading. The company was founded by Om Prakash Jindal on March 10, 1994 and is headquartered in Mumbai, India.
JSW Energy Ltd. Closing price is 497.4. The positive aspects of the company are Annual Net Profits improving for last 2 years, Consistent Highest Return Stocks over Five Years and MFs increased their shareholding last quarter. The Negative aspects of the company are high Valuation (P.E. = 45.2), Stocks Underperforming their Industry Price Change in the Quarter, Increasing Trend in Non-Core Income, Companies with Increasing Debt, Promoter decreasing their shareholding and Companies with high market cap, lower public shareholding.
Entry can be taken after closing above 507 Historical Resistance in the stock will be 528, 547 and 567. PEAK Historic Resistance in the stock will be 583 and 625. Stop loss in the stock should be maintained at Closing below 475 or 440 depending upon your risk taking ability.
Disclaimer: The above information is provided for educational purpose, analysis and paper trading only. Please don't treat this as a buy or sell recommendation for the stock or index. The Techno-Funda analysis is based on data that is more than 3 months old. Supports and Resistances are determined by historic past peaks and Valley in the chart. Many other indicators and patterns like EMA, RSI, MACD, Volumes, Fibonacci, parallel channel etc. use historic data which is 3 months or older cyclical points. There is no guarantee they will work in future as markets are highly volatile and swings in prices are also due to macro and micro factors based on actions taken by the company as well as region and global events. Equity investment is subject to risks. I or my clients or family members might have positions in the stocks that we mention in our educational posts. We will not be responsible for any Profit or loss that may occur due to any financial decision taken based on any data provided in this message. Do consult your investment advisor before taking any financial decisions. Stop losses should be an important part of any investment in equity.
MSumi Wiring trying to wire up to old levelsMotherson Sumi Wiring India Ltd. engages in the manufacture and sale of wire harnesses, components, and wires to automotive original equipment manufacturers. The company was founded on July 2, 2020 and is headquartered in Mumbai, India.
Motherson Sumi Wiring India Ltd. Closing price is 59.35. The positive aspects of the company are Stocks Outperforming their Industry Price Change in the Quarter, Companies with Zero Promoter Pledge, Companies with Low Debt and FII / FPI or Institutions increasing their shareholding. The Negative aspects of the company are high Valuation (P.E. = 43.1), Increasing Trend in Non-Core Income, Declining Net Cash Flow : Companies not able to generate net cash, Companies with growing costs YoY for long term projects and MFs decreased their shareholding last quarter.
Entry can be taken after closing above 60 Historical Resistance in the stock will be 62.3 and 66.2. PEAK Historic Resistance in the stock will be 69.6 and 72.7. Stop loss in the stock should be maintained at Closing below 55.3 or 53.9 depending upon your risk taking ability.
Disclaimer: The above information is provided for educational purpose, analysis and paper trading only. Please don't treat this as a buy or sell recommendation for the stock or index. The Techno-Funda analysis is based on data that is more than 3 months old. Supports and Resistances are determined by historic past peaks and Valley in the chart. Many other indicators and patterns like EMA, RSI, MACD, Volumes, Fibonacci, parallel channel etc. use historic data which is 3 months or older cyclical points. There is no guarantee they will work in future as markets are highly volatile and swings in prices are also due to macro and micro factors based on actions taken by the company as well as region and global events. Equity investment is subject to risks. I or my clients or family members might have positions in the stocks that we mention in our educational posts. We will not be responsible for any Profit or loss that may occur due to any financial decision taken based on any data provided in this message. Do consult your investment advisor before taking any financial decisions. Stop losses should be an important part of any investment in equity.

PARQ.N00001. Current Trend and Price Action
Uptrend: The stock is in a strong bullish trend, with consistent higher highs and higher lows evident in the weekly chart.
Key Resistance Levels:
The stock is approaching a critical resistance zone between 36.7 (0.618 Fibonacci level) and 38.0 (0.65 Fib level). These levels could act as barriers unless strong buying momentum continues.
Support Levels:
Immediate support is at 32.5 (0.5 Fibonacci level). If the stock pulls back, this level should act as a strong support zone.
Additional support lies at 27.2 (0.382 Fib level) if further corrections occur.
2. Fibonacci Analysis
The 0.618 (Golden Pocket) zone at 36.7 is a critical level to watch. If the stock breaks above this zone, it may head toward the 0.786 Fib level (~43.4).
All-Time High Target: The 1.0 Fibonacci level at 52.0 represents the potential all-time high target if the uptrend continues.
3. Indicators
RSI (Relative Strength Index):
The RSI is currently at 76.89, indicating that the stock is in the overbought region. This suggests a potential for a short-term pullback or consolidation before continuing the upward momentum.
Volume and Momentum:
The recent candles show strong bullish momentum, supported by rising volume. However, caution is needed as the price approaches the resistance levels.
4. Observations
Bullish Case: If PARQ breaks above 38.0, the next target would likely be 43.4, followed by 52.0 as the long-term target.
Bearish Case: Failure to break the 36.7 - 38.0 resistance zone could result in a pullback toward 32.5 or even 27.2.

CHAMBLEFERT IDEAChamblfert looks like at a good demand zone. Expecting good one time bounce from this area and one green candle after long rail of back to back red candles.

NIFTY!Gift nifty at supply area which means a selling could start or slow buying could persist. Although stocks are showing good momentum, i will keep a cautious watch all over.

TCS EASY CHARTI think this is one of the most easy chart of a stock io know what is and will happen in the stock. I will be posting details of smaller levels on this stock.

Premier Explosives is exploding on charts. Premier Explosives Ltd. engages in the manufacture of explosives, detonators, propellants, services, and other traded items. Its product portfolio includes defense products and commercial explosives. Premier Explosives Ltd. Closing price is 493.50.
The positive aspects of the company are Companies with Low Debt, Strong cash generating ability from core business - Improving Cash Flow from operation, Companies with Zero Promoter Pledge, RSI indicating price strength and FII / FPI or Institutions increasing their shareholding. The Negative aspects of the company are high Valuation (P.E. = 83.7), Stocks Underperforming their Industry Price Change in the Quarter, Companies with growing costs YoY for long term projects and MFs decreased their shareholding last quarter.
Entry can be taken after closing above 496 Historical Resistance in the stock will be 530, 583 and 605. PEAK Historic Resistance in the stock will be 633 and 673. Stop loss in the stock should be maintained at Closing below 429 or 405 depending upon your risk taking ability.
Disclaimer: The above information is provided for educational purpose, analysis and paper trading only. Please don't treat this as a buy or sell recommendation for the stock or index. The Techno-Funda analysis is based on data that is more than 3 months old. Supports and Resistances are determined by historic past peaks and Valley in the chart. Many other indicators and patterns like EMA, RSI, MACD, Volumes, Fibonacci, parallel channel etc. use historic data which is 3 months or older cyclical points. There is no guarantee they will work in future as markets are highly volatile and swings in prices are also due to macro and micro factors based on actions taken by the company as well as region and global events. Equity investment is subject to risks. I or my clients or family members might have positions in the stocks that we mention in our educational posts. We will not be responsible for any Profit or loss that may occur due to any financial decision taken based on any data provided in this message. Do consult your investment advisor before taking any financial decisions. Stop losses should be an important part of any investment in equity.

IRFC trying to break out on a fast track. Indian Railway Finance Corp. Ltd. engages in the business of borrowing funds from the finance markets to finance the acquisition of assets which are leased out to the Indian Railways as finance lease. Indian Railway Finance Corp. Ltd. Closing price is 138.61.
The positive aspects of the company are Stocks Outperforming their Industry Price Change in the Quarter, Companies with Zero Promoter Pledge, RSI indicating price strength, Strong cash generating ability from core business - Improving Cash Flow from operation and FII / FPI or Institutions increasing their shareholding. The Negative aspects of the company are high Valuation (P.E. = 27.9), PE higher than Industry PE, Companies with high market cap, lower public shareholding and MFs decreased their shareholding last quarter.
Entry can be taken after closing above 140 Historical Resistance in the stock will be 152 and 165. PEAK Historic Resistance in the stock will be 176 and 189. Stop loss in the stock should be maintained at Closing below 122 or 108 depending upon your risk taking ability.
Disclaimer: The above information is provided for educational purpose, analysis and paper trading only. Please don't treat this as a buy or sell recommendation for the stock or index. The Techno-Funda analysis is based on data that is more than 3 months old. Supports and Resistances are determined by historic past peaks and Valley in the chart. Many other indicators and patterns like EMA, RSI, MACD, Volumes, Fibonacci, parallel channel etc. use historic data which is 3 months or older cyclical points. There is no guarantee they will work in future as markets are highly volatile and swings in prices are also due to macro and micro factors based on actions taken by the company as well as region and global events. Equity investment is subject to risks. I or my clients or family members might have positions in the stocks that we mention in our educational posts. We will not be responsible for any Profit or loss that may occur due to any financial decision taken based on any data provided in this message. Do consult your investment advisor before taking any financial decisions. Stop losses should be an important part of any investment in equity.

Crossed over 6.05 SKLZSklz will be over 10$ next year mark my words!!!
Daily booming primed for a breakout of the oldest bearish trends dating back to the reverse split… been holding and buying for years got stuck in and now we are bullish with a good avg price waiting for half sell off north off 11.53$ riding the rest.
16.7m shares i own 3.1k

UPS United Parcel Service Stock. Top stock to buy in 2025UPS United Parcel Service Stock. Top stock to buy in 2025 after reaching the strong monthly demand level. It took 50 months to reach it and now it's trying to play out as expected. Long-term longs for this American stock.

MCHP Possible Correction? Is MCHP Correcting ?
Well based on hitting a four target in this bullish swing , I can sway makes sense here is the full scope are where we are heading before another move up
Kris/Mindbloome Exchange
Trade Smarter Live Better

NATRIUM | Investing | Why BILL GATES is Betting on NATRIUMBill Gates is betting big on Natrium - should you be, too?
Natrium is this next-generation nuclear reactor design that's attracting a lot of attention from people like Bill Gates and other major investors. What's particularly interesting about it is that it combines a fast reactor with a built-in molten salt "battery." Essentially, it can generate a steady output of power and then provide an extra boost during peak demand by drawing on its stored heat. This design aims for greater flexibility in meeting fluctuating electricity needs.
The technology is a joint development by TerraPower, the company co-founded by Bill Gates, and GE Hitachi. They're presenting it as a zero-carbon power source capable of reliably backing up intermittent renewables like wind and solar, ensuring a consistent supply of clean energy.
The excitement from investors like Bill Gates appears to be driven by the need to address climate change and secure reliable energy supplies. They view Natrium as a way to deliver large-scale, carbon-free power while potentially overcoming some of the limitations of older nuclear reactor designs. Gates has emphasized the enhanced safety features and potential for lower operating costs. Furthermore, Natrium's specific design to complement the intermittency of solar and wind, through its energy storage, is a significant draw for investors looking at future energy solutions. The substantial public and private investment, including government funding and bipartisan legislative support, also signals strong confidence in this technology.
The description of TerraPower as a "Bill Gates-backed" firm developing this multi-billion dollar demonstration plant highlights the high-profile nature of the project. The fact that corporate partners, such as the data center company exploring Natrium for their power needs, are also getting involved indicates a broader recognition of its potential beyond just government initiatives.
Compared to traditional nuclear reactors, Natrium offers some potential advantages. Its sodium coolant operates at near-atmospheric pressure, simplifying safety compared to the high-pressure water systems in older designs. This allows for natural heat dissipation in case of issues, reducing the risk of large steam explosions. Another key aspect is Natrium's potential for more efficient fuel utilization and reduced long-lived waste generation. The design aims for better fuel efficiency and a smaller volume of long-term radioactive waste compared to current light-water reactors.
Natrium's primary advantage over wind and solar is its dispatchability. Unlike the intermittent nature of renewables, Natrium can provide power consistently, 24/7. The integrated energy storage allows it to complement renewables by absorbing excess energy or releasing power during periods of low renewable output. This firm grid support is a significant benefit for utilities concerned about grid stability and the variability of renewable sources.
For utilities transitioning away from coal, Natrium offers a carbon-free, relatively direct replacement in terms of power output. It also has a smaller land footprint compared to large-scale wind or solar installations.
There are inherent challenges with a first-of-a-kind system like Natrium. The prototype is still under construction, lacking a proven operational track record. Construction and licensing processes could face delays and cost overruns. Critics also raise valid points about the actual safety and cost-effectiveness compared to projections. The use of sodium coolant, while offering safety advantages, also presents risks due to its reactivity with air and water, requiring robust containment systems. Regulatory scrutiny will undoubtedly be extensive.
And fuel supply is a critical uncertainty. Natrium requires high-assay, low-enriched uranium (HALEU), which is not currently widely available. Disruptions in the supply chain and limited existing production capacity pose a significant risk to the timely and cost-effective operation of Natrium plants.
Looking ahead, Natrium is being considered for deployment in regions needing reliable power to complement renewables and to power energy-intensive industries. The long-term vision involves integrating Natrium with renewable energy sources to create a more stable and decarbonized grid.
The speculative outlook for Natrium in the next 5-10 years is heavily dependent on the successful completion of the Wyoming demonstration plant. If it meets its targets, it could pave the way for wider adoption. However, the timeline is ambitious, and challenges related to fuel supply and regulatory approvals remain. A successful demonstration could trigger significant investment and adoption in the coming decades, positioning Natrium as a key player in the energy transition.
If you're interested in investing in companies involved with TerraPower's Natrium reactor, several publicly traded firms are integral to its development and supply chain:
🔧 Engineering & Construction
KBR Inc. | (NYSE: KBR)
KBR has formed a strategic alliance with TerraPower to commercialize and deploy Natrium reactors globally. The collaboration focuses on creating a replicable contracting framework to reduce financial risk and ensure cost transparency in deploying Natrium technology.
terrapower.com
⚛️ Nuclear Fuel & Components
BWX Technologies Inc. | (NYSE: BWXT)
BWXT has been awarded a contract by TerraPower to design the Intermediate Heat Exchanger for the Natrium demonstration project. This component is critical for transferring heat within the reactor system.
Centrus Energy Corp. | (NYSE American: LEU)
Centrus Energy is collaborating with TerraPower to establish domestic production capabilities for high-assay, low-enriched uranium (HALEU), which is essential for fueling the Natrium reactor.
⚙️ Manufacturing & Industrial Partners
Doosan Enerbility Co., Ltd. | 034020.KQ (KOSDAQ)
Doosan Enerbility is supplying critical components for the Natrium reactor, including the core barrel and internal supports.
HD Hyundai | 329180.KQ
HD Hyundai is manufacturing the reactor vessel for the Natrium project.
🌍 International Collaborators
SK Inc. | 034730.KQ
SK Inc., a South Korean conglomerate, has invested $250 million in TerraPower to support the demonstration and commercialization of the Natrium reactor.
Korea Hydro & Nuclear Power (KHNP) | 15760.KS (KOSPI)
KHNP has entered into a strategic collaboration with TerraPower to support the Natrium project, leveraging its expertise in nuclear power development.
OTHERS:
1. Mirion Technologies (NYSE: MIR)
Mirion is supplying the Radiation Monitoring System (RMS) and Nuclear Instrumentation System (XIS) for the Natrium Reactor Demonstration Project in Wyoming.
2. GE Vernova (NYSE: GEV)
Through its subsidiary, Global Nuclear Fuel–Americas (GNF-A), GE Vernova is partnering with TerraPower to establish the Natrium Fuel Facility in Wilmington, North Carolina. This facility aims to produce high-assay, low-enriched uranium (HALEU) fuel essential for the Natrium reactor.
3. NuScale Power Corporation (NYSE: SMR)
While not directly involved with the Natrium project, NuScale is a prominent developer of small modular reactors (SMRs), a category that includes Natrium. The company's advancements in SMR technology contribute to the broader nuclear energy landscape.
4. Southern Company (NYSE: SO)
Southern Company is collaborating with TerraPower on the development of a molten chloride fast reactor (MCFR), a separate advanced nuclear project. Their involvement in advanced nuclear technologies aligns with the innovations seen in the Natrium project.
________________________________
Sources: Recent industry reports and news articles and TerraPower press releases provide the data above. Also put together with the help of AI.
world-nuclear-news.org, ans.org, gatesnotes.com, scientificamerican.com, terrapower.com, reuters.com

Asahi songwon Color tring to score a break out. Asahi Songwon Colors Ltd. engages in the business of manufacturing and export of color pigments and its derivatives.
Asahi Songwon Colors Ltd. Closing price is 361.40. The positive aspects of the company are Companies with Zero Promoter Pledge, Stocks Outperforming their Industry Price Change in the Quarter, Annual Profit Growth higher than Sector Profit Growth and Companies with Upcoming Results. The Negative aspects of the company are high Valuation (P.E. = 29.8), Increasing Trend in Non-Core Income and Declining Net Cash Flow : Companies not able to generate net cash.
Entry can be taken after closing above 364 Historical Resistance in the stock will be 382 and 399. PEAK Historic Resistance in the stock will be 420 and 440. Stop loss in the stock should be maintained at Closing below 333 or 313 depending upon your risk taking ability.
Disclaimer: The above information is provided for educational purpose, analysis and paper trading only. Please don't treat this as a buy or sell recommendation for the stock or index. The Techno-Funda analysis is based on data that is more than 3 months old. Supports and Resistances are determined by historic past peaks and Valley in the chart. Many other indicators and patterns like EMA, RSI, MACD, Volumes, Fibonacci, parallel channel etc. use historic data which is 3 months or older cyclical points. There is no guarantee they will work in future as markets are highly volatile and swings in prices are also due to macro and micro factors based on actions taken by the company as well as region and global events. Equity investment is subject to risks. I or my clients or family members might have positions in the stocks that we mention in our educational posts. We will not be responsible for any Profit or loss that may occur due to any financial decision taken based on any data provided in this message. Do consult your investment advisor before taking any financial decisions. Stop losses should be an important part of any investment in equity.

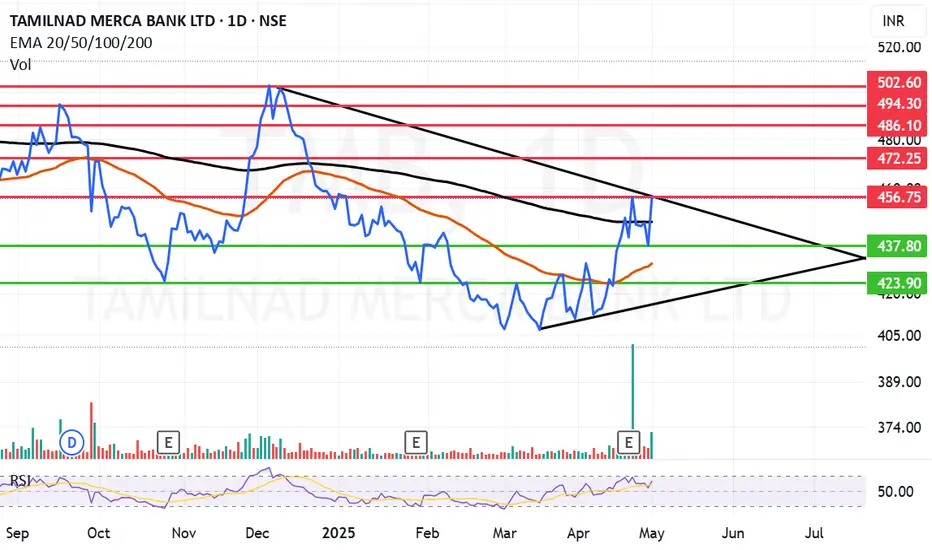
Tamilnad Merca Bank trying to rise with volumes.Tamilnad Mercantile Bank Ltd. engages in the provision of banking services. It offers loan products, current accounts, business and prepaid cards, online and foreign exchange services. It operates through the following business segments: Treasury, Corporate/Wholesale Banking, and Retail Banking.
Tamilnad Mercantile Bank Ltd. Closing price is 456.10. The positive aspects of the company are Very Attractive Valuation (P.E. = 6.1), Companies with Zero Promoter Pledge, Companies with Low Debt, Company able to generate Net Cash - Improving Net Cash Flow, FII / FPI or Institutions increasing their shareholding and Mutual Funds Increased Shareholding over the Past Two Months. The Negative aspects of the company are Stocks Underperforming their Industry Price Change in the Quarter, Declining profits every quarter for the past 2 quarters and Increase in Provisions in Recent Results.
Entry can be taken after closing above 457 Historical Resistance in the stock will be 472 and 486. PEAK Historic Resistance in the stock will be 494 and 502. Stop loss in the stock should be maintained at Closing below 437 or 423 depending upon your risk taking ability.
Disclaimer: The above information is provided for educational purpose, analysis and paper trading only. Please don't treat this as a buy or sell recommendation for the stock or index. The Techno-Funda analysis is based on data that is more than 3 months old. Supports and Resistances are determined by historic past peaks and Valley in the chart. Many other indicators and patterns like EMA, RSI, MACD, Volumes, Fibonacci, parallel channel etc. use historic data which is 3 months or older cyclical points. There is no guarantee they will work in future as markets are highly volatile and swings in prices are also due to macro and micro factors based on actions taken by the company as well as region and global events. Equity investment is subject to risks. I or my clients or family members might have positions in the stocks that we mention in our educational posts. We will not be responsible for any Profit or loss that may occur due to any financial decision taken based on any data provided in this message. Do consult your investment advisor before taking any financial decisions. Stop losses should be an important part of any investment in equity.
MCHP Breakout to 64 if we stay above 48Looks like a great break out trade for 4 bucks possibly more if your interested. MCHP looks like its driving up
Kris/Mindbloome Exchange
Trade Smarter Live Better

DIVISLAB: Impulse formationStock is rising in an impulsive manner and currently started it's 5th wave which shall take the prices towards 7000/7600 zone in the coming weeks. On the downside key level is 5400. One should remain bullish as long as prices are trading above this level.

MFSL: Cup & HandleStock has given a breakout of Cup & Handle pattern and retested the neckline in Jan'25. The measured target for the same is coming in the region of 1900. On the downside the key level can be 1080.

Tesla: At a Crossroads – Accumulation or Breakdown?One of the most talked-about stocks right now — Tesla NASDAQ:TSLA . And for good reason. Between the constant media buzz around Elon Musk and the recent surge in vandalism against Tesla vehicles, it’s been getting plenty of attention. But I’m not here to talk politics or headlines — I’m here for the chart.
And honestly? It’s looking better than you’d think. Despite all the noise, price has held steady in the $225 to $270 range, showing signs of a sideways accumulation phase — right at the Point of Control (POC) since 2021. That’s a pretty strong area, technically speaking.
Over the next few weeks, we’re likely to get clarity:
Either we break above $350, which opens up serious upside potential,
Or we break down toward the Volume Area Low — specifically the 2024 VAL at $161.18.
The real danger zone? Below $138. If price breaks that level, we have to assume that Wave 2 isn’t done yet — even though it was originally considered complete in 2023.
Until then, the structure actually looks constructive: we’ve been putting in higher lows and higher highs since 2023, which signals a potential uptrend.
How far that uptrend goes is hard to call. But if we break and hold above $325, then a pullback toward $300–$270 could offer a clean entry opportunity.
On the flip side, yes — if the market collapses and Wave II is still unfolding, we could be staring at $175, $125, or even as low as $75–$50 in an extreme scenario. And that would be wild for a stock that once touched $485.
But that’s why it’s crucial to zoom out. Ask yourself:
What do I want from Tesla — long-term conviction or short-term plays?
Then build your view. If the macro fits, dial into the lower time frames to find your edge. The setup is building — and it’s looking like Tesla is prepping for a big move.
Question is: which direction are you positioned for?

Kotak Bank: Impulse formationStock is rising in an impulsive manner and currently trading under wave-4 correction. This correction is likely to conclude in the zone of 2215-2200 zone and then we can expect another rally on the upside under wave-5 towards 2350 zone.

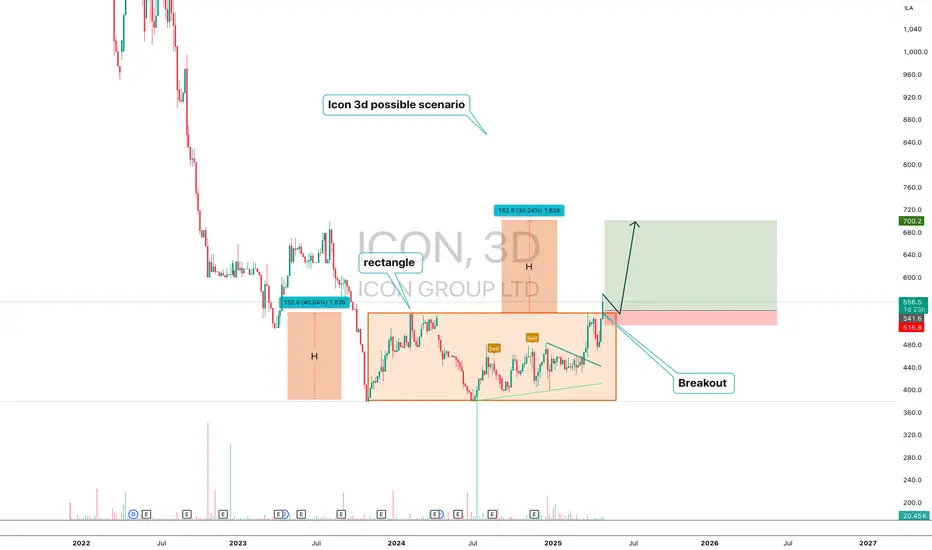
ICON — Breakout from Rectangle with H Projection Targeting $700ICON (3D) — Technical Structure Analysis
ICON has broken out from a prolonged horizontal rectangle pattern ($380–$540). The move activated a measured move structure with two H-sized waves. The first H was completed. The second H projects a move to the $700 area.
Key points:
-Confirmed breakout from range
-First H = 153 pts, completed
-Second H = 162 pts, targeting $700
-Price holding above breakout zone ($515–$541)
ICON has moved out of accumulation and entered trend expansion. As long as the support holds, the scenario remains valid. The technical model targets the $700 area.
Quantum's TSLA Trading Guide 4/13/25Sentiment: Neutral. EV and AI optimism persists, but tariff risks and high valuation concern traders. Chatter split—bulls eye robotaxi, bears see pullback.
Outlook: Neutral, slightly bearish. Options pin $250, with $240 puts active. ICT/SMT eyes $245-$250 buys to $260 if $245 holds. Bearish below $245 risks $240.
Influential News:
Federal Reserve: Two 2025 cuts support growth stocks, positive for $TSLA.
Earnings: Q1 due late April; no update today.
Chatter: Debates tariff impact vs. AI/EV growth.
Mergers and Acquisitions: None; focus on internal projects.
Other: Tariff volatility hit NASDAQ:TSLA ; stock swung (April 3-9).
Indicators:
Weekly:
RSI: ~50 (neutral).
Stochastic: ~45 (neutral).
MFI: ~40 (neutral).
SMAs: 10-day ~$255 (below, bearish), 20-day ~$260 (below, bearish).
Interpretation: Neutral, bearish SMAs signal weakness.
Daily:
RSI: ~48 (neutral).
Stochastic: ~50 (neutral).
MFI: ~45 (neutral).
SMAs: 10-day ~$255 (below, bearish), 20-day ~$260 (below, bearish).
Interpretation: Neutral, bearish SMAs suggest pullback.
Hourly:
RSI: ~45 (neutral).
Stochastic: ~55 (neutral).
MFI: ~50 (neutral).
SMAs: 10-day ~$255 (below, bearish), 20-day ~$260 (below, bearish).
Interpretation: Neutral, stabilizing.
Price Context: $252.31, 1M: +1%, 1Y: +38%. Range $240-$270, testing $250 support.
Options Positioning (May 2025):
Volume:
Calls: $260 (15,000, 60% ask), $270 (12,000, 55% ask). Mild bullish bets.
Puts: $240 (10,000, 70% bid), $245 (8,000, 65% bid). Put selling supports $245.
Open Interest:
Calls: $260 (40,000, +7,000), $270 (30,000, +5,000). Bullish interest.
Puts: $240 (25,000, flat), $245 (28,000, +4,000). Hedging. Put-call ~1.0.
IV Skew:
Calls: $260 (40%), $270 (42%, up 3%). $270 IV rise shows upside hope.
Puts: $240 (35%, down 2%), $245 (36%). Falling $240 IV supports floor.
Probability: 60% $240-$270, 20% <$240.
Karsan’s Interpretation:
Vanna: Neutral (~300k shares/1% IV). IV drop could pressure $250.
Charm: Neutral (~150k shares/day). Pins $250.
GEX: +50,000. Stabilizes range.
DEX: +7M shares, neutral.
Karsan view: GEX holds $240-$270; tariff news key.
ICT/SMT Analysis:
Weekly: Neutral, $240 support, $270 resistance. No $TSLA/ NYSE:NIO divergence.
Daily: Bullish at $250 FVG, targets $260. Bearish < $245.
1-Hour: Bullish >$250, $260 target. MSS at $245.
10-Minute: OTE ($249-$251, $250) for buys, NY AM.
Trade Idea:
Bullish: 50%. ICT/SMT buys $245-$250 to $260. Options show $260 calls. Fed cuts aid.
Neutral: 35%. RSI (~50), SMAs (bearish), $240-$270 range.
Bearish: 15%. Below $240 possible with tariffs. $240 put volume grows.
