Hindustan Unilever Swing Trade OpportunityMarket Leader HUL is trading near its long term Trendline Support and horizontal Demand Zone. High Possibility of the stock bouncing back from the current levels.
Stockstowatch

TTK PRESTIGE LIMITED ( EDUCATIONAL PURPOSE ONLY)Nothing guaranteed and Nothing over week
Invest or trade according to your loss bearing capacity
STOCK FOR EDUCATIONAL PURPOSE ONLY
TTK PRESTIGE LIMITED @ 11250 with target of 11500.CMP IS 11132.65
STOP LOSS: ACCORDING TO YOUR RISK APPETITE OR ONE OR TWO PERCENT BELOW 10000.
Disclaimer: I am not Sebi Registered. All my ideas/opinions and analysis is for your information and educational purposes only and it does not constitute any recommendation to buy or sell any stock or index. Use your own wisdom.
M B PANDEY
SHARE MARKET ANALYST
B.Sc. (MATHS & PHYSICS)
Trying to spread happiness and knowledge
Disclaimer: I AM NOT SEBI REGISTERED

Adani Power - Mid & Long term IdeaHey all ,
Hope you all doing good in this lock down :P Today I am sharing my another Idea for mid and for Long term swing .
Script Name : ADANI POWER
1st Buy : 21
Second Buy : 18
Third Buy : 15
Average Buy : 18 rupees
Stop Loss : 11
Target : 30/41/58/73
Long and for Mid term Holding

TSLA Momentum Strong Ahead Of EarningsTSLA releases its earnings today after market close. It’s EPS forecast is 1.58. Technically, the stock has a bullish stack with the green short EMA above the orange intermediate EMA, and the orange intermediate EMA above the slow red EMA. Moreover, the EMAs have angle and separation which indicates an underlying momentum. The company is on track to deliver 50% more vehicles than its previous fiscal year – this, despite supply-chain disruptions. Market participants anticipate good result, however, will be looking to see if the pace of appreciation is maintaining or declining.

NFLX Momentums is Positive Ahead Of Earnings ReleaseNFLX results are expected today after market close with an EPS forecast at 2.56. Technically, the fast green moving average is above the orange intermediate moving average, and the intermediate orange moving average is above the slow red moving average. Moreover, there is angle and separation to indicate the presence of underlying momentum. During 2020 the lockdown accelerated subscribers, however, the pace has slowed in 2021 as economies opened. As a result, NFLX has looked elsewhere for growth and has expanded into video gaming, purchasing Night School Studio in September. Investors will be looking for signs of progress. Revenue and earnings likely grew albeit at a declining rate. Market participants will also take note of the trend regarding paid streaming subscribers. We will keep an eye on the moving average stack following the earnings release to assess if the market is still willing to keep up its NFLX momentum push.

Gujgas ready for upsideenjoy gujgas upside as 5 days future data suggest short covering. today in live market short covering is still going on. gas prices are high. option chain is strong and bullish. people are recovering ther old sold calls in open chain stats change enjoy the rise ......data suggest it will go really high.
yogesh aggarwal.

UJJIVAN SMALL FINANCE BANK Positional long 1 to 2 yearsUJJIVAN SMALL FINANCE BANK Positional long 1 to 2 years
Buy above 21 or buy on Dips best Buying/Accumulation Zone 18 to 22
Stop Loss below 16
Currently Its available at Covid Crash level and compared to similar Small Finance Banks under valued.
Disclaimer: These levels are purely based on Price action/demand and supply zones & and consumed only for educational purpose & should not be taken as buy/sell recommendation. I will not be responsible for any loss/profit incurred if anyone takes trades based on my views. Please consult your Financial Advisor before making any trading decision.
Leave a comment that is helpful or encouraging. Let's master the markets together.

PERFECT BUY THE DIP SETUP/EXAMPLE !! STOCK MARKET EDITION A50 - Monthly
Recent factors impacting the Asian markets, have included worries of financial system contagion from a deeply leveraged Evergrande , regulatory crackdown across several industries, and continued trade tensions. Nevertheless, one is beginning to see some indications of a bullish bullish divergence on the charts
Break and Retest - Prices are likely to rebound to the breakout level, which should now serve as support and draw buying activity in the case of a bullish break and retest
Ascending Triangle - The ascending triangle pattern is a bullish pattern that indicates the market is consolidating following an upswing, having buyers still very much in control. As the wedge narrows, the occurrence of higher lows signals that a breakout is impending.
Hidden Bullish Divergence - When the oscillator produces a higher high or lower low while the price movement does not, this is known as hidden divergence. Hidden bullish divergence develop during a corrective or consolidation phase in an uptrend
Sell Wall - A sell wall occurs when a high number of sell orders are made at the same time at any price level. Asset prices can be suppressed and forced to trade within a specific range due to sell walls. Since we have broken and now are retesting this sell wall its a very low risk entry

SAIL(Steel Authority of India)Positional long for 1 year period
SAIL (Steel Authority of India)Positional long for 1 year Time Frame
Buying/Accumulation levels 98 to 125
Stop Loss 90
1st Target 152
2nd Target 180
2nd Target 215
Analysis done on Weekly Price action/pattern
Disclaimer: These levels are purely based on Price action/demand and supply zones & and consumed only for educational purpose & should not be taken as buy/sell recommendation. I will not be responsible for any loss/profit incurred if anyone takes trades based on my views. Please consult your Financial Advisor for before making trading decision.
I am not the SEBI Registered Analyst or Advisor( I am Preparing for Certification)
Leave a comment that is helpful or encouraging. Let's master the markets together

PayPal under pressurePayPal Holdings Inc shares fell 1.22%, or $3.19 per share, to close Wednesday at $259.00. The stock showed a lot of weakness since the company's latest earnings report on July 21 showed a higher sales and earnings in Q2, but, its projections for the full-year 2021 were downbeat.
The stock has violated the ascending trendline aggressively with a downward gap confirming the formation of a bearish reversal pattern on the daily timeframe. PYPL may extend its pullback hitting the pattern's target at $235.00 that corresponds to the 38.2% Fibonacci retracement level.

Not yet to buyThis stock is one of those which affected immediately by the COVID-19 pandemic. Its fair value is 21.5 $ but there is a strong movement toward 25.5 $. I totally recommend waiting until it breaks 25.5 and sustains it as support for those who want to buy it.

NETFLIX Can Fall : Pattern CompletedTraders, Netflix made a great run and never gave a a chance to short beyond our sell level. (See the attached previous analysis idea). Now Netflix has gone out of the range to
1. Collect stop losses hence create a bull trap
2. Complete a W pattern
3. Touch 600 psychological level which was missed last time
This not has a potential to fall to target below (white horizontal lines)
Rules:
1. Never trade too much
2. Never trade without a confirmation
3. Never rely on signals, do your own analysis and research too
✅ If you found this idea useful, hit the like button, subscribe and share it in other trading forums.
✅ Follow me for future ideas, trade set ups and the updates of this analysis
✅ Don't hesitate to share your ideas, comments, opinions and questions.
Take care and trade well
-Vik
____________________________________________________
📌 DISCLAIMER
The content on this analysis is subject to change at any time without notice, and is provided for the sole purpose of education only.
Not a financial advice or signal. Please make your own independent investment decisions.
____________________________________________________

How To Play CATI am personally bearish on CAT but I believe this provides a great opportunity to see if a great dip is available when the opportunity strikes. I currently see the 170 VWAP support as a great target, but there also lies a Fibonacci support that rest at 185.87 so keep an eye out for that zone. I will now begin and demonstrate why I'm bearish on this stock.
ANALYSIS
I am taking a look at the weekly time frame as I believe that greater demonstrates the degree to bearishness this stock is in, although I will update this analysis with a chart of the daily which also indicates bearishness. The first sign of bearishness was the rejection of VWAP resistance at 213. After that we have seen the green EMA cross the red RSI towards the downside(sell signal). Not only have we gotten that conventional sell signal but the Blue LSMA has been crossed by the Green EMA indicating more downwards pressure. If you are long then you don't want that Blue LSMA to cross below that 20 level or else we are going to see even greater expansion to the downside.
Targets
- 1st 186
- 2nd 170

ROKU Reversal!!You don't need to be a candlestick expert to know how to trade them. It doesn't matter if you know the difference between a doji and a spinning or a star and abandoned baby.
They all have one thing in common, the next candle needs to open clear above/below the prior. Over precision is not a traders friend.
ROKU +50% in ~45 days from this exact price twice before. Will it be three times before the end of the year??

BUY AUTONATION (AN) for a move up to $150 per shareDear followers & copiers,
💎We've just opened a LONG $AN (AutoNation) position using 3.10% of our equity. 💎
Why we bought the stock?🙋♂️
✅AutoNation delivered better than expected financial performance result for the fifth consecutive time in its Q2 2021 Earnings report.
🥇The company has managed to diversify its portfolio of products very well throughout the last few years, which in turn has drastically lowered its overall risk profile. A well-balanced portfolio of products is also a great long-term stability indicator for the company's position in the industry that it operates in.
🚀What we find extremely attractive from a Growth standpoint is that $AN Auto Nation has been deploying substantial efforts in solidifying its strong footprint as an industry leader by introducing a new digital platform called AutoNation Express, further developing its already large dealer network and
last but not least investing heavily in its store expansion program.
💯The outstanding ability of the senior management team at $AN Auto Nation and the company's CEO Mike Jackson are inevitably going to drive profitability even higher in the coming quarters.
⏳The company is in the process of completing a buyout of 11 stores and a collision center from Peacock Automotive Group, which will drastically improve AutoNation’s portfolio and add $380 million in its annual revenues.
📈AutoNation has also demonstrated that one of the company's core focus points continues to be on the efforts of improving the company's already stable financial position. The operating margins have been very positively affected by the disciplined application of insightful cost reduction and management strategies. AutoNation is committed to operate below or at 65% SG&A as a percentage of gross profit in 2021, signaling a major improvement from its 71%-73% range over the last several years. Its adjusted SG&A as a percentage of gross profit was 56.5% in the last reported quarter, representing an 1,170-basis point improvement year over year.
🤩The company's financial position is also impressive with the combination of a strong balance sheet, low leverage and high liquidity. The firm’s debt-to-capital ratio stands at 0.36, which is another sign that the company possesses plenty of financial flexibility.
📈Technical Picture📈
The stock has experienced a rather meaningful 25% retracement from the $125 per share highs and is currently sitting in an oversold territory at a multi-year support area, which is favoring LONG positions. All of the indicators that we monitor are also turning up higher, signaling the building up of bullish momentum in the stock. The first major resistance that the stock will face and in our opinion will definitely break through is around the $125 area. Once the previous highs are broken then the stock will be easily heading higher towards the next round level of $150 per share.
👌Our plan is to hold the stock for the long term with a potential Target price level of $150 per share.
Follow & Copy us for FREE and get more detailed market analyses, profitable trading ideas and consistent portfolio performance🤝
Sincerely,
Dow Experts

TWITTER INC. Bullish!!As clearly seen, Twitter is still in an ascending bull channel with price currently correcting to the fourth wave on the weekly time frame. I will be looking for more buys at end of wave C and make entries around .382 of wave 3 then take profits at 2.618 ($102.8) Fib level.

SBUX Update(bullish)I am pretty bullish on SBUX and its for notable reasons. A while back I was watching this stock and saw the first indication of bullishness via the Weis Wave, which indicated less interest on the short side of SBUX. We then started seeing reduced selling momentum which also indicates bullishness. Using VWAP, we can see that we are seeing bullish money pour in while having a VWAP resistance lay at 118.69. I believe we will overcome this resistance due to the bullish signals given by the squeeze indicator and the Willy oscillator. Due to the given signals, I think we will see a decent sized bull run.
Bullish Signals
-Weis Wave
-Squeeze indicator
-Willy Oscillator
-Short term VWAP
-Close above Fibonacci Support

What to look for (Visa)There are some notable bull signs that can be seen on Visa. One of them is a close above the swing low. Another bull signs is the reducing selling momentum + Willy Oscillator. Another bull sign I want to brief on is the Weis Wave. The weis wave is indicating that there is less interest on the short side of Visa. I'm personally awaiting a shift in the weis wave to confirm that we are consistently getting less interest towards the short side and will then execute long positions on this stock, but I believe the probabilities are stacked in the favor of longs.
Bullish Signals
-Squeeze indicator
-Willy Oscillator
-Weis Wave
-Fib Support
▼Side Note▼
-On the 15 min Chart we were given a sell signal. This may potentially allow for dips to catch if it is followed by reduced momentum.

BFLY Price Target $20BFLY Current Price $12.20 Price Target $20
I like BFLY here, as it has over $500 million in cash following its merger with Longview, and I like that it is fully expected to be cash-flow positive by 2024.Revenue increased 40.0% to $16.5 million in Q2 2021 from $11.8 million in Q2 2020. The revenue can be traced to both product and subscription revenues. Product revenue increased 30.3% to $13.0 million from $10.0 million last year. That is solid. The company is focused heavily on improving subscriptions, and it is translating to sales. Subscription revenue increased 94.3% to $3.5 million from $1.8 million last year. I see this line of revenue growing sizably in the coming quarters as it becomes a bigger focus of the company. With a half of billion in cash BFLY has significant funds to continue growing their customer base with their innovative cost cutting products. Their Butterfly IQ+ is a handheld ultrasound which is cutting the cost of ultrasounds by over 90%, this opens up the opportunity for the company to expand to developing countries with this amazing cost cutting innovation.

Buy The Dip(SBUX)I have done further analysis on SBUX and why I like this stock on another one of my ideas so I think this is a great buy the dip opportunity. We are seeing a decrease in selling momentum, Willy buy signal, and the daily weis wave dictates little bearish interest on this stock. I like this stock but one thing we do need is for the Williams %R oscillator to signal another crossover for greater confirmation. Watch out for an increase in selling momentum, but for the time being I am holding this stock. I am personally watching the 120 zone for price targets, but it is always best to exit trades when you are given the signal to do so.
▼My Other Analysis ▼

AIRBNB Can Go HigherTraders, AIRBNB stock broke out and can now form a complex FCP W pattern which can take the price higher. But after such a violent move, there can be some profit taking so it can first fall down a bit to test 200 sma and then if we get a confirmation to the upside, this will become a good BUY stock. Watch it closely.
Rules:
1. Never trade too much
2. Never trade without a confirmation
3. Never rely on signals, do your own analysis and research too
✅ If you found this idea useful, hit the like button, subscribe and share it in other trading forums.
✅ Follow me for future ideas, trade set ups and the updates of this analysis
✅ Don't hesitate to share your ideas, comments, opinions and questions.
Take care and trade well
-Vik
____________________________________________________
📌 DISCLAIMER
The content on this analysis is subject to change at any time without notice, and is provided for the sole purpose of education only.
Not a financial advice or signal. Please make your own independent investment decisions.
____________________________________________________

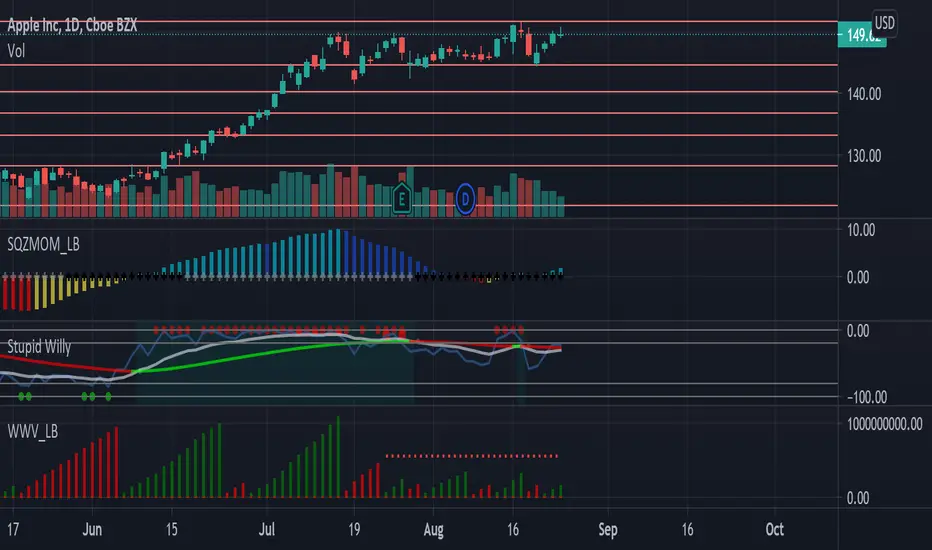
How to Play AAPLPersonally I believe AAPL is in a conflicting state to hold plays in. My main concern regarding aapl is the amount of volume it is getting. The weis wave indicates that volume towards the bull and bear side are both low, meaning that we can't properly dictate where the stock has a greater chance of going. Not only have we been getting low volume, but we have been consolidating off of the 145 support and the 151 resistance. Consolidations tend to mean that a large move is in the making so I would personally wait for confirmation on whether or not to go on the long or short side. I believe we will see a bounce back to the 145 support and potentially a bounce back to the 151 resistance as we've seen for the past few days. Watch for breakouts.
Molecular Data Inc. $MKD - Long idea 💡 ⚠️ This idea is based on my technical analysis only. Do your research and trade on your own risk!
