PGHL searching for a breakout.Procter & Gamble Health Limited is one of India’s largest VMS Companies manufacturing and marketing over-the-counter products, vitamins, minerals, and supplements products for a healthy lifestyle and improved quality of life.
Procter & Gamble Health Ltd. CMP is 5258.5. The Positive aspects of the company are Company with No Debt, Company with Zero Promoter Pledge and Growth in Net Profit with increasing Profit Margin. The Negative aspects of the company are high Valuation (P.E. = 40.1).
Entry can be taken after closing above 5264. Targets in the stock will be 5333 and 5477. The long-term target in the stock will be 5565 and 5600+. Stop loss in the stock should be maintained at Closing below 5156 or 4956 depending on your risk taking ability.
Disclaimer: The above information is provided for educational purpose, analysis and paper trading only. Please don't treat this as a buy or sell recommendation for the stock or index. We do not guarantee any success in highly volatile market or otherwise. Stock market investment is subject to market risks which include global and regional risks. I or my clients might have positions in the stocks that we mention in our posts. We will not be responsible for any Profit or loss that may occur due to any financial decision taken based on any data provided in this message. Do consult your investment advisor before taking any financial decisions. Stop losses should be an important part of any investment in equity.
Stockstowatch

Delta Corp forming a bottom. Delta Corp. Ltd. (India) engages in the business of gaming and entertainment. The firm owns and manages casinos in India. It operates through the following segments: Gaming, Online Skill Gaming, and Hospitality.
Delta Corp. Ltd. (India) CMP is 118.93. The Positive aspects of the company are Moderate Valuation (P.E. = 20.5), Company with No Debt, Company with Zero Promoter Pledge, The Negative aspects of the company are Increasing Trend in Non-Core Income, Declining Net Cash Flow : Companies not able to generate net cash, Companies with growing costs YoY for long term projects and De-growth in Revenue and Profit.
Entry can be taken after closing above 125.25. Targets in the stock will be 125, 129, 131 and 141. The long-term target in the stock will be 149 and 156. Stop loss in the stock should be maintained at Closing below 108 or 104 depending on your risk taking ability.
Disclaimer: The above information is provided for educational purpose, analysis and paper trading only. Please don't treat this as a buy or sell recommendation for the stock or index. We do not guarantee any success in highly volatile market or otherwise. Stock market investment is subject to market risks which include global and regional risks. I or my clients might have positions in the stocks that we mention in our posts. We will not be responsible for any Profit or loss that may occur due to any financial decision taken based on any data provided in this message. Do consult your investment advisor before taking any financial decisions. Stop losses should be an important part of any investment in equity.

Micron Technology: Bearish or Ready to Break Out?Good morning, trading family!
Micron (MU) is at an important spot right now:
If we move lower, I’m watching $97 and $96 as key levels, with potential for more downside.
If we hold above $100, there’s room to climb to $102, $103, and $104. A break above $104 could mean a smoother ride higher.
I’m also hosting a Master Your Mind Traders Class this Sunday to help you refine your skills and mindset. Want to join? Send me a message for details.
Kris/ Mindbloome Exchange
Trade What You See

SPY DIRECTION FOR JAN 10THI think we push to 590.58 then once we see a rejection we can go to 587, 586.50 or 585.20.
If we break 584.40 we are going to 580.
Keep these levels on the watch.

PVRINOX PlungesPVRINOX on the 1-day timeframe demonstrated a sharp bearish move, successfully hitting all targets in a precise short trade setup. Identified using the Risological Swing Trading Indicator , this trade perfectly captured the market's downward momentum.
PVRINOX Key Levels:
Entry: ₹1520.80
SL: ₹1570.40
TP1: ₹1459.45 ✅
TP2: ₹1360.25 ✅
TP3: ₹1261.05 ✅
TP4: ₹1199.75 ✅
Technical Analysis:
The trade initiated at ₹1520.80 with a calculated stop-loss at ₹1570.40, offering an impressive risk-to-reward ratio.
The consistent downtrend was confirmed as prices respected the resistance levels marked by the Risological indicator.
The achievement of all targets reflects the trade's efficiency and the indicator's accuracy.
The break below key support levels and sustained bearish momentum ensured the targets were met seamlessly.

Mangalam Cement: Profitable Long TradeTrade Overview: Mangalam Cement demonstrated a strong bullish move on the 15-minute chart, with all targets (TP1 to TP4) successfully achieved using the Risological Swing Trading Indicator . The trade capitalized on a well-timed entry near ₹919.05, with a stop loss (SL) set at ₹907.45, and hit the final target of ₹994.05, showcasing high accuracy.
Key Levels:
Entry Price: ₹919.05
Stop Loss: ₹907.45
Take Profits:
TP1: ₹933.35
TP2: ₹956.55
TP3: ₹979.75
TP4: ₹994.05
Fundamental Analysis: Recent news supports the price movement:
Strong Quarterly Earnings: Mangalam Cement reported a net profit of ₹32.8 million for the September quarter, signaling financial resilience.
Improved Profitability: The company has shown consistent growth in quarterly profits, boosting investor confidence.
Market Stats:
Current Price: ₹1,007.75 (+1.66%)
Volume: 142.78K (above average)
52-Week Range: ₹610.30 - ₹1,093.70
Mangalam Cement's robust fundamentals and the Risological Indicator's precision have once again delivered a profitable trade setup.


Suntek realtyFrom the Covid low of 145 zone prices have given a rally for two years and made a high of 590 in Jan'22. From there prices have retraced 50% and made a low of 272 and recovered back to hit new all time high.
Prices have made a continuation Head & shoulders pattern whose neckline is 500 zone. Prices have given the breakout the neckline and currently retesting the same. The measured target of the pattern is 950 zone.
Prices are likely to continue the uptrend towards 950-1000 zone in the coming months. The key level for the same is 380.

Graphite IndiaFresh View
Graphite CMP 571.85
SL 550
Looks good for a quick 5-10% gains
Swing/Positional

Linde plc | LIN Linde, Timeless Excellence
Linde is a timeless business with even better stability than other basic materials businesses. The company works in gases and has a near-unbroken EPS growth record of 8% annually
Linde is a market leader, and if you invest in the company, you're investing in the world's largest company for industrial gases. The company was originally a result of a takeover of British BOC in 2006, and again the 2018 merger of Linde and Praxair, a US company.
On the macro upside, there was a 1) supportive regulatory framework in the USA and in the EU on green opportunities and hydrogen, 2) the Ukraine invasion was also a key catalyst towards the energy transition, 3) the EU chip acts with €43 billion in supporting funds as well as the United States Chips and Science Act development for a value of approximately $52 billion, and 4) higher needs of specialty gas in EV car. Related to the micro upside, the company is more diversified on a GEO revenue basis and sells different product solutions starting from cylinders to bulk liquid. In addition with a follow-up note titled "Positive News Ahead", we reported Linde's lower cost structure with the Frankfort delisting. Aside from removing the dual listing expenses, we positively view this development because US companies' P/E multiple are usually higher compared to the EU one.
To support our MACRO buy case recap, in the second quarter, Linde announced two new projects with Evonik and Heidelberg Materials (both companies covered by our internal team). The company signed a long-term agreement to produce green hydrogen for Evonik in a 9-megawatt alkaline electrolyzer plant in Singapore. With Heidelberg, Linde will build a large-scale carbon capture close to the Lengfurt plant in Germany. As a reminder, cement production is estimated to be responsible for around 7% of global
in 2022, APD's earnings per share were at $8.38, and Linde's earnings per share were fairly similar at $8.23. For 2023, Air Products and Chemical EPS guide a midpoint at $11.40 while Linde's EPS is forecasted at $13.65. Looking at the ROCE, in Q4 2022, APD stood at 11.7% and Linde at 13.4%. In the last quarter, APD’s ROCE was flat on the two-year comparison, while Linde’s after-tax ROCE reached 24.0%.
While there are some business & regional nuances between the two leading companies (for instance, APD is lacking U.S. packaged gas business), here at the Lab, we believe are more inclined toward Linde, particularly when organic growth has been fairly similar. Cross-checking APD and Linde's last quarter results, we should recall that on a comparable basis, the German player volumes were flat with an average selling price up by 8%. On the other hand, APD increased its volume by 6% with an increase in the average selling price of 8% too. APD adj EBITDA grew by 13% while Linde achieved a plus 11%. However, Linde's EU exposure is greater than APD. Therefore, this is supportive of Linde's bottom line. In numbers, excluding the Engineering divisional performance, Linde's EMEA sales reached $2,177 million and represented 29.72% of the company's total sales. Compared to Q1 2022 number, turnover grew by 10% and was driven by a 13% of cost pass-through increase.

Aadhar Housing looks enticing. Aadhar Housing Finance Ltd. engages in the provision of home loans. It also offers loans to customers including individuals, Companies, Corporations, Societies or Association of Persons for purchase; construction; repair and renovation of residential property.
Aadhar Housing Finance Ltd. CMP is 434.25. The positive aspects of the company are Stocks Outperforming their Industry Price Change in the Quarter, Decrease in Provision in recent results, Company with Zero Promoter Pledge and Annual Net Profits improving for last 2 years. The Negative aspects of the company are Moderately High Valuation (P.E. = 22.4), Poor cash generated from core business - Declining Cash Flow from Operations for last 2 years and Companies with high market cap, lower public shareholding.
Entry can be taken after closing above 439 Targets in the stock will be 453, 468 and 480. The long-term target in the stock will be 495 and 518. Stop loss in the stock should be maintained at Closing below 399 or 375 depending upon your risk taking ability.
Disclaimer: The above information is provided for educational purpose, analysis and paper trading only. Please don't treat this as a buy or sell recommendation for the stock. We do not guarantee any success in highly volatile market or otherwise. Stock market investment is subject to market risks which include global and regional risks. We will not be responsible for any Profit or loss that may occur due to any financial decision taken based on any data provided in this message.

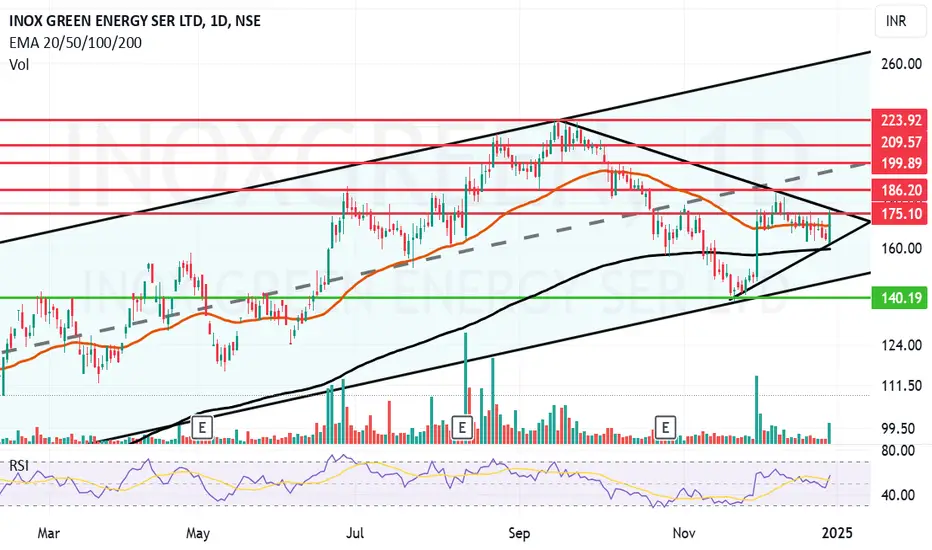
Inox green looking clean. Inox Green Energy Services Ltd. provides wind power operation and maintenance services. The company is engaged in the business of providing long-term O&M services for wind farm projects,
Inox Green Energy Services Ltd. CMP is 175.19. The positive aspects of the company are Company with Low Debt, Company able to generate Net Cash - Improving Net Cash Flow for last 2 years, Company with decreasing Promoter pledge, Annual Profit Growth higher than Sector Profit Growth and Negative to Positive growth in Sales and Profit. The Negative aspects of the company are extremely Highest Valuation (P.E. = 214.8) and Increasing Trend in Non-Core Income.
Entry can be taken after closing above 176 Targets in the stock will be 186 and 199. The long-term target in the stock will be 209 and 223. Stop loss in the stock should be maintained at Closing below 159 or 140 depending upon your risk taking ability.
Disclaimer: The above information is provided for educational purpose, analysis and paper trading only. Please don't treat this as a buy or sell recommendation for the stock. We do not guarantee any success in highly volatile market or otherwise. Stock market investment is subject to market risks which include global and regional risks. We will not be responsible for any Profit or loss that may occur due to any financial decision taken based on any data provided in this message.
QMCO at a Make-or-Break Moment: 5 Key Levels to Watch Now
Morning Trading Family
QMCO is approaching a critical crossroads, and the next move could bring some serious action. Let’s break it down with key levels and what they mean for traders.
If we break below $65.46
The outlook turns bearish. These are the levels to watch on the way down:
$60: First stop. This is where buyers might step in to test the waters.
$55: A deeper pullback that could bring more attention from the market.
$52: A critical level. If we hit this, it’s time to reevaluate what’s next.
If we break above $68.37
This would signal a potential shift in behavior, and the bulls might take over. Here’s what could happen:
$70: The next challenge for price to clear.
$73: A key level that could act as resistance.
Above $73?
That’s the green light for a long position. If the price moves past $73, it’s likely that the trend has flipped, and we could see much higher levels.
What You Can Do
-Keep a close eye on $65.46 and $68.37. These levels are your signals for the next move.
-Plan ahead—set stop-loss levels to manage your risk.
-Stick to your strategy and don’t rush into trades without confirmation.
If you found this helpful, don’t forget to follow, like, or boost this video. Have questions about other charts or feeling stuck with trading? Send me a DM—I’m here to help!
Kris/ Mindbloome Exchange
Trade What You See

HBL- Trading levelsHBL- range bound, like many stocks. Should be testing the lower end at 560-570 again in a weak market, ideal entry point for a good 15% or more.

Gallantt Ispat looking to gallop ahead. Gallant Ispat Ltd. engages in the manufacture of steel and steel products. It operates through the following segments: Agro, Iron and Steel, Power, and Real Estate.
Gallantt Ispat Ltd. CMP is 352.55. The positive aspects of the company are Company with Low Debt, Growth in Quarterly Net Profit with increasing Profit Margin (YoY). The Negative aspects of the company are High Valuation (P.E. = 26.7), High promoter stock pledges and Increasing Trend in Non-Core Income.
Entry can be taken after closing above 356 Targets in the stock will be 366 and 377. The long-term target in the stock will be 390 and 400. Stop loss in the stock should be maintained at Closing below 334 or 297 depending upon your risk taking ability.
Disclaimer: The above information is provided for educational purpose, analysis and paper trading only. Please don't treat this as a buy or sell recommendation for the stock. We do not guarantee any success in highly volatile market or otherwise. Stock market investment is subject to market risks which include global and regional risks. We will not be responsible for any Profit or loss that may occur due to any financial decision taken based on any data provided in this message.

Tolins Tyre looking to tilt the scale. Tolins Tyres Ltd. engages in the manufacture and sale of tires & accessories. It’s products include two-wheeler, three- wheelers, light commercial vehicle and agricultural tyres, pre-cured tread rubber and other accessories including bonding gum, tyre flap, vulcanizing solutions.
Tolins Tyres Ltd. CMP is 210.97. The positive aspects of the company are Company with Zero Promoter Pledge, The Negative aspects of the company are High Valuation (P.E. = 26.2), Increasing Trend in Non-Core Income.
Entry can be taken after closing above 212 Targets in the stock will be 222, 228 and 244. The long-term target in the stock will be 251 and 258. Stop loss in the stock should be maintained at Closing below 193 or 173 depending upon your risk taking ability.
Disclaimer: The above information is provided for educational purpose, analysis and paper trading only. Please don't treat this as a buy or sell recommendation for the stock. We do not guarantee any success in highly volatile market or otherwise. Stock market investment is subject to market risks which include global and regional risks. We will not be responsible for any Profit or loss that may occur due to any financial decision taken based on any data provided in this message.

Micron Technology (MU): Is a Big Move Just Around the Corner?Good morning, trading family!
Micron’s price has been moving between $92.90 resistance and $84.26 support, and it looks like a big move could be coming soon. Will we see a breakout to higher levels, or a pullback to retest support?
This is one of those setups where being patient and watching how the price reacts at these levels can really pay off. Stay ready, and let’s tackle this opportunity together!
Comment, like, follow, or send me a DM if you want a deeper analysis or more insights!
Kris/Mindbloome Exchange
Trade What You See

Atlassian | Transitioning from Server to Cloud & Now to AI Atlassian’s Secret to Success: Free Stuff, Fancy Upgrades, and Lots of AI
In 2020, Atlassian, the Australian software leader known for tools like Jira and Confluence, initiated its transition to a cloud-first model, phasing out its legacy Server business. This strategic pivot has reshaped its revenue model and driven significant growth.
Cloud Momentum
Atlassian’s Cloud revenue surged 31% year-over-year in Q1 FY25 to $792 million, surpassing investor expectations. The transition highlights the company’s agility and sustained expansion in a competitive market.
SaaS Growth Strategy
Atlassian employs a "land-and-expand" SaaS model, attracting customers with low-cost or free products and encouraging upgrades to premium features and additional solutions.
Key Highlights
-💻 300,000+ customers, including 84% of Fortune 500 companies, spanning software development, IT, and business teams.
- 🏢 524 enterprise customers generating $MIL:1M+ ARR, reflecting deeper engagement with large organizations.
-🤖 AI adoption: A 10x increase in Atlassian Intelligence usage this year has driven premium upgrades and enhanced productivity.
Innovation and Expansion
Atlassian continues to focus on product-led growth with recent launches like Atlassian Focus for enterprise strategy and Advanced Editions , offering premium features for existing tools.
Financial Perspective
-Profitability challenges: Q1 FY25 saw a $32 million operating loss (3% loss margin), a slight decline from last year. This is due to sustained R&D investments (51% of revenue, +2pp YoY), reflecting a long-term growth strategy over immediate profitability.
-Server phase-out: Ending the Server business has boosted cloud and data center revenue.
-Data Center growth: Revenue grew 38% YoY to $336 million, serving as a transitional solution for customers not yet ready for full cloud migration. Atlassian is positioning Data Center as a stepping stone rather than a permanent option.
Future Outlook
Atlassian is well placed to leverage rising demand for cloud based tools and AI advancements. However, challenges persist, including macroeconomic uncertainties, competition, and profitability pressures.
While generative AI offers new opportunities, it also presents risks such as increased competition and the potential slowing of paid seat growth, a critical revenue stream. Atlassian’s ability to navigate these challenges will determine its long-term success in this transformative phase.

Roblox | Where Kids Thrive, Stocks Pump and Gamers High FiveRoblox Economics: Teaching 13 Year Olds How to Out Monetize Wall Street
RBLX surges 50% since our first signal so let’s explore its potential upside
From PlayStation to Paychecks: How Roblox Gamified the Economy
From hosting virtual concerts with millions of participants to offering user generated games rivaling major studios, Roblox has evolved into a cultural phenomenon nearly 20 years after its PC debut. It is reshaping the social gaming and entertainment landscape.
CEO Baszucki Says Roblox Saves Lives; Haters Say It Destroys Wallets!
Founder CEO David Baszucki shared:
“Our mission is to connect 1 billion people with optimism and civility. This resonates deeply with me, as several parents have told me their children’s lives were saved through connections made on Roblox”
Roblox was already a standout in last year’s Future 50 ranking for its unique value. Currently, over 3 million creators develop games and experiences using Roblox Studio, its proprietary development tool. The platform’s economy thrives on its in-game currency, Robux, rewarding creators based on user spending. For instance, Uplift Games, a Roblox-exclusive studio, supports a 60 person team.
Two core growth drivers
-Content loop:High quality content attracts users, who then inspire the creation of even more content.
- Social loop:Increased participation enhances the platform's appeal to new users.
Exploring Roblox’s Expanding Universe
-User Generated Content (UGC):Like YouTube, Roblox empowers creators of all skill levels to share their visions.
- A Growing Metaverse:Beyond gaming, it hosts virtual events and educational activities, positioning itself as a hub for social interaction.
-Broadening Demographics: Once dominated by young users, Roblox now attracts older audiences. In Q3 2024, users aged 13+ made up 60% of its user base, up from 57% the previous year.
Roblox by the Numbers
-Daily Active Users (DAUs):89 million, up 27% YoY, with strong growth in APAC (+37%) and a 59% rise in Japan.
-User Engagement:20.7 billion hours logged, growing 29% YoY.
-Q3 Bookings:$1.1 billion (+34% YoY), reflecting robust user spending.
-Regional Bookings:North America (62%) and Europe (19%) dominate.
The October 2023 PlayStation launch doubled Roblox’s console presence, boosting both users and bookings. To attract console studios, Roblox announced a 70% revenue share for items priced $49.99 or higher, aiming to encourage premium content.
Challenges and Opportunities
-Short Seller Allegations: In October, Hindenburg Research accused Roblox of inflating metrics and neglecting child safety, highlighting its ongoing unprofitability. Despite initial concerns, the claims lacked substantial evidence.
-Profitability Issues: Operating margins remain negative (-30%), with high infrastructure, safety, and AI costs. Expense management is critical for turning a profit.
- Advertising Growth: Partnerships with DoubleVerify and Shopify pave the way for in-platform ads and merchandise. With users averaging over two hours daily, this represents untapped potential.
-Virtual Economy Improvements: Enhanced discovery features increased payers by 30% to 19 million, with a 6% rise in bookings per DAU.
- Cash Flow Strength: Free cash flow hit a record $218 million (+266% YoY), driven by efficient cost management.
- Stock-Based Compensation (SBC): SBC equals 29% of revenue, diluting shares (~3% annually). While common in tech, this high level raises concerns for long-term investors.
Future Outlook
Roblox raised its FY bookings guidance to $4.36 billion (+24% YoY). Achieving sustainable growth while tackling profitability challenges, content moderation, and investor dilution will determine its long-term success. The company’s ability to navigate these issues will shape its legacy in gaming and beyond.

Devyani International can give a tasty breakout. Devyani International Ltd. engages in the development and operation of quick service restaurant. It operates through Within India and Outside India segments. The company manages brands like Costa Coffee, KFC, Pizza Hut, Vangoo and The Good Street.
Devyani International Ltd. CMP is 172.37. The Positive aspects of the company is Company with Zero Promoter Pledge and increasing revenues for last 4 Quarters. Book value of the share is also increasing for the last 2 years. The Negative aspects of the company are extremely high Valuation (P.E. = 644.2), Companies Increasing Debt as per Annual Report, Declining Net Cash Flow : Companies not able to generate net cash.
Entry can be taken after closing above 174 Targets in the stock will be 181, 188 and 198. The long-term target in the stock will be 205, 218 and 223. Stop loss in the stock should be maintained at Closing below 167 or 158 depending on your risk taking ability.
Disclaimer: The above information is provided for educational purpose, analysis and paper trading only. Please don't treat this as a buy or sell recommendation for the stock. We do not guarantee any success in highly volatile market or otherwise. Stock market investment is subject to market risks which include global and regional risks. We will not be responsible for any Profit or loss that may occur due to any financial decision taken based on any data provided in this message.

Cyient DLM looking like it will deliver. Cyient DLM Ltd. engages in providing total electronic manufacturing solutions. It operates through the following segments: Aerospace and Defense, Medical, Industrial, and Transportation and Telecom. It offers design-led manufacturing (DLM) solutions.
Cyient DLM Ltd. CMP is 677.85. The Positive aspects of the company are Company with Low Debt, Company with Zero Promoter Pledge. The Negative aspects of the company are extremely high Valuation (P.E. = 79.8) and Inefficient use of shareholder funds.
Entry can be taken after closing above 686 Targets in the stock will be 722, 747 and 775. The long-term target in the stock will be 802, 841 and 869. Stop loss in the stock should be maintained at Closing below 649 or 599 depending on your risk taking ability.
Disclaimer: The above information is provided for educational purpose, analysis and paper trading only. Please don't treat this as a buy or sell recommendation for the stock. We do not guarantee any success in highly volatile market or otherwise. Stock market investment is subject to market risks which include global and regional risks. We will not be responsible for any Profit or loss that may occur due to any financial decision taken based on any data provided in this message.

TSLAhello friends
According to the upward trend, we can buy in pullback in the specified area, which is a good area.
Capital management should be observed.
Be successful and profitable.

BOROSIL RENEWABLE BUY VIEW BOROSIL RENEWABLE - UPTREND
TRADE REASON :
1) Monthly Uptrend and correction complete.
2) Day makes a Higher High and Good volume .
Entry - 557.50 Rs or correction zone
Target - 630 Rs
Stoploss - 428 Rs
Take it enjoy ...
