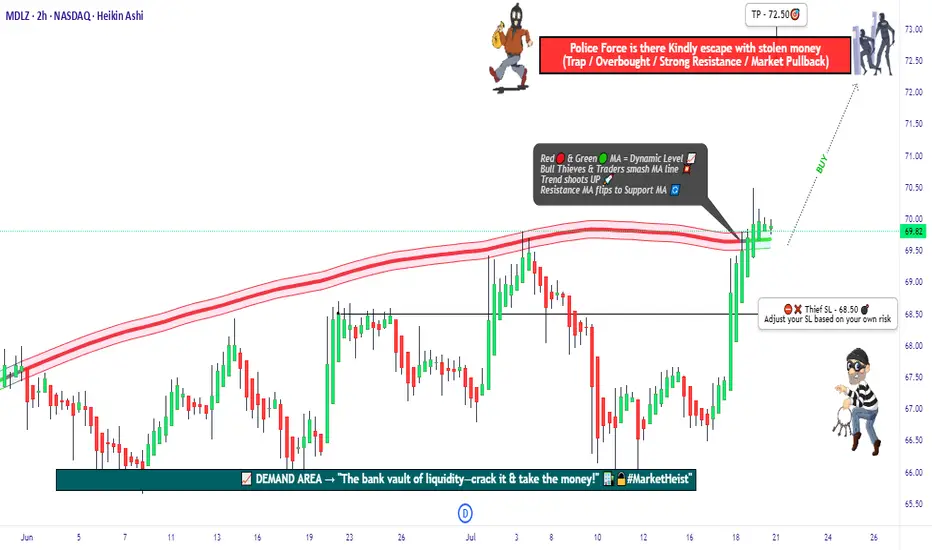
"MDLZ Heist LIVE! Quick Profit Grab Before Reversal!"🚨 MONDELEZ HEIST ALERT: Bullish Loot Zone! (Swing/Day Trade Plan) 🚨
Thief Trading Strategy | High-Risk, High-Reward Play
🌟 Greetings, Market Pirates! 🌟
Hola! Oi! Bonjour! Hallo! Marhaba!
To all Money Makers & Strategic Robbers 🤑💸—this is your blueprint to plunder "MONDELEZ INTERNATIONAL, INC" with precision.
🔎 THIEF TRADING ANALYSIS (Technical + Fundamental)
The Vault is Open! Bullish momentum detected, but caution—this is a high-risk police barricade zone (resistance level).
Overbought? Consolidation? Reversal? Yes. Bears lurk here, but we’re stealing profits before the trap snaps.
🎯 Target: 72.50 (or escape earlier if momentum fades).
🚨 Scalpers: Long-only! Use trailing stops to protect gains.
📈 ENTRY: How to Swipe the Loot
"Buy the Dip" Strategy: Optimal entries on pullbacks (15m/30m timeframe).
DCA/Layering Tactics: Spread limit orders for better risk control.
Aggressive Robbers: Enter now. Patient Thieves: Wait for retests.
🛑 STOP LOSS: Survival Rules
SL at 68.50 (nearest swing low wick on 2H chart).
Adjust based on risk/lot size—protect your capital!
⚡ CRITICAL ALERTS
📰 News Volatility: Avoid new trades during major releases. Lock profits with trailing stops!
📊 Fundamental Drivers: Check COT reports, macro trends, and sector sentiment Klick the 🔗.
⚠️ Reminder: This is NOT financial advice. DYOR and manage risk!
💥 BOOST THE HEIST!
Like 👍 + Boost 🔄 to fuel our next market robbery plan. Together, we trade smarter, steal bigger, and profit faster!
🚀 Stay tuned—more heists coming soon! 🤑🔥
Stockstrading
Is it right time and choice to buy UNH Stock - {15/07/2025}Educational Analysis says that UNH Stock (USA) may give trend Trading opportunities from this range, according to my technical analysis.
Broker - NA
So, my analysis is based on a top-down approach from weekly to trend range to internal trend range.
So my analysis comprises of two structures: 1) Break of structure on weekly range and 2) Trading Range to fill the remaining fair value gap
Let's see what this Stock brings to the table for us in the future.
Please check the comment section to see how this turned out.
DISCLAIMER:-
This is not an entry signal. THIS IS FOR EDUCATIONAL PURPOSES ONLY.
I HAVE NO CONCERNS WITH YOUR PROFIT OR LOSS,
Happy Trading.

AAPL can we hit 260?
Appears we are making a correction down to the levels of 208 then if that does not hold 205 with a possible drive up to the 260.
Question is are we going drive deeper with the correction ?
Be Careful folks this is a wild one
Trade Smarter Live Better
Kris/Mindbloome Exchange

NVIDIA(NVDA) Jackpot – Thief Trading Blueprint for Fast Profits!🚀 NVDA Stock Heist: The Ultimate AI Gold Rush (Scalping/Day Trade Plan)
🌟 Hey there, Market Pirates! 🏴☠️💰
Thieves, Traders, and Money Makers—gather around! Based on the 🔥Thief Trading Style🔥, here’s our master blueprint to loot NVIDIA’s AI-fueled rally. Follow the strategy on the chart—long entry is LIVE! Our escape? Near the high-risk Resistance Zone. Overbought? Consolidation? Reversal trap? Bears are lurking, but we’re stealing profits first! 🎯💸
🎯 Entry (The Vault is Open!)
"Swipe the AI gold at any price—the heist is ON!"
Pro Tip: Use buy limits within 15-30min near swing lows/highs for pullback entries.
🛑 Stop Loss (Thief’s Escape Route)
SL at recent swing low (4H timeframe)—adjust based on your risk & lot size.
Scalpers/Day Traders: Tighten SL if stacking multiple orders.
🏆 Target 🎯: 165.00 (The AI Jackpot!)
📈 Why NVDA?
Bullish momentum from AI dominance, earnings hype, and institutional FOMO.
Tech sector strength + chip demand = THIEF’S PARADISE.
📰 Fundamental Heist Intel
Need macro trends, sentiment, and intermarket analysis? 🔗 Check our bioo for the full robbery toolkit.
⚠️ Trading Alert: News & Position Control
Avoid new trades during earnings/news—volatility kills heists!
Trailing SLs = Locked profits. Don’t get greedy!
💥 Boost This Heist!
👊 Hit "Like" & "Boost" to fuel our next raid. Every click = More stolen profits! 🚀💰
🤑 Stay tuned—more heists coming! NVIDIA today… what’s next? 🤫🐱👤

AMGN : Long with Good RR We are above the 200-period moving average on the 1-hour chart.
And the trend line has been broken.
There is a good risk - reward ratio. Approximately : 2.48
Small position sizes can be tried.
Entry : 287.38 (Now)
Stop - Loss : 276.28
Take Profit Level : 315.0
Regards.

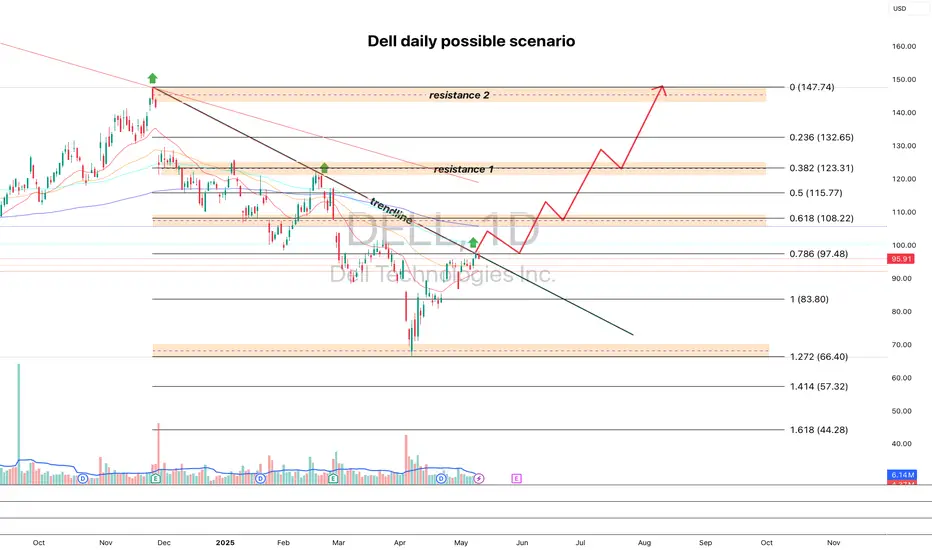
DELL looks good for pump dailyI'm watching DELL for a breakout of the trendline and a cross above the 100 MA — targeting a move toward 108.22, followed by a retest of the breakout and further upside targets at 123.31 and 147.74.
Fundamentally, the company looks strong, and the next earnings report is expected on May 29.
If you like the analysis, hit that rocket 🚀
SoFi Technologies (SOFI, 1D)On the daily chart, SoFi has broken out of its descending trendline, confirmed the breakout with a clean retest of the 0.618 Fibonacci retracement level at $12.33, and is now building upward momentum from this demand zone. This “buy zone” is acting as a launchpad for a potential mid-term move toward higher resistance levels.
Key Fibonacci-based upside targets:
– $13.48 (0.5 retracement)
– $14.64 (0.382 retracement)
– $16.07 (0.236 retracement) — within the defined target zone
– Extended target: $18.37 (1.0 Fibonacci projection)
Technical structure highlights:
– Breakout of multi-month downtrend + successful retest
– Price now trading above key EMAs (50/100/200)
– Volume expansion on bullish candles confirms demand
– Daily momentum favors further continuation toward the $14–$16 zone
– Premium supply zone above $16 may slow initial momentum but offers long-term potential toward $18+
Fundamental context:
SoFi is evolving as a vertically integrated fintech platform with strong brand recognition and growing user engagement across banking, investing, and lending services. As the company narrows losses and strengthens recurring revenue, investor interest in SOFI is growing — particularly as market appetite returns for high-quality fintech with path-to-profitability models.
The technical breakout is confirmed. As long as price remains above the $12.33–$12.50 buy zone, the bullish scenario remains valid with targets toward $14.64 and $16.07. A breakout above $16 would activate the full expansion toward $18.37 in the mid-term.

ADM 1D: 10-Month Channel Says Goodbye?Since July 18, 2024, ADM had been locked in a clean downward channel — well-behaved, well-respected. But in May 2025, the structure finally cracked: price broke out, crossed above the 50-day MA, and pulled back for a textbook retest right on the channel’s upper edge. So far, the breakout is holding. The next targets sit at 50.6 (0.618), 53.5 (0.5), and 56.5 (0.382). As long as price stays outside the channel, the bullish structure remains intact.
Connor’s RSI down below is quietly doing its job — already bounced from deep oversold, now curling up with momentum. It’s not flashy, but in this context it signals early strength before the crowd notices.
Fundamentally, ADM is still cleaning up after the early-2024 accounting scandal that nuked investor trust. But management moved fast: reinstated buybacks, tightened guidance, and Q1 2025 came in strong — $22.6B revenue, $0.88 EPS, both beating expectations. ADM remains a pillar of the U.S. ag sector, and in an era of global food anxiety, that means structural demand isn’t going anywhere.
Вот адаптированный перевод финального блока под **английский пост**, в том же живом и профессиональном стиле:
Enjoyed the idea? Like, share, and drop your thoughts in the comments.
It helps keep the content visible, free, and accessible to everyone.
Got your own charts or takes? Let’s discuss them below.

S&P 500 Breaks Out — Trump, Tariffs & Bullish Island PatternDonald Trump has mentioned the US stock market in every meeting he has held in the past few days, which has caused the US stock market indices , including the S&P500 Index ( SP:SPX ), to rise:
"Better go out and buy stocks now".
President Donald Trump told a crowd in Saudi Arabia on Tuesday that the markets are just getting started. “It’s going to get a lot higher,” he said, right as the S&P 500 posted its first gain since late February.
But one of the main reasons for the increase in the S&P 500 Index and US stocks is The United States has dropped its tariffs on Chinese goods to 30% , down from a brutal 145% , while China is slashing its own duties on US imports to just 10% , temporarily, for the next 90 days .
-------------------------------------------------
Now let's take a look at the S&P 500 Index chart on the daily time frame .
S&P500 Index managed to break the Resistance zone($5,737_$5,506) and 21_SMA(Weekly) by Breakaway Gap .
In terms of Classic Technical Analysis , the S&P500 Index has managed to form a Bullish Long Island Pattern , and this pattern is one of the continuing patterns and will be a sign of the continuation of the S&P500 Index's upward trend .
In terms of Elliott Wave theory , it seems that the S&P500 index has completed the corrective wave and is in new impulsive waves , which could cause a new All-Time High(ATH) to form.
I expect the S&P500 index to increase by at least +5% as it approaches the Uptrend line , and we will see the possibility of a new ATH .
Please respect each other's ideas and express them politely if you agree or disagree.
S&P 500 Index Analyze (SPX500USD), Daily time frame.
Be sure to follow the updated ideas.
Do not forget to put a Stop loss for your positions (For every position you want to open).
Please follow your strategy and updates; this is just my Idea, and I will gladly see your ideas in this post.
Please do not forget the ✅' like '✅ button 🙏😊 & Share it with your friends; thanks, and Trade safe.

Is This the Perfect Moment to Execute the Tesla Heist?💰 Tesla Stock Market Heist Blueprint 🚀
🌟 Hi! Hola! Ola! Bonjour! Hallo! Marhaba! 🌟
Dear Money Makers & Robbers, 🤑💰💸✈️
Here’s our grand plan: a 🔥Thief Trading Style heist🔥 targeting the TESLA stock! Let’s break in with this cunning strategy — chart-ready and primed for action!
🎯 Entry:
The vault’s open! Grab the bullish loot at any price — the heist is live!
Tip: For precision, use a buy limit order on 15m/30m swing highs or lows — that’s your perfect pullback entry!
🛑 Stop Loss:
Thief SL is stashed at the nearest swing low (or just below the MA on the daily chart ~300.00 for swing trades).
Tailor SL to your trade risk, lot size, and your thieving gang’s order plan.
🏴☠️ Target:
460.00 — or vanish before hitting the target to avoid the traps of the overbought zone!
💎 The Setup:
We’re seeing bullishness fueled by key factors: macro moves, fundamentals, sentiment, intermarket trends… it’s all in play! 📈🔗🌏
Check the macro, COT report, sentiment outlook, and future trend targets to stay ahead of the game!
⚠️ Trading Alert:
News releases can flip the game fast.
Avoid fresh trades during major news.
Use trailing stops to lock in those juicy profits and protect your loot.
❤️🔥 Support the Heist Crew!
💥Hit the Boost Button💥 — fuel our robbery plans and let’s keep cashing in every day!
The Thief Trading Style: slick, powerful, and ready for the next heist.
See you soon with another plan, fellow robbers! 🤑🐱👤🤩

What Is Stock Tape Reading, and How Do Traders Use It?What Is Stock Tape Reading, and How Do Traders Use It?
Tape reading is a real-time market analysis method used to track buying and selling pressure. Unlike technical indicators, which rely on historical data, tape reading focuses on executed trades, order flow, and liquidity shifts. Traders use it to assess momentum, identify institutional activity, and refine trade timing. This article explores how tape reading works, its role in modern markets, and how traders apply it to short-term decision-making.
The Origins and Evolution of Tape Reading
Tape reading began in the late 19th century when stock prices were transmitted via ticker tape machines, printing a continuous stream of price updates on paper strips. Traders would gather around these machines, scanning for large trades and unusual activity to anticipate market moves. One of the earliest and most well-known tape readers, Jesse Livermore, built his fortune by studying these price changes and spotting institutional buying and selling patterns.
By the mid-20th century, as markets became faster and more complex, ticker tape machines were replaced by electronic order books. Instead of scanning printed numbers, traders began using Level 2 market data and time & sales windows to track order flow in real time. This transition allowed for more precise liquidity analysis, making it easier to see how large orders impacted price movement.
The rise of algorithmic and high-frequency trading (HFT) in the 2000s further changed the landscape. Today, market depth tools, order flow software, and footprint charts have replaced traditional tape reading, but the core principle remains the same: analysing how buyers and sellers interact in real time. While charts and indicators offer historical insight, tape reading provides a direct window into current market behaviour, giving traders an edge in fast-moving conditions.
How to Read the Tape
Nowadays, tape reading is all about real-time market data—watching when and how orders are placed and filled to gauge momentum and liquidity. Unlike technical indicators, reflecting past price action, tape reading focuses on what’s happening right now. Stock, forex, and commodity traders use it to assess buying and selling pressure, spot large orders, and understand market sentiment as it unfolds. Here is the key information provided by tape reading:
Time & Sales
The time & sales window (the tape) displays every completed trade. Each entry shows time, price, trade size, and whether it hit the bid or ask.
- Trades at the ask suggest aggressive buying, as buyers are willing to pay the market price.
- Trades at the bid indicate selling pressure, as sellers accept lower prices.
- Large block trades often signal institutional activity—tracking these can reveal where big players are positioning.
Bid-Ask Activity
Nowadays, an order book is a part of tape reading. The order book (Level 2 or DOM) shows the number of buy and sell orders at different price levels. While not all orders get filled, traders watch for:
- Stacked bids (a high concentration of buy orders) near a price level, which may indicate strong buying interest.
- Stacked offers (large sell orders) acting as resistance.
- Orders rapidly appearing or disappearing, suggesting hidden liquidity or fake orders meant to mislead traders.
Volume and Trade Size
Changes in trade size and volume help traders judge the conviction behind a move:
- Consistent large trades in one direction can suggest institutions accumulating or distributing a position.
- A surge in small trades may indicate retail participation rather than institutional moves.
- A sudden drop in trade activity after a sharp move may hint at exhaustion or a potential reversal.
Trade Speed
The pace of executions matters.
- Fast, continuous transactions suggest urgency—buyers or sellers are aggressively taking liquidity.
- A slowdown in transactions near a key level can indicate hesitation or a shift in sentiment.
Tape Reading vs Technical & Fundamental Analysis
Tape reading differs from technical and fundamental analysis in both approach and timeframe. While technical traders study historical price patterns and fundamental analysts focus on company performance and economic data, tape readers focus on real-time order flow to assess market direction as it develops.
Technical Analysis
Technical traders rely on chart patterns, moving averages, and oscillators to identify trends and potential turning points. These tools are built on past price data, meaning they lag behind actual market activity. For example, a trader using a moving average crossover strategy waits for confirmation before acting, whereas a tape reader sees momentum shifting as it happens by watching the flow of orders.
Fundamental Analysis
Fundamental analysis is longer-term, based on financial statements, earnings reports, and macroeconomic indicators. Investors using this approach focus on factors like revenue growth, interest rates, and industry trends to decide whether a stock is undervalued or overvalued. Tape reading, by contrast, ignores these metrics entirely—it’s used by short-term traders reacting to immediate buying and selling pressure.
Where Tape Reading Fits In
Many traders combine approaches. A day trader might use technical analysis to find key price levels and then apply tape reading to fine-tune entries and exits. Similarly, a swing trader tracking earnings reports may use tape reading to see how large players are reacting. Each method provides different insights, but tape reading offers a unique advantage: it reveals market sentiment in real time, helping traders assess momentum before price movements become obvious.
Advantages and Disadvantages of Tape Reading
Tape reading gives traders an inside look at real-time market activity, but it also comes with challenges, especially in modern electronic markets.
Advantages
- Immediate Market Insight: Unlike lagging indicators, tape reading reflects live buying and selling pressure, helping traders react before price changes become obvious.
- Identifying Large Buyers & Sellers: Institutions often execute orders in patterns, leaving clues in the stock market tape. Recognising these can help traders gauge potential price direction.
- Fine-Tuning Entries & Exits: By tracking order flow near key price levels, traders can time their trades more precisely rather than relying on static chart signals.
- Useful in Fast-Moving Markets: Tape reading can be particularly valuable in scalping and day trading, where short-term momentum plays a key role.
Disadvantages
- Algorithmic Trading Distortion: High-frequency trading firms place and cancel orders rapidly, making it harder to interpret true supply and demand.
- Steep Learning Curve: Unlike technical analysis, which provides visual patterns, tape reading requires experience in spotting meaningful order flow changes.
- Mentally Demanding: Constantly watching the tape can be exhausting, requiring a high level of focus and quick decision-making.
- Less Effective in Low-Volume Markets: When liquidity is thin, tape reading becomes unreliable, as fewer trades mean less actionable data.
Modern Footprint Charts and Order Flow Software
While some stock tape readers rely on raw order flow data, many use footprint charts and order flow software to visualise buying and selling pressure more effectively.
Footprint charts display executed trades within each price bar, showing volume distribution, bid-ask imbalances, and point of control (POC)—the price level with the highest traded volume. This helps traders see where liquidity is concentrated and whether buyers or sellers are in control.
Order flow software offers heatmaps, cumulative delta, and volume profile tools. Heatmaps highlight resting liquidity in the order book, revealing where large players may be positioned. Cumulative delta tracks the difference between market buys and sells, helping traders assess momentum shifts.
These tools provide a more structured approach to tape reading, filtering out noise and making it easier to spot large orders, absorption, and potential reversals. While experience is still essential, modern software gives traders a clearer view of market behaviour beyond just raw time & sales data.
The Bottom Line
Reading the tape remains a valuable tool for traders looking to analyse real-time order flow and market liquidity. While there are numerous algorithms that place trades, understanding executed trades and bid-ask dynamics can provide an edge in fast-moving conditions.
FAQ
Is Tape Reading Still Useful in Trading?
Yes, but the application of tape reading in trading has changed. While traditional tape reading focuses on printed ticker tape, modern traders use time & sales data, Level 2 order books, and footprint charts to analyse order flow. High-frequency trading and algorithmic activity have made tape reading more complex, but it remains valuable for scalpers, day traders, and those tracking institutional activity.
What Are the Principles of Tape Reading?
Tape trading is based on real-time order flow analysis. Traders focus on executed trades (time & sales), bid-ask activity (order book), volume shifts, and trade speed to gauge buying and selling pressure. The goal is to understand how liquidity moves in the market and spot signs of institutional accumulation or distribution.
What Is the Difference Between Order Book and Tape?
The order book (Level 2 or DOM) shows pending orders at different price levels, representing liquidity that may or may not get filled. The tape (time & sales) displays completed transactions, showing actual buying and selling activity in real time.
What Is the Difference Between Technical Analysis and Tape Reading?
Technical analysis relies on historical price patterns and indicators, while tape reading focuses on real-time executed trades and market depth. Technical traders look at charts, whereas tape readers analyse live order flow to assess momentum and liquidity shifts.
How to Read Ticker Tape?
Modern ticker tape is displayed in time & sales windows on trading platforms. Traders monitor price, trade size, and whether transactions occur at the bid or ask. Rapid buying at the ask suggests demand, while consistent selling at the bid indicates selling pressure.
This article represents the opinion of the Companies operating under the FXOpen brand only. It is not to be construed as an offer, solicitation, or recommendation with respect to products and services provided by the Companies operating under the FXOpen brand, nor is it to be considered financial advice.

Palantir Technologies (PLTR) Shares Pull Back from Another HighPalantir Technologies (PLTR) Shares Pull Back from Another High
Shares in Palantir Technologies (PLTR), a company specialising in big data analytics software, have seen phenomenal growth in 2024, surging by approximately 340%, making it the top performer in the S&P 500 (US SPX 500 mini on FXOpen). This exceptional performance was driven by booming demand for artificial intelligence (AI) and machine learning technologies, which underpin Palantir’s products. The company has demonstrated steady growth in revenue and profitability, attracting major new clients across both the commercial and government sectors.
In 2025, PLTR remains among the market leaders, with its share price up roughly 60% year-to-date. In mid-May, it hit a fresh record high on the back of a strong fundamental backdrop. That backdrop was bolstered yesterday by news that the Pentagon had increased funding for its Maven Smart System programme — which involves deploying AI on the battlefield — to $1.3 billion through to 2029.
However, this news did not result in a new high. In fact, this week, PLTR stock have underperformed the broader stock market — and this may be explained by technical analysis.
Technical Analysis of the PLTR Chart
The interplay of supply and demand in 2025 has formed a broad ascending channel, characterised by:
→ The price breaking above the upper boundary in February following a strong earnings report, and dipping below the lower boundary in response to Donald Trump’s announcement of new international trade tariffs.
→ In mid-May (as shown by the arrow), the median line acted as support. However, after reaching the upper boundary, bullish momentum faded. As a result, the PLTR price has failed to hold recent highs and has fallen back below $130 — with market participants seemingly viewing the stock as overvalued, evidenced by false breakouts above previous peaks.
Given the above, it is reasonable to assume that PLTR may undergo a deeper pullback — potentially towards the median of the channel or even its lower boundary.
This article represents the opinion of the Companies operating under the FXOpen brand only. It is not to be construed as an offer, solicitation, or recommendation with respect to products and services provided by the Companies operating under the FXOpen brand, nor is it to be considered financial advice.

Coinbase (COIN) Shares to Be Added to the S&P 500Coinbase (COIN) Shares to Be Added to the S&P 500
According to media reports, shares of the cryptocurrency exchange Coinbase Global (COIN) are scheduled to be added to the S&P 500 index (US SPX 500 mini on FXOpen) on 19 May, replacing Discover Financial Services (DFS), which is in the final stages of being acquired by Capital One Financial (COF). The deal, having received all necessary approvals from regulators and shareholders of both companies, is expected to be completed on 18 May 2025.
As a result, Coinbase Global will become the first cryptocurrency-related company to be included in the S&P 500 index — a development that sent COIN shares surging to their highest level since late February. Inclusion in the S&P 500 is considered a bullish catalyst, as it suggests increased demand for the stock from index funds and signals improved prospects. Analysts have taken note; Rosenblatt Securities raised their price target for Coinbase Global Inc. (COIN) from $260 to $300.
Technical Analysis of COIN Stock Chart
In previous analyses of the COIN stock chart, we:
→ drew a descending channel;
→ identified a resistance zone in the $225–240 range (highlighted in purple).
However, the surge in demand triggered by the news of COIN’s inclusion in the S&P 500 has led to:
→ the descending channel appearing to lose relevance entirely;
→ the price gapping above the purple resistance zone;
→ increasing grounds to draw a potential upward trend trajectory (shown with blue lines).
Given the current momentum, it is possible that the COIN share price could rise towards the psychological $300 level, which acted as resistance earlier in 2025.
This article represents the opinion of the Companies operating under the FXOpen brand only. It is not to be construed as an offer, solicitation, or recommendation with respect to products and services provided by the Companies operating under the FXOpen brand, nor is it to be considered financial advice.

UPS United Parcel Service Stock. Top stock to buy in 2025UPS United Parcel Service Stock. Top stock to buy in 2025 after reaching the strong monthly demand level. It took 50 months to reach it and now it's trying to play out as expected. Long-term longs for this American stock.

Intel Corporation | INTCIntel reported second quarter earnings on Thursday, showing a return to profitability after two straight quarters of losses and issuing a stronger-than-expected forecast. the stock rose 7% in extended trading.
Here’s how Intel did versus Refinitiv consensus expectations for the quarter ended July 1:
Earnings per share: 13 cents, adjusted, versus a loss of 3 cents expected by Refinitiv.
Revenue: $12.9 billion, versus $12.13 billion expected by Refinitiv.
For the third quarter, Intel expects earnings of 20 cents per share, adjusted, on revenue of $13.4 billion at the midpoint, versus analyst expectations of 16 cents per share on $13.23 billion in sales.
Intel posted net income of $1.5 billion, or 35 cents per share, versus a net loss of $454 million, or a loss of 11 cents per share, in the same quarter last year.
Revenue fell 15% to $12.9 billion from $15.3 billion a year ago, marking the sixth consecutive quarter of declining sales.
Intel CEO Pat Gelsinger said on a call with analysts the company still sees “persistent weakness” in all segments of its business through year-end, and that server chip sales won’t recover until the fourth quarter. He also said that cloud companies were focusing more on securing graphics processors for artificial intelligence instead of Intel’s central processors.
David Zinsner, Intel’s finance chief, said in a statement that part of the reason the report was stronger than expected was because of the progress the company has made toward slashing $3 billion in costs this year. Earlier this year, Intel slashed its dividend and announced plans to save $10 billion per year by 2025, including through layoffs.
“We have now exited nine lines of business since Gelsinger rejoined the company, with a combined annual savings of more than $1.7 billion,” said Zinsner.
Revenue in Intel’s Client Computing group, which includes the company’s laptop and desktop processor shipments, fell 12% to $6.8 billion. The overall PC market has been slumping for over a year. Intel’s server chip division, which is reported as Data Center and AI, saw sales decline 15% to $4 billion plus Intel’s Network and Edge division, which sells networking products for telecommunications, recorded a 38% decline in revenue to $1.4 billion.moreover Mobileye, a publicly traded Intel subsidiary focusing on self-driving cars, saw sales slip 1% on an annual basis to $454 million and Intel Foundry Services, the business that makes chips for other companies, reported $232 million in revenue.
Intel’s gross margin was nearly 40% on an adjusted basis, topping the company’s previous forecast of 37.5%. Investors want to see gross margins expand even as the company invests heavily in manufacturing capability.
In the first quarter, the company posted its largest loss ever as the PC and server markets slumped and demand declined for its central processors. Intel’s results on Thursday beat the forecast that management gave for the second quarter at the time.
Intel management has said the turnaround will take time and that the company is aiming to match TSMC’s chip-manufacturing prowess by 2026, which would enable it to bid to make the most advanced mobile processors for other companies, a strategy the company calls “five nodes in four years.” Intel said on Thursday that it remained on track to hit those goals.
Nvidia has had an amazing run, but any emerging technology, such as AI, which is bottlenecked by a single company will have issues in growth. Consulting firm McKinsey has pegged the AI market to be worth $1 trillion by 2030, but also that it was in an experimental and in early phases of commercial deployment.
While Nvidia will likely retain its leadership in GPU hardware as applied to AI for the foreseeable future, it is likely that other hardware solutions for AI systems will also be successful as AI matures. While technologist may quibble on specifics, all major AI hardware today are based on GPU architectures, and as such I will use the terms and concepts of AI hardware and GPU architecture somewhat interchangeably.
One likely candidate for AI related growth may be AMD (AMD), which has had GPU products since acquiring ATI in 2006.However, unlike Nvidia, which had a clear vision for of general-purpose GPU products (GPGPU), historically, AMD had largely kept its focus on the traditional gaming applications. AMD has developed an AI architecture called XDNA, and an AI accelerator called Alveo and announced its MI300, an integrated chip with GPU acceleration for high-performance computing and machine learning. How AMD can and may evolve in the AI may be subject of a different article.
Another contender for success in the AI applications using GPU is Intel, who is the focus of this article. Intel has maintained a consistent, if low key focus on GPU hardware focused on AI applications over the last decade. Intel’s integrated HD Graphics is built into most modern processor ICs; however, these are insufficient compared to dedicated GPUs for high-end inferencing or machine learning tasks.
It has 2 primary GPU architectures in production release:
In 2019 Intel Corporation acquired Habana Labs, an Israel-based developer of programmable deep learning accelerators for the data center for approximately $2 billion. Habana Labs’ Gaudi AI product line from its inception focused on AI deep learning processor technologies, rather than as GPU that has been extended to AI applications. As a result, Gaudi microarchitecture was designed from the start for the acceleration of training and inferencing. In 2022 Intel announced Gaudi2 and Greco processors for AI deep learning applications, implemented in 7-nanometer (TSMC) technology and manufactured on Habana’s high-efficiency architecture. Habana Labs benchmarked Gaudi2’s training throughput performance for the ResNet-50 computer vision model and the BERT natural language processing model delivering twice the training throughput over the Nvidia high end A100-80GB GPU. So, Gaudi appears to give Intel a competitive chip for AI applications.
Concurrent with the Habana Labs’ Gaudi development, Intel has internally developed the Xe GPU family, as dedicated graphics card to address high-end inferencing or machine learning tasks as well as more traditional high-end gaming. Iris® Xe GPU family consists of a series of microarchitectures, ranging from integrated/low power (Xe-LP) to enthusiast/high performance gaming (Xe-HPG), data center/AI (Xe-HP) and high-performance computing (Xe-HPC). The architecture has been commercialized in Intel® Data Center GPU Flex Series (formerly codenamed Arctic Sound) and Intel® Arc GPU cards. There is some question on Xe GPU future and evolution. Intel has shown less commitment to the traditional GPU space compared to Gaudi. Nonetheless, it does demonstrate Intel ability to design and field complex GPU products as its business requires.
Intel has many other AI projects underway. The Sapphire Rapids chips implements AI specific acceleration blocks including technology called AMX (Advanced Matrix Extensions), which provides acceleration inside the CPU for efficient matrix multiplications used in on-chip inferencing and machine learning processing by speeding up data movement and compression. Intel has supporting technologies such as Optane, which while cancelled as a production line, is available for their needs of a high-performance non-volatile memory, one of the intrinsic components in any AI product.
Based on the above, Intel appears to have competitive hardware solutions, however if we look at Nvidia success in AI, it is a result of a much a software and systems focus as it is the GPGPU hardware itself. Can Intel compete on that front. Ignoring for the moment that Intel has a huge software engineer (approx. 15,000) resource, it also has- access to one of the leading success stories in perhaps the most competitive AI application – self driving cars.
Mobileye, who was acquired by Intel in 2017, has been an early adopter and leader, with over 20 years of experience in automotive automated driving and vision systems. As such, Mobileye has a deep resource of AI domain information that should be relevant to many applications. Mobileye has announced that it is working closely with Habana, as related divisions within Intel. While Intel is in the process of re-spinning out Mobileye as public company, Mobileye Global Inc. (MBLY), at present Intel still owns over 95% of shares, keeping it effectively an Intel division.
In looking at Intel, we have a company with the history, resources, and technology to compete with Nvidia and infrastructure. They have made significant investment and commitment to the emerging AI market, in times when they have exited other profitable businesses. It should also be understood that AI related product are a small percentage of overall Intel revenues (INTC revenue are more than twice NVDA, even if NVDA has 6x its market cap), and continues to keep its primary business focus on its processor and foundry business.
Hopefully for shareholders, Intel continues to push their AI technology and business efforts. Their current position is that this is strategic, but Intel is in a very fluid time and priorities may change based on business, finances, and of course the general interest and enthusiasm for AI. It is always worth noting that AI as a technical concept is mature, and appears to be cyclical, with interest in the technical community rising and falling in hype and interest once every decade or so. I remember working on AI applications, at the time labeled as expert systems in the 1980s. If we are currently at a high hype point, this may be temporary, based on near term success and disappointment in what AI does achieve. Of course, as always, “this time is different” and the building blocks of effective AI systems currently exist, where for previous iterations, it was more speculative.

What Is Random Walk Theory and Its Implications in Trading? What Is Random Walk Theory and Its Implications in Trading?
Random walk theory argues that market prices move erratic, making it difficult to analyse past data for an advantage. It suggests that technical and fundamental analysis provide little to no edge, as prices instantly reflect all available information. While some traders embrace this idea, others challenge it. This article explores the theory, its implications, criticisms, and what it means for traders navigating financial markets.
What Is Random Walk Theory?
Random walk theory reflects the idea that financial markets move erratic, making it impossible to analyse past price data for an advantage. The theory argues that price changes are random and independent, meaning past movements don’t influence future direction. This challenges both technical and fundamental analysis, arguing traders who attempt to time the market are essentially guessing.
The concept was first introduced by Maurice Kendall in 1953, who found no meaningful patterns in stock prices. Later, Burton Malkiel popularised it in A Random Walk Down Wall Street (1973), arguing that a blindfolded monkey throwing darts at a stock list would perform as well as professional traders. The underlying principle is that markets are efficient, instantly reflecting all available information.
The theory states that prices truly follow a random path, so a trader analysing charts or company reports has no statistical edge. It’s like flipping a coin—the next move is unrelated to the last. This has major implications: active trading strategies become questionable, and passive investing (e.g., index funds) may be a more logical approach.
However, while randomness can explain short-term price movements, longer-term trends still emerge. Factors like liquidity, institutional flows, and investor psychology create periods where price action deviates from pure randomness. This is where the debate arises—are markets entirely random, or do trends exist that skilled traders can take advantage of?
Understanding random walk theory helps frame this debate, offering insight into why some traders dismiss traditional analysis while others continue searching for patterns in price action.
Theoretical Foundations and Key Assumptions
The random walk hypothesis is based on mathematical models and probability, arguing that financial markets follow a stochastic process—where future price movements are independent of past trends. It builds on several key principles that shape how economists and traders view market efficiency and price behaviour.
Market Efficiency and Information Absorption
A core assumption of random walk models is that markets are efficient, meaning all available information is already reflected in asset prices. If new data emerges, prices adjust instantly, making it impossible to gain an edge through analysis. This aligns with the Efficient Market Hypothesis (EMH), which classifies efficiency into three forms:
- Weak form: Prices already reflect past movements, rendering technical analysis ineffective.
- Semi-strong form: Fundamental data (e.g., earnings reports) is priced in immediately, limiting the usefulness of research.
- Strong form: Even insider information is priced in, meaning no trader has an advantage.
Brownian Motion and Stochastic Processes
The theory borrows from Brownian motion, a model describing random movement, often used in random walk algorithms to simulate stock price fluctuations. Prices are treated as a series of independent events, much like molecules colliding in a gas.
No Clear Patterns
If prices truly follow a random walk, trends and cycles do not exist in a statistically significant way. This challenges traders who attempt to use historical data to analyse future movements.
Implications for Traders and Investors
If random walks in trading are truly the norm, then analysing market movements using historical price data is no more effective than flipping a coin. This has significant implications for both traders and long-term investors.
For traders relying on technical analysis, random walk theory presents a major problem. If price changes are independent, then tools like support and resistance, trendlines, and moving averages hold no real value. The same applies to fundamental analysis—if all available information is instantly priced in, then even detailed financial research doesn’t offer an edge.
This would mean day traders and swing traders aren’t consistently able to generate higher returns than the broader market. It’s why proponents of the theory often argue that attempting to time the market is a losing battle in the long run.
However, many supporters of the random walk theory advocate for passive investing, arguing that since, for example, individual stock movements are erratic, holding a diversified index fund is a more rational approach. Instead of trying to outperform the market, investors simply track it, reducing costs associated with frequent trading.
Criticism and Counterarguments
While random walk theory argues that market movements are independent, real-world trading data argues that markets are not entirely random. Critics point to patterns, inefficiencies, and the effectiveness of certain trading strategies as evidence that price action isn’t purely a coin flip.
Market Inefficiencies Exist
One of the biggest challenges to random walk theory is that markets display recurring inefficiencies. Certain price behaviours, like momentum effects, mean reversion, and seasonal trends, suggest that past movements do have an impact on future price action. For example:
- Momentum strategies: Studies show that assets that have performed well over the past three to twelve months tend to continue in the same direction. If price action were purely random, these trends wouldn’t exist.
- Earnings reactions: Stock prices often drift in the direction of an earnings surprise for weeks after the announcement. If markets were perfectly efficient, all adjustments would happen instantly.
Real Results
Random walk theory suggests that no trader can systematically outperform the market over time. Yet, some fund managers and proprietary traders have done exactly that. Warren Buffett’s long-term track record is often cited as evidence that skill, not just luck, plays a role in investing and trading. Similarly, hedge funds employing quantitative strategies have consistently generated returns, challenging the idea that price movements are entirely random.
The Adaptive Markets Hypothesis
A more flexible alternative is Andrew Lo’s Adaptive Markets Hypothesis, which seeks to reconcile the EMH’s claim that markets are rational and efficient with behavioural economists’ argument that markets are, in reality, irrational and inefficient. Instead of being entirely random, markets evolve based on participants’ actions, allowing patterns to emerge.
While random walk theory provides a useful framework, real market behaviour often deviates from its assumptions, leaving room for traders to find potential opportunities beyond pure randomness.
Practical Considerations for Traders
Even if markets exhibit randomness in the short term, traders still need a structured approach to analysing price action and managing risk. While random walk theory challenges traditional methods, it doesn’t mean traders should abandon analysis altogether. Instead, it highlights the importance of probabilistic thinking, risk control, and understanding market conditions.
Short-Term vs. Long-Term Price Behaviour
Markets may behave randomly on a daily or weekly basis, but longer-term trends can emerge due to liquidity shifts, institutional positioning, and macroeconomic factors. Traders focusing on short-term moves often work with probabilities, using statistical models and historical tendencies to assess risk and potential trade opportunities.
Risk Management in an Uncertain Market
If price movements are largely unpredictable, risk control becomes even more important. Traders typically limit their exposure using stop losses, position sizing, and diversification to avoid being caught on the wrong side of market volatility. Instead of focusing on certainty, they manage the probability of different outcomes.
The Role of Quantitative Strategies
While traditional chart patterns may be questioned under random walk theory, quantitative and algorithmic strategies analyse large datasets to identify inefficiencies. High-frequency trading firms, for example, exploit microsecond price discrepancies that aren’t visible to the human eye.
Rather than proving whether markets are fully random, traders adapt by testing, refining, and adjusting their strategies based on what works in real conditions. The most experienced traders accept uncertainty but structure their approach around probabilities and risk management.
The Bottom Line
Random walk theory challenges the idea that past price movements provide an edge, arguing that markets move erratically. While some traders accept this and focus on passive investing, others analyse inefficiencies to find potential opportunities.
FAQ
What Is the Random Walk Theory?
Random walk theory suggests that asset prices move unpredictably, with past movements having no influence on future direction. It argues that markets are efficient, meaning all available information is instantly reflected in prices. This challenges the idea that traders can consistently outperform the market using technical or fundamental analysis.
What Is the Meaning of the Random Walk Fallacy?
Critics of the theory argue that the random walk fallacy is the mistaken belief that financial markets move in a completely random manner, disregarding factors such as fundamental analysis, technical patterns, and behavioural finance that can influence price trends. This misconception may cause traders to overlook potential opportunities for strategic analysis.
What Are the Criticisms of Random Walk Theory?
Critics argue that markets display patterns, inefficiencies, and behavioural biases that contradict pure randomness. Studies on momentum, mean reversion and liquidity effects show that past price movements do influence future trends.
This article represents the opinion of the Companies operating under the FXOpen brand only. It is not to be construed as an offer, solicitation, or recommendation with respect to products and services provided by the Companies operating under the FXOpen brand, nor is it to be considered financial advice.

S&P 500 Rally Exhausted? Watch This Level for the Next Drop!The S&P 500 Index( SP:SPX ) has finally touched the Resistance zone($5,680-$5,500) as I expected in my previous post .
The S&P 500 Index is moving near the Resistance zone($5,680-$5,500) , the Resistance line, and Yearly Pivot Point .
Also, we can see the Regular Divergence(RD-) between Consecutive Peaks .
In terms of Elliott Wave theory , it seems that the S&P 500 Index is completing the Zigzag Correction(ABC/5-3-5) , and if the uptrend line breaks , we can confirm the end of the Zigzag correction .
When the S&P 500 Index started to rise on April 22 , Bitcoin also started to rise at the same time , so a decline in the S&P 500 Index can cause Bitcoin ( BINANCE:BTCUSDT ) to decline .
I expect the S&P 500 Index to drop to at least $5,313 AFTER breaking the uptrend line .
Note: If the S&P 500 Index touches $5,712, we can expect more pumps.
Please respect each other's ideas and express them politely if you agree or disagree.
S&P 500 Index Analyze (SPX500USD),2-hour time frame.
Be sure to follow the updated ideas.
Do not forget to put a Stop loss for your positions (For every position you want to open).
Please follow your strategy and updates; this is just my Idea, and I will gladly see your ideas in this post.
Please do not forget the ✅' like '✅ button 🙏😊 & Share it with your friends; thanks, and Trade safe.

Tencent Holdings LtdIs Tencent Stock a Buy Now?
Tencent posted its third quarter earnings report on Nov. 16. The Chinese tech giant's revenue fell 2% year over year to 140.1 billion yuan ($19.8 billion), which represented its second consecutive quarter of declining revenue since its IPO in 2004. Its net profit rose 1% to 39.9 billion yuan ($5.6 billion). On an adjusted basis, which excludes its investments and other one-time items, its net profit grew 2% to 32.3 billion yuan ($4.5 billion). Those growth rates seem anemic, but Tencent's stock had already been cut in half over the past two years amid concerns about China's tightening regulations, slowing economic growth, and COVID19 lockdowns. So is it the right time to take the contrarian view and buy Tencent as a turnaround play? Let's review its core businesses and valuations to decide.
Tencent generated 31% of its third quarter revenue from its video game business. Domestic games, which include its blockbuster game Honor of Kings, accounted for 73% of that total. The remaining 27% came from overseas hits like League of Legends, Valorant, and PUBG Mobile.Its domestic gaming revenue fell 7% year over year, representing its third consecutive quarter of shrinking revenue, as it grappled with tighter playtime restrictions for minors in China over the past year. Those restrictions also coincided with a temporary suspension on new video game approvals in China, which started last July and ended this April.Its international gaming revenue rose 3% year over year, accelerating from its 1% decline in the second quarter, as new games like Tower of Fantasy and Goddess of Victory: Nikke attracted new players. Unfortunately, its overseas growth still couldn't offset its declining domestic revenue.
As a result, Tencent's total VAS (value-added service) revenue which includes its gaming divisions, social media platforms, and streaming media subscriptions -- declined by 3% in the third quarter but still accounted for more than half of its top line. This core business might gradually stabilize as Tencent expands its international gaming business, but it will likely remain under intense pressure as long as the Chinese government continues to scrutinize the gaming industry.
200$ was one of the biggest support and great opportunity to buying the dip. 300-320$ is a big resistance level for tencent and if bulls win that battle then 350$ is next but
can we back 250 or even 200$ again? YES

Snow White's very low ratings - Bullish Disney stock ?The SnowWhite IMDB rating can't get any worse - could the same be said of Disney stock?
Price is the ultimate proof but buying the shares of a well established company when sentiment is at a low point can be a fruitful endevour.
The poor box office showing + very weak ratings for Snow White - maybe a contrarian buy signal ?
A) The stock is attempting a long term double bottom via is 2020 + 2023 lows
B) A breakout over the downtrend line (orange) could confirm a bullish trend change
Bottom of the ratings ➡️ Bottom in the stock? NYSE:DIS

Time to buy TESLA stocks? $TSLA March came with a lot of bloodbath for the US stock market, among these sea of red was Tesla NASDAQ:TSLA ; but it seems the giant American EV company might be gearing for a massive move upwards as it nears its buying zone.
What do you think?

Reversal Trade - Godfrey PhilipGodfrey Philip
This stock is forming good Weekly Tighter Close. Let's wait & check out how it behaves this week.
17 Feb Week Rejection is alarming.
No follow through to that rejection in last week. This week is defending last weekly low so far.
Highly Risky Trade, Rs.600, I am targeting 10% i.e. 24 Feb 25 Weekly High.
This is not a Buy Reco, Do your own Diligence. This is purely for educational purpose.

ASI Update - 17/02/2025🔹 The ASI Index remains in a strong uptrend, with bullish momentum pushing prices towards major resistance zones.
Key Levels to Watch:
✅ Resistance:
17,837 → 1.618 Fibonacci Extension and a critical resistance level.
17,093 - 17,092 → Short-term resistance before Fib extension.
🔻 Support:
16,728 → Key support if ASI pulls back.
16,242 - 15,523 → Major demand zones.
📈 Bullish Scenario:
If 17,837 is broken with volume, ASI could continue its rally towards new highs.
📉 Bearish Scenario:
Failure to break resistance may lead to a pullback towards 16,728 or lower support levels.
📝 Conclusion:
ASI remains bullish, but traders should watch for reactions at resistance levels.
A breakout above 17,837 would confirm further upside, while a pullback would provide potential re-entry zones.
💬 Let me know your thoughts in the comments! 👇
#CSE #ASI #SriLankaStocks #StockMarket #TradingView

TSLA ANALYSIS!Tesla stock is approaching the green support zone 🟩. There is a potential bounce up 📈 as buyers could step in again with increasing trading volume.
