Why Is The Stock Market So Difficult To Predict?━━━━━━━━━━━━━
Let’s assume stock prices have been rising for several years. Investors realize that a correction will come and stock prices will tumble. What we don’t understand is what will trigger the selloff or exactly when it will occur. Therefore, some investors will sit on the sidelines holding cash, waiting for the opportune time to get in. Those who are willing to assume the risk may jump in because the return on cash is so low and it hurts to earn zero while watching stocks move higher. This begs a couple of key questions. If you’re on the sidelines, how will you know when to get in? If you’re already in, how will you know when it’s time to get out? If the stock market was predictable, these questions could easily be answered. However, it is not. There are actually three issues an investor should consider. The first is understanding the point at which stock prices are fairly valued. The second issue is the event that will cause a downturn
Stockstrading

CTRM CHANGING STRUCTURE - HUGE UPSIDE POTENTIALHello traders, While I was checking some opportunities, I found this nice setup. We were in 2 clear bullish patterns and finally it's changing structure. I'm waiting for upside push soon.

AMC HopiumHere is my longterm Elliot Waves count for AMC. We are at the bottom probably and we should see prices above $100 if this is true.

DropBox (DBX): Can DROP From The Current LevelsTraders, Dropbox (DX) can fall from the current levels as it has reached an FCP zone and is forming a wedge as well. However there is an inverse head and shoulders pattern which can play out in the longer term. A break out above the this zone can take Dropbox to the next FCP zone above.
Rules:
1. Never trade too much
2. Never trade without a confirmation
3. Never rely on signals, do your own analysis and research too
✅ If you found this idea useful, hit the like button, subscribe and share it in other trading forums.
✅ Follow me for future ideas, trade set ups and the updates of this analysis
✅ Don't hesitate to share your ideas, comments, opinions and questions.
Take care and trade well
-Vik
____________________________________________________
📌 DISCLAIMER
The content on this analysis is subject to change at any time without notice, and is provided for the sole purpose of education only.
Not a financial advice or signal. Please make your own independent investment decisions.
____________________________________________________

PFE (PFIZER) At A crucial Breakout LevelTraders, PFE (PFIZER) has risen to the a crucial level. Watch out for the move down. However a breakout above from this level can take this to 49/50 price and even higher.
Rules:
1. Never trade too much
2. Never trade without a confirmation
3. Never rely on signals, do your own analysis and research too
✅ If you found this idea useful, hit the like button, subscribe and share it in other trading forums.
✅ Follow me for future ideas, trade set ups and the updates of this analysis
✅ Don't hesitate to share your ideas, comments, opinions and questions.
Take care and trade well
-Vik
____________________________________________________
📌 DISCLAIMER
The content on this analysis is subject to change at any time without notice, and is provided for the sole purpose of education only.
Not a financial advice or signal. Please make your own independent investment decisions.
____________________________________________________

FAANG Stocks: Ready To FALL? Hidden Fibonacci Pattern FormingTraders, FAANG (Facebook, Apple, Amazon, Netflix and Google) share basket is forming a hidden pattern which can push these stocks down. However there are certain conditions that we must have. In this top down analysis we see how Fibonacci Confluence Pattern (FCP Pattern) is forming a zone which can create a massive trade opportunity.
If you are invested in any of these stocks then you must watch it so that you are aware of this. Also if you are looking for short opportunity because you think markets are over extended, then also you must be aware of this.
I also posted a similar pattern which is appearing on Netflix. Find that in the related ideas below.
Rules:
1. Never trade too much
2. Never trade without a confirmation
3. Never rely on signals, do your own analysis and research too
✅ If you found this idea useful, hit the like button, subscribe and share it in other trading forums.
✅ Follow me for future ideas, trade set ups and the updates of this analysis
✅ Don't hesitate to share your ideas, comments, opinions and questions.
Take care and trade well
-Vik
____________________________________________________
📌 DISCLAIMER
The content on this analysis is subject to change at any time without notice, and is provided for the sole purpose of education only.
Not a financial advice or signal. Please make your own independent investment decisions.
____________________________________________________

ROKU
📈 meanwhile still above the key level short term (yellow zone) have possibilities following up to $600, if not, could drops below $400


DIS
Remain the support on $165-$170, bounce, maybe in the next days-weeks Disney up to last high and reach the next target on $220

Adverum Biotechnologies Inc 🧙Adverum Biotechnologies Inc is a US-based clinical-stage gene therapy company. It develops gene therapy product candidates intended to provide durable efficacy by inducing sustained expression of a therapeutic protein. The company has primarily generated revenue through license, research and collaboration arrangements with its strategic partners. Its lead product candidate is ADVM-022 which is a single, in-office intravitreal (IVT) injection gene therapy designed to deliver long-term durability with treatment response, reduce the treatment burden of frequent anti-vascular endothelial growth factor (anti-VEGF) injections, and improve real-world vision outcomes for patients.
If you want not to miss ideas like this one,🎯 subscribe and press a thumb up! 👍 Have a question? Don't be shy to ask! 🤓 Interested to study how to analyze charts, follow me!

ARK invest goodGreat opportunity here with ARK invest. Head n Shoulder now formed. The first wave of the daily EW was completed. Small retracement now to 142.55 giving a great buy opportunity with SL at 134.90. If you are a more conservative play on the resistance of the HnS neck. 189 the first target, looking to unlock some profit at that level, Final target 205, completing the 3 wave. This is a 9 RR, great play. Holding position 3- 4 months. I will share other opportunities soon...Few others are already at play.
SHARE and spread the LOVE

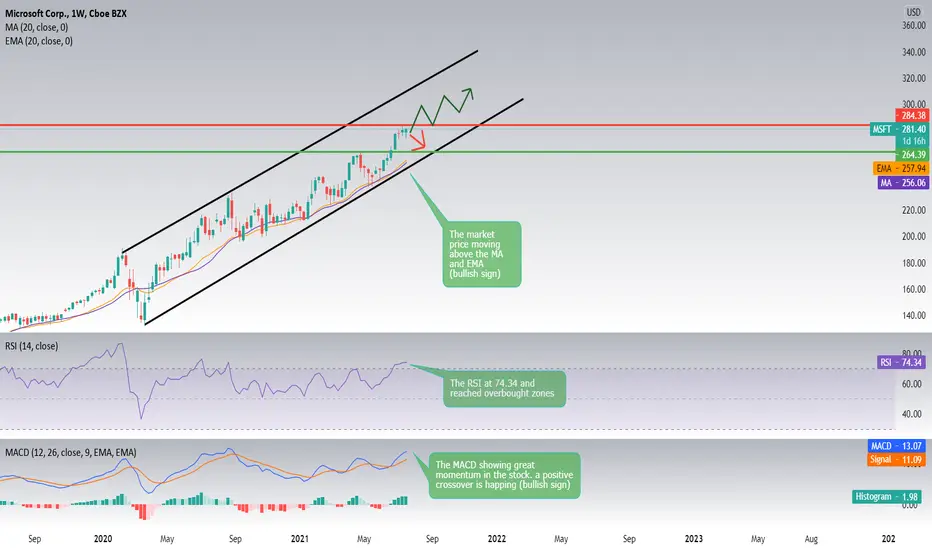
Microsoft weekly analysis (MSFT)Hello everyone , as we all know the market action discounts everything :)
The MSFT seems to continue its bullish movement and the stock price seems to be trading in an upward channel as we are getting higher highs and higher lows, MSFT is currently trading near its 52 week high, which is a good sign. The S&P500 Index is also trading near new highs, which makes the performance in line with the market.
The average volume is 23872600. This is a good sign as it is always nice to have a liquid stock.
The long and short term trends are both positive. This is looking good! We could be seeing the price reaching a new high soon and even maybe hitting the ranges if 290.
using different indicators to understand the trend where :
1_The stock price at 281.40 trending above the MA and the EMA. MA at 256.06 and EMA at 257.94 (bullish sign)
2_The RSI is at 74.34 and reached overbought zones showing great strength in the market with no divergences between the market and the indicator. (bullish sign)
3_The MACD showing great momentum in the stock. a positive crossover is happing (bullish sign)
Support & Resistance points :
support Resistance
1_ 276.86 1_284.38
2_ 272.96 2_288.00
3_ 269.34 3_291.90
Fundamental point of view :
MSFT's return on assets of 18.13% is amongst the best returns of the industry. MSFT outperforms 95% of its industry peers. The industry average return on assets is -4.03%.
The stock has a profit margin of 35.02%. This is amongst the best returns in the industry. The industry average is -8.63%. MSFT outperforms 95% of its industry peers.
Microsoft said Wednesday it’s acquiring CloudKnox, a start-up whose software helps companies reduce the amount of access they provide to their cloud resources. Terms of the deal weren’t disclosed.
The move represents another step Microsoft is taking to expand its security business, in addition to working to keep Windows and its other products secure.
Over the past 5 years, MSFT shows a quite strong growth in Earnings Per Share. The EPS has been growing by 18.13% on average per year. And the stock has a Current Ratio of 2.29. This indicates that MSFT is financially healthy and has no problem in meeting its short term obligations.
_____________________________________________Make sure to Follow and Like for more content_____________________________________________
This is my personal opinion done with technical analysis of the market price and research online from fundamental analysts for The Fundamental point of view , not financial advice.
If you have any questions please ask and have a great day !!
Thank you for reading.
ExxonMobil (XOM) Nice Entry Point on D1 timeframe.ExxonMobil (XOM),D1: Mirror support level + Bollinger bands + Spinning tops + Oversold

Fastly FSLY is bottoming outFastly stock FSLY is bottoming out forming a potential higher low.
The stock could target $53.94 - $57.45 - $60.65 levels consecutively.

Tesla long?This is tesla on the daily timeframe, we can see that price is finding buy pressure at the daily uptrend which is price action confirmation for us. we know that Nasdaq is seeing a move to the downside but I'm very interested in this quick in quick out to catch a few pips and if we do see another move to the downside it will be after another touch of the weekly zone. what I'm going to wait for on this stock is now a minor exhaustion on the 1h and then look for a nice quick in quick out.

Chevron Long (R/R) (1/1.2)Perfect moment to buy this stock again. It is now at a previous high that becomes support and it is at the 200 green ma line.

DouYu International Holdings Ltd ADR 🧙DouYu International Holdings Ltd is a game-centric live streaming platform in China. The company operates its platform on both PC and mobile apps, through which users can enjoy immersive and interactive games and entertainment live streaming. It generates revenues through live streaming and advertisement.
Industry
Internet Content & Information
If you want not to miss ideas like this one,🎯 subscribe and press a thumb up! 👍 Have a question? Don't be shy to ask! 🤓 Interested to study how to analyze charts, follow me!

JNJits just idea... breakout or breakdown 👀 possible rising wedge, ascending triangle or still sideways...

Splunk (SPLK) Stock Buy Signals on W1Splunk (SPLK),W1: Support line + Breakout of resistance line + Volume + Sell off

COIN (update every week)the best zone was the purple zone for bought it, now, a week after is rising 📈

Possible ADY Long Position!ASX:ADY
SELF DEVELOPMENT/METHODOLOGY/PSYCHOLOGY
SMP Strategy
Market Direction: Long Position
Chart time frame - Daily
Timeframe - 30 days
A – Activating Event
Market will meet support in zone @ current levels - ... . In order to enter into this trade, the pair MUST be in line with my Entry Procedure....
B – Beliefs
Market will move towards the first Target 1 level @ 0.03
C - Fundamentals that may affect the pair
N/A
D - Trade Management
Entered @ .....
Stop Loss @ .....
Trailing Stop Loss@.....
Target 1 @ 0.03
Target 2 @ ....
Risk/Reward @ 1.4
Happy trading :)
Follow your Trading plan, Remain disciplined and Keep learning !!
Please Follow, Like,Comment & Follow :)
This information is not a recommendation to buy or sell. It is to be used for educational purposes only!

Possible AUZ Long Position!!ASX:AUZ
SELF DEVELOPMENT/METHODOLOGY/PSYCHOLOGY
SMP Strategy
Market Direction: Long Position
Chart time frame - Daily
Timeframe - 30 days
A – Activating Event
Market will meet support in zone @ current levels - ... . In order to enter into this trade, the pair MUST be in line with my Entry Procedure....
B – Beliefs
Market will move towards the first Target 1 level @ 0.04
C - Fundamentals that may affect the pair
N/A
D - Trade Management
Entered @ .....
Stop Loss @ .....
Trailing Stop Loss@.....
Target 1 @ 0.04
Target 2 @ ....
Risk/Reward @ 1.4
Happy trading :)
Follow your Trading plan, Remain disciplined and Keep learning !!
Please Follow, Like,Comment & Follow :)
This information is not a recommendation to buy or sell. It is to be used for educational purposes only!
