A life-changing SBET long ideaSBET stock presents an amazing long opportunity that has a potential to do over 100x. After the break out of a down trend line, price retraced to the support, with price closing above this support level.
To advantage of this long opportunity, you can buy from the current market price while the exit can be at $1.34 and the targets can be at $123.70, $178.48, $541.22, $1041.90 and the final target at $2155.20.
Confluences for the long opportunity are as follows:
1. Break out of down trendline
2. Retest of the down trendline and support level.
3. Bullish divergence signal from awesome oscillator.
Disclaimer: This is not a financial advice. The outcome maybe different from the projection. Don't take the signal if you're not willing to accept the risk.
Stocktobuy

GME LONG IDEA UPDATEDIn my previous post regarding the long opportunity on GME stock, I called a long signal after a break out of a downtrend line. However, price had dropped down to the demand zone, giving another long opportunity.
To take advantage of this long opportunity, you can buy at the current market price, while the exit will be at $20.30 and the targets can be at $35.70, $47.90 and the final target at $64.70.
Confluences for the long idea are as follows:
1. Weekly break of structure
2. Valid Inducement
3. Orderflow
4. Price within the discount
5. Price respecting bullish trendline
6. Hammer candlestick confirmation
7. Price at a support level
Disclaimer: This is not a financial advice. The outcome maybe different from the projection. Don't take the signal if you're not willing to accept the risk.

DANGSUGAR LONG IDEARecently, the price of DANGSUGAR stock has broken out of a bearish trendline with a strong bullish weekly candle. This shows a strong intention to continue the buying momentum. To take advantage of the long opportunity, you can buy at the current market price while you can also wait for price to drop to N42.95. The stop can be at N37.70 while the target are N47.85 and N63.50 (final target). If this zone should fail, then the next long opportunity will be at N33.50 with a stop at N30.35 based on market structure.
Confluences for the long idea:
1. Trendline and resistance breakout with a strong bullish weekly candle.
2. Strong volume momentum on the volume indicator.
3. Market structure is bullish.
Disclaimer: This is not a financial advice. The outcome maybe different from the projection. Don't take the signal if you're not willing to accept the risk.

WATCH OUT FOR VERITASKAPFrom around 0.83, VERITASKAP created an all-time high of around 1.81. This happened between August 2024 and September 2024. Then, price dropped into the discount level where is currently. The current price action shows that price is in a discount level, at a demand zone and within a falling wedge.
From a chart pattern perspective, falling wedge can be seen on the chart and a break out of the downtrend and resistance level around 1.06 with a bullish candle closing above these levels will serve as a strong indication that the stock is ready to rally up as much as the all-time high.
From a technical indicator perspective, awesome oscillator is below 0, showing that the stock is oversold. In addition, there is a bullish indication on the awesome oscillator as shown by its colour and upward movement. This is pointing to the fact that the value of the awesome oscillator is moving towards 0 and can cross over it which can be a good indication for a rise in price as well.
From a smart money concept perspective, a break of the last high (around 1.27) that led to the last bearish internal break of structure will as serve as indication of a bullish trend. Hence, the target will the all-time high.
Either way, the stock has a good potential. An aggressive trader or investor may buy at the current market price. While a conservative trader or investor may wait for a breakout.
Watch out for the confluences indicating potential rise in price so as to not miss out on the benefit.

Take Two | TTWO & GTA VI. Part IITakeTwo Interactive is preparing for the biggest catalyst in the company's history with the release of GTA 6. Although no definitive timetable has been set for GTA 6, the game will almost certainly release in 2024 or 2025 at the latest given all the information that has come out. Moreover, TTWO itself has started opening up about GTA 6, which is a hint that an announcement is near. The impact that GTA 6 will have on TTWO cannot be understated, given how much resources have been spent developing GTA 6 and the growing consumer frenzy surrounding the title.TTWO could see more upward momentum as GTA 6's release closes in.
GTA 6 is by far the most anticipated video game in the industry's history. The game is so hyped, in fact, that individuals have crashed televised events purely to protest for the release of GTA 6. Even Starfield, which is an incredibly hyped game in its own right, had it Gamescon presentation disrupted by a fan calling for GTA 6. GTA 6 has not even been announced yet, and it seems to have fully captured the attention of the gaming world.
This level of organic hype is an incredibly positive sign for TTWO and its investors. Despite the fact that GTA 5 had nowhere near the hype as GTA 6 at similar stages in their development, GTA 5 still managed to become the best-selling triple A game ever made, with ~185 million units sold. This is a testament to GTA 6's potential, both on a commercial and even cultural standpoint.
If GTA 6 manages to meet or exceed consumer expectations, TTWO should see its shares surge. Given the hysteria surrounding the title, positive reviews will only supercharge demand as consumers will likely find any reason to get their hands on the game. Considering the amount of resources TTWO is rumored to be spending on developing GTA 6, coupled with Rockstar's track record of producing masterpieces, there is very little chance that GTA 6 disappoints.
While GTA is TTWO's most important IP, the company also boasts a strong lineup beyond GTA. In fact, some of its other franchises are bestsellers in their own right. Red Dead Redemption, for instance, has sold more than 55 million units and continues to sell at a solid pace despite the game being nearly 5 years old. Red Dead Redemption has also been critically praised as one of the best triple A games ever made.
TTWO currently has one of its most robust product pipelines in the history of the company across all of its studios. The company has even diversified into mobile gaming, which is proving to be an increasingly large segment in the gaming industry. In fact, TTWO made a huge acquisition in Zynga for a whopping $12.7 billion. Zynga is one of the largest mobile gaming studios in the world and owns massively popular IPs like FarmVille.
Despite TTWO's growing pipeline, the company is still relatively top-heavy compared to peers like EA (EA) or Activision Blizzard (ATVI). This means that underperformance for its flagship franchises, especially GTA, will almost certainly cause the company's value to plummet. So much of TTWO's future prospects are dependent upon the success of GTA 6, especially considering how much revenue the game is expected to pull in.
To gain some perspective on how important the GTA franchise is for TTWO, GTA has generated over $8 billion in revenue since GTA 5's release in 2013. TTWO itself is only worth ~$23 billion. GTA online, for instance, still contributes heavily to the company's recurring revenue and bookings, which came in at $1.2 billion in its most recent quarter.
TTWO has a huge opportunity with GTA 6. The game has garnered unprecedented hype that is starting to grow to a fever pitch. If TTWO delivers a solid sequel, GTA 6 could potentially deliver revenues upwards of ~$20 billion over the next decade, given the revenue trajectory of GTA sequels. At TTWO's current valuation of $23 billion, the company has far more upside, given the potential of GTA 6 and the company's growing pipeline of popular titles.

NVIDIA's Momentum A Breakout Story in Progress1. Trend and Structure
The chart showcases an upward momentum, breaking out of a prior resistance level, indicating bullish pressure. The breakout aligns with the upward-sloping trendline, which serves as a strong support structure.
2.Breakout Confirmation
The price has successfully broken through a resistance level, confirming a bullish breakout. This signals potential continuation toward the marked target zone.
3.Entry Point
The entry appears to have been taken near the breakout point, at approximately $141.60, aligning with the bullish momentum.
4. Target (Take Profit)
The take-profit level is marked at $152.94, representing a reasonable upward move from the breakout point. This target aligns with the continuation of the trend.
5. Stop Loss
The stop-loss level is placed at $133.46, below the recent support and trendline. This level ensures protection in case the breakout fails.
6.Risk-Reward Ratio
The setup demonstrates a healthy risk-to-reward ratio, with potential gains outweighing the risks. This indicates a well-calculated trade.
7. Technical Indicators
The momentum of the candles breaking the resistance shows strong bullish interest. No immediate signs of bearish divergence or reversal are visible in the chart.
The chart reflects a bullish breakout setup in NVIDIA's stock price. With strong momentum and a clear trendline breakout, the trade aligns well with the current upward movement. The target and stop-loss levels are well-placed, adhering to a disciplined trading strategy.

FIVE STAR READY FOR BREAK RANGE BREAKOUT...NSE:FIVESTAR trade at 825 level. After break the 850 level you can watch it as a next resistance at 1000 level.

CROMPTON Daily timeframe analysis for long
NSE:CROMPTON taking bounce back from its 50% golden retrace zone.
Can add more till 380 with SL 360.
Major Targets Highlighted in Blue lines, sub targets in grey lines.

JINDALSTEL Daily timeframe analysis for long
NSE:JINDALSTEL has bounced back from major support zone with narrow inside range breakout.
Can add more till 886 only with SL 870.
Major Targets Highlighted in Blue lines, sub targets in grey lines.

SBI Life Insurance Daily Timeframe Analysis for long
NSE:SBILIFE has bounced back from strong support level of 1375 to 1400 with highest volume over past 6 month.
Can go long above 1440 with SL 1380.
Major Targets Highlighted in Blue lines, sub targets in grey lines.

LICI Daily timeframe analysis for long
NSE:LICI has given strong breakout after bouncing from strong support zone.
Can add more till 925 only with SL 900.
Major Targets Highlighted in Blue lines, sub targets in grey lines.

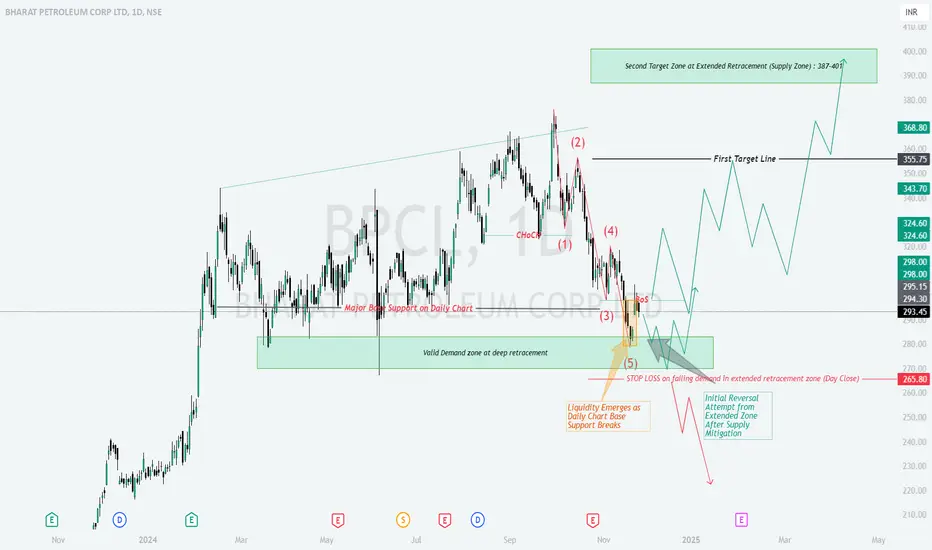
BPCL : Filling Fuel for recoveryBPCL | Based on Demand Zone and Elliott Wave Analysis
Chart Overview
The chart highlights a completed Elliott Wave 5-structure, with price entering a Valid Demand Zone between ₹270-280.
A potential reversal setup is visible, targeting higher levels if price action confirms buyer strength.
Analysis Breakdown
Key Zones to Watch:
Demand Zone (₹270-280):
A deep retracement zone with strong historical buying activity.
Liquidity likely emerges here after breaking the Major Base Support, trapping weak sellers.
First Target Zone (₹343-355):
Initial resistance where sellers may reappear after a reversal.
Second Target Zone (₹387-400):
Extended retracement supply zone where profit-taking is expected.
Elliott Wave Structure:
The current chart shows a 5-wave bearish structure:
Wave (1): Initial impulsive move down.
Wave (2): Weak corrective pullback upward.
Wave (3): Strongest wave breaking major supports.
Wave (4): Minor correction upward.
Wave (5): Final wave driving price into the demand zone.
Wave 5 completion often signals a potential trend reversal, aligning with this setup.
Confirmation Signals:
Price Action: Look for bullish reversal candlestick patterns (e.g., hammer, bullish engulfing) near ₹270-280.
Volume Spike: Increased buying volume in the demand zone indicates institutional interest.
Change of Character (ChoCH): Shift from lower lows/lower highs to higher highs/higher lows.
Trading Plan
Bullish Reversal Trade:
Entry: Near ₹270-280 upon confirmation of bullish price action or volume signals.
Targets:
Target 1: ₹343-355 (initial resistance).
Target 2: ₹387-400 (supply zone).
Stop Loss: Below ₹265 (invalidation of demand zone).
Bearish Breakdown Trade (If Setup Fails):
Logic: A daily close below ₹265 invalidates the demand zone.
Entry: Short position below ₹265 after a confirmed breakdown.
Target: ₹240-250 (next strong support zone).
Stop Loss: Above ₹270-275 (to avoid false breakdowns).
Risk Management
Position Sizing: Limit risk to 1-2% of total capital.
Stop Loss Discipline: Strictly follow stop-loss levels to prevent emotional trading.
Risk-to-Reward Ratio: Aim for at least 1:2 or higher R:R ratio (risk ₹10 to target ₹20+).
Educational Notes
Demand Zone Reversals: Demand zones often lead to significant reversals when combined with liquidity traps and bullish signals.
Wave 5 Completions: Wave 5 typically completes a trend, offering reversal opportunities.
Patience is Key: Wait for confirmation signals to improve trade probability.
Conclusion:
Bullish Plan: Watch for reversals in the ₹270-280 demand zone, targeting ₹343-355 and ₹387-400.
Bearish Plan: Short below ₹265 if the demand zone fails, targeting ₹240-250.
Stick to the plan, follow risk management rules, and allow the market to confirm your bias before executing trades.
Disclaimer:
I am not a SEBI-registered analyst. The above analysis is for educational purposes only. Please conduct your own research or consult with a financial advisor before making trading decisions.
ADVENZYMES: Catching the Wave of OpportunityADVENZYMES (Advanced Enzyme Tech Ltd.)
Key Levels:
Demand Zone: ₹333.85 - ₹384.90
Stop Loss: Below ₹333.85 (on daily closing basis)
Target Zone: ₹523 - ₹543 (Golden Retracement Zone of the correction swing)
Structure & Trend:
The stock is currently in an ABC correction wave with Wave C extended.
A strong demand zone is visible near ₹333.85 - ₹384.90.
Buyers are likely to step in at this zone, creating a potential reversal opportunity.
Trade Plan:
Entry: Around ₹366 - ₹385 within the demand zone.
Targets:
First target: ₹450 (midway to retracement)
Final target: ₹523 - ₹543
Stop Loss: ₹333.85 on a daily close basis.
Note: Sellers might use the ₹523-₹543 zone for profit booking.
General Guidelines:
Risk Management: Adhere to strict stop losses as per the plan.
Confirmation: Look for price action signals (bullish candles, volume spikes) near entry zones.
Patience: Allow the trades to develop towards targets gradually.
Educational Purpose only

HAL : Hindustan Aeronautics Ltd completing its correction#HAL (Hindustan Aeronautics Ltd) Daily Chart Analysis
🔍 Technical Overview:
1️⃣ The stock is forming an ABC corrective wave structure, nearing the Extended Correction Zone of Wave C around ₹3,697 - ₹3,405.
2️⃣ The 200 SMA (₹3,405) aligns with a strong support level, increasing the likelihood of a bounce.
3️⃣ Immediate resistance levels are at ₹4,209 and ₹4,509, with the target zone around ₹5,080 - ₹5,130 if bullish momentum continues.
🟢 Bullish Scenario:
Support Zone: ₹3,697 - ₹3,405.
A reversal here could trigger a rally toward ₹4,209, with an extended target of ₹5,130 - ₹5,165.
Confirmation: Look for bullish reversal patterns (e.g., hammer or bullish engulfing candle) supported by volume.
🎯 Long Plan:
Entry: ₹3,697 - ₹3,405 (upon bullish confirmation).
Targets:
TP1: ₹4,209.
TP2: ₹5,130 - ₹5,165.
Stop-Loss: Below ₹3,380.
🔴 Bearish Scenario:
If ₹3,405 fails to hold, the next downside targets are ₹3,000 and ₹2,600.
Breakdown Confirmation: A decisive break below ₹3,405 with increased selling pressure.
🎯 Short Plan:
Entry: Below ₹3,405.
Targets:
TP1: ₹3,000.
TP2: ₹2,600.
Stop-Loss: Above ₹3,500.
📈 Key Levels to Watch:
Support: ₹3,830, ₹3,697, ₹3,405.
Resistance: ₹4,209, ₹4,509, ₹5,130.
⚠️ Note: Monitor volume and price action carefully around the Extended Correction Zone. Any major defense sector updates or contracts could impact the stock’s movement.
#HindustanAeronautics #HAL #StockMarket #TradingView #ElliottWave #TechnicalAnalysis #SwingTrading #NSE #StockCharts #PriceAction #DefenseStocks #IndiaMarkets #StockTrading #MarketAnalysis
Comment below if you have questions or insights! 🚀

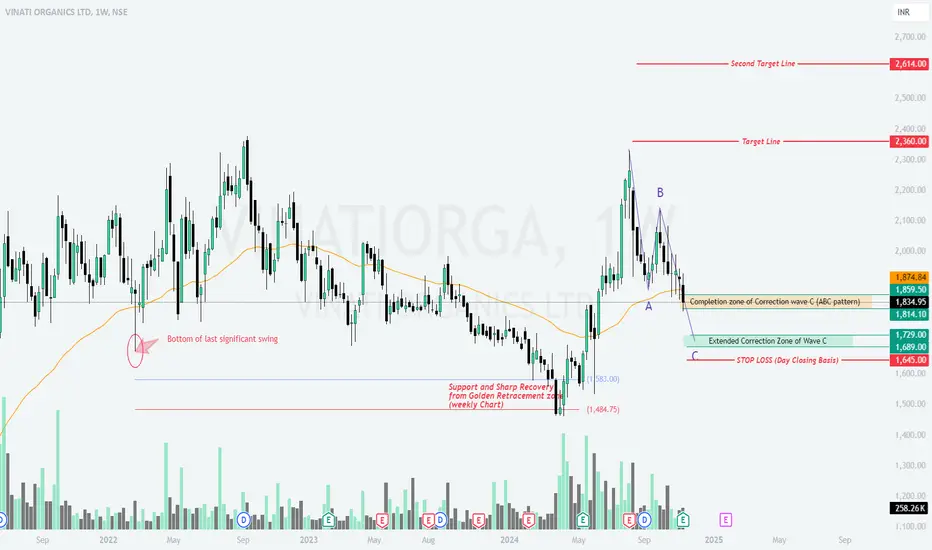
VINATIOR - ABC Correction Near Completion (weekly)Vinati Organics Ltd – Weekly Chart Analysis
1. Current Correction and Support Zone
The price has completed the ABC corrective structure with wave C nearing its completion in the Extended Correction Zone (₹1,729-₹1,689) .
The current price (₹1,834.95) is hovering near the completion zone of wave C , and a sharp recovery is anticipated if support holds.
2. Key Levels and Trading Plan
b Bullish Scenario
Sustained buying from the current levels or the demand zone (₹1,729-₹1,689) could lead to a recovery toward the following target zones:
Target 1: ₹2,360
Target 2: ₹2,614
b Bearish Scenario
A break below ₹1,645 (on a day closing basis) could invalidate the bullish setup, with potential downside to lower levels.
3. Observations and Indicators
Support at Golden Retracement Zone: The stock had shown sharp recoveries in the past from the 61.8% Fibonacci retracement levels, as seen in earlier price movements on the weekly timeframe.
Volume Analysis: A noticeable increase in volume during previous support testing phases indicates buyer interest around key levels.
4. Key Risks
A failure to hold the current correction zone could push the stock toward lower levels. Watch for macroeconomic factors or company-specific news that might impact sentiment.
📈 What’s Your Take on the Setup?
Are we heading toward the targets, or will bears take over? Share your insights in the comments! 🚀📉
BABA | A trillion dollar criticismChinese tech titan Jack Ma had been having it rough ever since his criticism of Beijing triggered a backlash on his companies and wealth but a recent development may change the tide.
On Friday, China's central bank announced a fine of 7.12 billion yuan, or $985 million, for Ant Group the fintech giant co-founded by Ma that operates the Alipay payments app signaling that its years-long regulatory crackdown is ending.
But the years-long crackdown has taken a heavy toll on Ma's wealth and the market valuations of the companies he holds stakes in. Alibaba the flagship company he cofounded saw a 45%, or $620 billion, drop in market value since shares hit their peak in 2020, per Bloomberg's calculations on Sunday.
Ant Group is now valued at around $78.5 billion marking a steep 75% discount to its valuation of $315 billion in a scuttled IPO before Beijing's regulatory crackdown in 2020.
The collective $850 billion wipe out in Alibaba and Ant's valuations has sent Ma's net worth plunging from about $61 billion in October 2020 to $34.1 billion as of Monday
On a personal level, Ma has also been lying low for more than two years.Ma angered Chinese authorities after giving a speech in October 2020 in which he criticized China's financial regulatory system and claimed Chinese banks were operating with a "pawnshop" mentality. His words prompted intense regulatory scrutiny of his businesses including Alibaba and Ant and a wider crackdown on tech firms in China.
In January, he was spotted in Bangkok, where he visited a Michelin-starred street-food restaurant and watched a Muay Thai fight. He also popped up in Hong Kong in the same month.
In March, Ma returned to a school he founded in his hometown of Hangzhou in eastern China.
In April, he was appointed an honorary professor at the University of Hong Kong. In May, Ma took up a teaching position in Japan, one of the first public roles he has assumed since disappearing from the spotlight in 2020.
Last month, Ma attended the Alibaba Global Mathematics Competition finals in Hangzhou, where Alibaba is based.
Alibaba shares in Hong Kong were up 3% at 86.90 Hong Kong dollars apiece at midday, buoyed by news of the fine. The company's shares in New York closed 8.1% higher at $90.55 apiece on Friday.

HEG - Confirming steel sector bull run?NSE:HEG
The stock has strong 💪 price action
Company announced investment
Disc: no holding as yet, might add without an update

OBEROIRLTY Daily Timeframe Analysis for Long term investment
NSE:OBEROIRLTY has give strong breakout of highly consolidated price zone of 1800.
Can add more till 1767 only and SL of 1745.
Major targets are highlighted in Blue lines.

ACLGATI Monthly timeframe analysis for long term
NSE:ACLGATI is consolidating in range above its listing price.
Above 118 it can give good move with SL of 95
Major targets are highlighted in Blue.

India Cement Daily Timeframe analysis for Long Term
NSE:INDIACEM Strong rally in monthly timeframe as well as it is consolidating too much in daily timeframe.
Can go long above 376 with SL of 364.
Targets highlighted in Blue.
Already published idea is in link.

SBI Cards Long Term Analysis
NSE:SBICARD strong breakout in monthly and weekly timeframe.
Add more at 765 to till 720, SL 692.
Targets highlighted in blue lines.

Torrent Power Daily timeframe analysis for Long Term
NSE:TORNTPOWER has taken strong breakout of major resistance and pullback.
Pullback Leg has taken strong bounce along with trendline breakout.
SL 1703 Targets highlighted in Blue.

Mahindra & Mahindra updateAs expected maket reached at extreme ob and moved 107 points 4% up trend hope in future we can expect a more on this investment 😉
Happy trading 🥰
