Bearish Setup on NFLX: Correction Wave (C) UnfoldingTF: 4h
NFLX appears bearish at the moment. The corrective structure on the 4-hour timeframe suggests a potential decline. The current formation indicates that wave B likely completed at 998.61 , and the stock has now begun its descent into wave (C) of the correction.
The correction may extend to the 100% projection of wave A at 788.67 , or potentially deepen to 659.06 , aligning with the 1.618 Fibonacci extension of wave A. After the completion of wave (C), traders can buy for the target up to wave B at 998.61 .
I will continue to update the situation as it evolves.
Stocktrading

CAN INTEL JOIN THE TRILLION DOLLAR COMPANY CLUB? last couple years business was bad for intel and hammoraging money.
but if 18A and 14A succeeds , their foundry will provide lot of income.
i think in the long term intel also can be a trillon dollar worth company.

NVDA’s Final Act: A Breakout Waiting to HappenNVDA appears to be nearing the completion of its corrective phase, setting the stage for a potential move to new highs. The current pattern resembles a falling wedge, indicative of an ending diagonal formation, which often signals a reversal and the start of an upward trend.
The structure of the corrective channel, along with the termination of the diagonal pattern, suggests a high likelihood of a running flat formation. Buyers are likely to intensify demand pressure as the price approaches the lower boundary of the trendline. A trend reversal may occur if there is a decisive breakout above the Wave 4 level of the ending diagonal.
Buying opportunity with minimal stop is possible after the reversal from lower side of the channel. Targets can be 112 - 120 - 132 - 140.
I'll be sharing more details shortly.

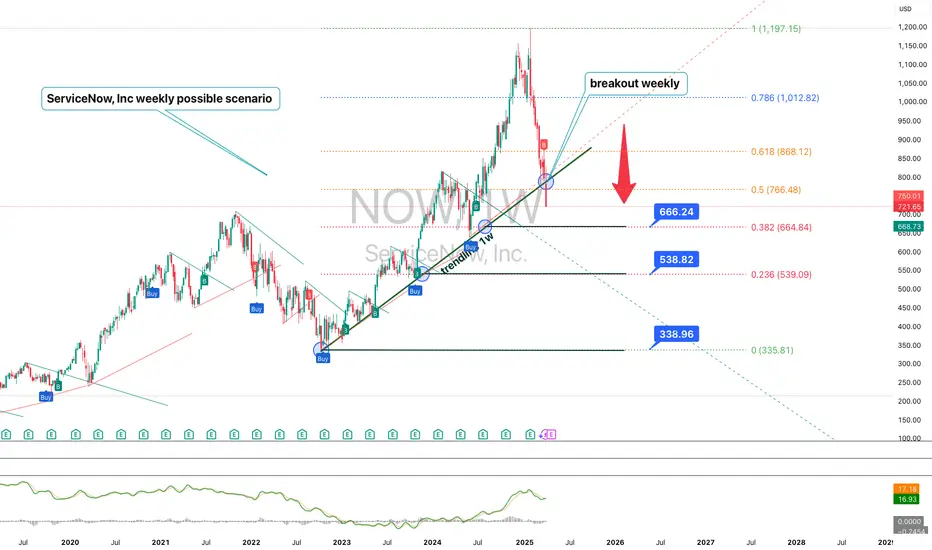
ServiceNow (NOW) – Technical and Fundamental Analysis 1WServiceNow shares have broken below a key ascending trendline on the weekly chart, strengthening the bearish outlook. The price is approaching the 666, 538, and 338 support zones, which may act as potential reversal areas. The RSI continues to decline, indicating weakening bullish momentum, while the MACD confirms a bearish crossover. EMA 50/200 suggest a rising risk of further downside.
Fundamentally, ServiceNow remains a leader in cloud-based solutions and business process automation. However, it faces pressure from rising interest rates and a possible slowdown in corporate IT spending. Valuation remains elevated, making the stock vulnerable to broader market shifts and macroeconomic headwinds. Upcoming earnings reports will be critical in determining the next move.
The main scenario suggests a drop toward 666 and 538, with a potential extension to 338. An alternative scenario would be a recovery above 766, opening the way toward 868 and 1012. A confirmed close below 666 will reinforce the bearish trend.
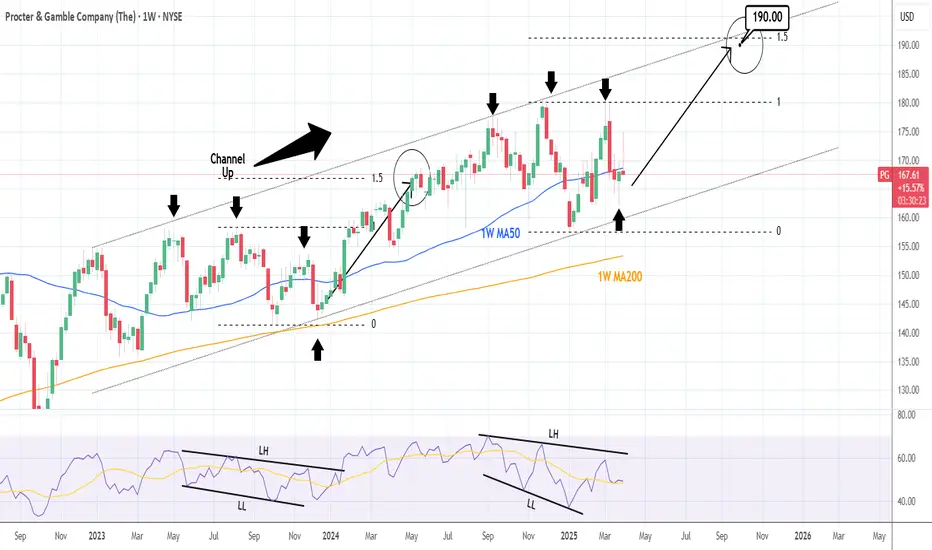
PROCTER & GAMBLE: This volatility implies a major market bottom.Procter & Gamble is neutral on both the 1D (RSI = 47.822, MACD = 0.180, ADX = 17.832) and 1W (RSI = 49.820, MACD = 0.340, ADX = 20.781) technical outlooks as despite last week's rebound and this ones early strong rise, it pulled back and is about to close the 1W candle flat. We are exactly on the 1W MA50, which inside the 2 year Channel Up has always been a fair level to go long. The 1W RSI indicates that last week's low may be the symmetric low to December 11th 2023. This kickstarted a rally that hit the 1.5 Fibonacci extension. Consequently we are bullish long term, aiming at just under the new 1.5 Fib (TP = 190.00).
## If you like our free content follow our profile to get more daily ideas. ##
## Comments and likes are greatly appreciated. ##
Apple (AAPL) Shares Plummet Over 9% Following Trump's TariffApple (AAPL) Shares Plummet Over 9% Following Trump's Tariff Announcement
Many stock indices declined after the US President announced the introduction of tariffs for multiple countries, as we reported yesterday morning. During yesterday’s trading session, the sell-off in equities intensified.
According to media reports, market participants had hoped that the tariff threats were mere rhetoric and a negotiation tactic. However, many were shocked by both the number of countries affected and the scale of the imposed tariffs. Several well-known technology companies led the market downturn.
How Do Trump's Tariffs Impact Big Tech Companies?
Significant tariffs were imposed on Chinese imports, yet Apple manufactures around 90% of its iPhones in China. Many affordable products sold on Amazon are also set to become more expensive, as they are sourced from China.
Meta Platforms' advertising business could suffer considerable losses as companies worldwide cut advertising budgets. Nvidia and Broadcom may also struggle, given that the tariffs apply to many electronic devices incorporating their chips.
As a result, shares of Apple (AAPL), Amazon (AMZN), Meta Platforms (META), Broadcom (AVGO), and Nvidia (NVDA) fell by approximately 9% by the close of trading yesterday.
Microsoft (MSFT) shares, however, proved more resilient, dropping just 2.3%, as software products are not easily subject to tariffs. Moreover, software developers do not rely on international supply chains.
Technical Analysis of AAPL Chart
Apple’s stock price fluctuations have formed a trend channel (shown in blue), with:
→ The upper boundary acting as resistance since last autumn, although bulls managed to push the price above it during the Christmas rally. We previously highlighted Apple’s overbought condition and the possibility of a correction on 27 December 2024.
→ New data indicates that resistance has now shifted to the median at around $225.
This puts the lower boundary of the trend channel at risk of a bearish breakout. In the coming days, AAPL’s chart may see a bearish assault on the psychological $200 level, which proved significant in August 2024.
This article represents the opinion of the Companies operating under the FXOpen brand only. It is not to be construed as an offer, solicitation, or recommendation with respect to products and services provided by the Companies operating under the FXOpen brand, nor is it to be considered financial advice.

IAG Additional Price Levels • LSE • Airlines Group Stock • FTSE⚠️ IAG Going to plan, looks like it's a TRUMP DUMP 🤣
Now is the TIME TO HUNT the stocks for your PORTFOLIO.
ℹ️ When TRUMP causes a DUMP I accumulate SIT BACK and just WAIT fornthe PUMP...🚀
These additional price levels will be used as an additional filter to TIME an ENTRY ONLY IF the BIDS come in 🟢SeekingPips🟢 NEEDS to see some VOLUME🚀🚀🚀

Apple - All This Was Expected!Apple ( NASDAQ:AAPL ) perfectly plays out:
Click chart above to see the detailed analysis👆🏻
Just a couple of months ago, Apple perfectly retested the rising channel resistance trendline and has been creating the expected bearish rejection. This could perfectly form the next all time high break and retest, which would eventually lead to another significant move higher.
Levels to watch: $190
Keep your long term vision,
Philip (BasicTrading)

COSTCO: Massive rebound on the 1W MA50 can go for +45% profit.Costco has just turned bullish on its 1D technical outlook (RSI = 56.966, MACD = -6.590, ADX = 35.211) as it's on the 3rd straight green week ever since it touched and held the 1W MA50. This rebound, though not an absolute bottom on the 2 year Channel Up, is the new technical bullish wave of the pattern. We've had so far 2 main +45.14% price surges in the past two years. We estimate that to be the 3rd and last up until the end of the year. Go long, TP = 1,270.
See how our prior idea has worked out:
## If you like our free content follow our profile to get more daily ideas. ##
## Comments and likes are greatly appreciated. ##

The Trade War Strikes Back: Market Reeling from Trump’s Tariff MThe markets are not taking Trump’s new round of tariffs lightly.
As the S&P 500 dips sharply, investors are reacting to the growing tension between the U.S. and China over trade policy. The new tariffs have ignited fears of a prolonged trade war, sending shockwaves through tech-heavy sectors and dragging major names like NASDAQ:NVDA , NASDAQ:MSFT , NASDAQ:AAPL , and NASDAQ:AMZN deep into the red.
📉 What we're seeing:
SP500 is breaking recent support with heavy volume.
Tech sector is leading the sell-off, especially chipmakers and global exporters.
Uncertainty is pushing investors toward safety, further increasing volatility.
🧠 Key takeaway: This is more than a dip—it’s policy risk priced in real time. Until there's clarity, traders should prepare for more erratic moves. Short-term sentiment has clearly flipped bearish.
💬 Are you buying the fear or staying out of the storm?

Nano Nuclear Energy – Pioneering Next-Gen Small Modular ReactorsCompany Overview:
Nano Nuclear Energy NASDAQ:NNE is revolutionizing clean, compact nuclear power with small modular reactors (SMRs), addressing data centers, remote sites, and disaster relief energy needs.
Key Catalysts:
ZEUS Microreactor Development 🚀
Successfully assembled first hardware, marking a key milestone toward commercialization & revenue generation.
Patent-Backed Innovation 🏆
Filed four new patents in February 2025 for its Annular Linear Induction Pump (ALIP).
Strengthens NNE’s edge in molten-salt & liquid-metal reactor technology.
Surging Global Electricity Demand ⚡
Aligns with the growing need for cost-effective, sustainable energy solutions.
Ideal for off-grid, military, and high-demand industrial applications.
Investment Outlook:
✅ Bullish Above: $21.50-$22.00
🚀 Upside Target: $44.00-$47.00
📈 Growth Drivers: Breakthrough SMR tech, patent leadership, and clean energy demand.
🔥 Nano Nuclear – Powering the Future, One Microreactor at a Time. #NNE #NuclearEnergy #CleanTech

MASTERCARD: One more dip possible but long term target is $620.Mastercard is neutral on its 1D technical outlook (RSI = 52.317, MACD = -0.060, ADX = 29.709) having just recovered its 1D MA50 following the March 13th rebound. The pattern here is a Channel Up and March's bearish wave already hit the 0.382 Fibonacci retracement level much like the previous one did on May 1st 2024. That however went on to extend the decline to close to the 0.5 Fibonacci level and hit the 1D MA200. Consequently there is a chance of one more month of slow decline to the 1D MA200 but overall, this is a good enough level to buy again for the long term and aim for the -0.382 Fib extension (TP = 620.00).
## If you like our free content follow our profile to get more daily ideas. ##
## Comments and likes are greatly appreciated. ##

IAG Airlines Group what next? $261 Reached & Breached! $172?🤔 IAG Airlines Group what next?
ℹ️ $261 Reached & Breached!
Will the $261 be regained and start to offer some support or is $172 NEXT?❓️❔️❓️
🌍 To be completely transparent I have no horse in this race at the moment BUT I really would like a serious flush to try and accumulate a long-term POSITION.
🟢SeekingPips🟢 is not interested at current price at all unless we start to see some SERIOUS VOLUME START TO COME IN TO PLAY

Microsoft - A Little Lower And Much Higher!Microsoft ( NASDAQ:MSFT ) is about to retest strong support:
Click chart above to see the detailed analysis👆🏻
In mid 2024 Microsoft perfectly retested the previous channel resistance trendline and the recent weakness has not been unexpected at all. However the overall trend still remains rather bullish and if Microsoft retests the previous all time high, a significant move will most likely follow.
Levels to watch: $350
Keep your long term vision!
Philip (BasicTrading)

EXXON MOBIL: This strong rally won't end any time soon.Exxon Mobil is about to turn overbought on its 1D technical outlook (RSI = 67.390, MACD = 2.260, ADX = 52.087) as for the 4th straigh week it is posting gains. This rally started on the first week of March when the stock almost touched the bottom of the 2 year Channel Up. This is a similar bullish wave to the one that started after the January 2024 bottom, which eventually reached the 1.236 Fibonacci extension. Aim for a bit under the top of the Channel Up (TP = 128.00.
See how our prior idea has worked out:
## If you like our free content follow our profile to get more daily ideas. ##
## Comments and likes are greatly appreciated. ##

Moderna (MRNA) Shares Plunge Nearly 9%Moderna (MRNA) Shares Plunge Nearly 9%
Moderna (MRNA) shares tumbled by approximately 8.9%, falling below $29—marking their lowest level since April 2020, when global markets were shaken by the COVID-19 pandemic.
Since the start of 2025, MRNA’s share price has declined by around 32%.
Why Did MRNA Shares Drop?
On Monday, MRNA led the decline among US biotech stocks following the resignation of Peter Marks, director of the FDA’s Center for Biologics Evaluation and Research. Marks had held this position for over a decade.
During Trump’s first term, Marks oversaw the rollout of COVID-19 vaccines and established guidelines for emerging treatments such as cell and gene therapy.
However, in Trump’s second term, Robert F. Kennedy Jr. now serves as Health Secretary. According to The Wall Street Journal, Marks criticised Kennedy’s stance on vaccines in his resignation letter, calling it “misinformation and lies.”
The pharmaceutical industry was already under pressure amid speculation that Trump’s tariff plans could extend to prescription drugs, which are typically exempt from such measures. Marks' departure has further intensified uncertainty regarding regulatory decisions under the new administration.
Technical Analysis of MRNA Shares
The chart indicates that:
➝ The stock remains in a downtrend that began with a sharp drop in August last year (reinforced by the moving average).
➝ Over the past five months, it has been forming a descending channel (marked in red).
➝ The lower boundary of this channel acted as support yesterday.
The formation of higher lows and highs (marked in blue) had given bulls some hope in March 2025. However, yesterday’s bearish gap appears to have shattered that optimism.
It is possible that the lower blue trendline and the median of the red channel will act as resistance moving forward, further darkening the outlook for MRNA’s share price—especially given the ongoing negative news surrounding the stock.
This article represents the opinion of the Companies operating under the FXOpen brand only. It is not to be construed as an offer, solicitation, or recommendation with respect to products and services provided by the Companies operating under the FXOpen brand, nor is it to be considered financial advice.

VISA: One of the steadiest 2025 stock picks.Visa remains bullish on 1W and is about to do so on its 1D technical outlook as well (RSI = 54.200, MACD = 1.140, ADX = 29.207). The 1W Channel Up is what keeps the long term trend bullish and 1D is just recovering from neutral grounds the correction of March's first 2 weeks. This is nothing new for the stock as it had the same -9% correction in September 2023 after a symmetric +43.28% bullish wave. After this correction, the index extended the rally to the 1.382 Fibonacci extension before the stronger correction.
You can see that the 1W RSI pattern now is identical to then. Consequently, we again expect a technical rebound to the 1.382 Fib extension either at or over the 2 year Channel Up (TP = 419.00) by the end of the year.
See how our prior idea has worked out:
## If you like our free content follow our profile to get more daily ideas. ##
## Comments and likes are greatly appreciated. ##

Smart Money Technique (SMT) Divergences - The Ultimate GuideIntroduction
SMT Divergences are a powerful concept used by professional traders to spot inefficiencies in the market. By comparing correlated assets, traders can identify hidden opportunities where one market shows strength while the other shows weakness. This guide will break down the major SMT divergences: EURUSD/GBPUSD, US100/US500, and XAUUSD/XAGUSD .
---
What is SMT Divergence?
SMT Divergence occurs when two correlated assets do not move in sync, signaling potential liquidity grabs or market inefficiencies. These divergences can be used to confirm trend reversals, identify smart money movements, and improve trade precision.
Key Concepts:
- If one asset makes a higher high while the correlated asset fails to do so, this suggests potential weakness in the pair making the higher high.
- If one asset makes a lower low while the correlated asset does not, this suggests potential strength in the pair that did not make a lower low.
- Smart Money often exploits these inefficiencies to engineer liquidity hunts before moving price in the intended direction.
---
EURUSD vs. GBPUSD SMT Divergence
These two forex pairs are highly correlated because both share the USD as the quote currency. However, when divergence occurs, it often signals liquidity manipulations.
How to Use:
- If GBPUSD makes a higher high but EURUSD does not, GBPUSD may be trapping breakout traders before reversing.
- If EURUSD makes a lower low but GBPUSD does not, EURUSD might be in a liquidity grab, signaling a potential reversal.
---
US100 vs. US500 SMT Divergence
The NASDAQ (US100) and S&P 500 (US500) are both major indices with a strong correlation, but tech-heavy NASDAQ can sometimes lead or lag the S&P.
How to Use:
- If US100 makes a higher high but US500 does not, it suggests US100 is extended and may reverse soon.
- If US500 makes a lower low but US100 does not, US500 might be experiencing a liquidity grab before a reversal.
---
XAUUSD vs. XAGUSD SMT Divergence
Gold (XAUUSD) and Silver (XAGUSD) have a historic correlation. However, due to differences in volatility and liquidity, they can diverge, presenting trading opportunities.
How to Use:
- If Gold makes a higher high but Silver does not, Gold might be overextended and ready to reverse.
- If Silver makes a lower low but Gold does not, Silver might be in a liquidity grab, signaling strength.
---
Indicator Used for SMT Divergences
To simplify the process of identifying SMT divergences, this guide utilizes the TradingView indicator TehThomas ICT SMT Divergences . This tool automatically detects divergences between correlated assets, highlighting potential trade opportunities.
You can access the indicator here:
Why Use This Indicator?
- Automatically plots divergences, saving time on manual comparisons.
- Works across multiple asset classes (Forex, Indices, Metals, etc.).
- Helps traders spot Smart Money inefficiencies with ease.
---
Final Tips for Trading SMT Divergences
1. Use Higher Timeframes for Confirmation: SMT Divergences on 1H or 4H hold more weight than those on lower timeframes.
2. Combine with Other Confluences: ICT concepts like Order Blocks, FVGs, or liquidity sweeps can strengthen the SMT setup.
3. Wait for Market Structure Confirmation: After spotting SMT divergence, look for a market structure shift before entering trades.
4. Be Mindful of Economic Events: Divergences can appear due to news releases, so always check the economic calendar.
---
Conclusion
SMT Divergences are a valuable tool for traders looking to gain an edge in the markets. By analyzing inefficiencies between correlated assets, traders can anticipate smart money movements and improve trade precision. Practice spotting these divergences on real charts, and soon, you'll develop a keen eye for hidden liquidity traps.
Happy trading!

Alphabet (GOOGL) Stock Hits 2025 LowAlphabet (GOOGL) Stock Hits 2025 Low
As seen on the Alphabet (GOOGL) stock chart, the price has dropped close to $156—a level not seen since September 2024.
Since the start of 2025, the stock has fallen by more than 18%.
Why Is GOOGL Falling?
As mentioned earlier today, overall market sentiment remains bearish due to the White House’s tariff policies.
For Alphabet (GOOGL), the situation has worsened today due to the following developments (as reported by the media):
➝ Google has admitted liability and agreed to pay $100 million in cash to settle a US class-action lawsuit accusing the company of overcharging advertisers, according to Reuters. Alphabet shares dropped 4.4%.
➝ Google’s division was found guilty of anti-competitive behaviour in India related to its app store billing system.
Technical Analysis of Alphabet (GOOGL)
In February, we noted investors’ negative reaction to the company’s earnings report, which led to a bearish gap (marked by a red arrow).
Since then, bears have maintained control, pushing the price below the lower boundary of the ascending channel that had been valid since 2023. Key signals include:
➝ The $170 level (near the bearish gap on 10 March) acted as resistance on 25 March.
➝ Bears showed little reaction to bulls at the $160 level and have kept the price contained between two downward-sloping red lines.
Bears may now be targeting the psychological level of $150. If bulls want to maintain control over GOOGL’s long-term uptrend, they need to take action soon.
This article represents the opinion of the Companies operating under the FXOpen brand only. It is not to be construed as an offer, solicitation, or recommendation with respect to products and services provided by the Companies operating under the FXOpen brand, nor is it to be considered financial advice.

TSLA Volatility Continues?NASDAQ:TSLA
Outlook - -GEX and -DEX with put support at 220 which would fill the Earnings gap up from last October.
Weekly -- Rejected the EMA
Daily -- Closed right above EMA
Hourly -- Consolidating
10m -- Consolidating
Bias - Neutral until one side breaks. Too much volatility to pick a side.
Pivot - 263.5
Upside Targets:
* 263.46--274.06--277.63--287.26
Downside Targets:
* 258.04--256.43--253.48--249.63

IAG Stock Took some heat! Is there anything to take here?🟢SeekingPips🟢 has this on the radar.
⭐️ Have your levels ready and wait for your A+⭐️ Setup.
ℹ️ Our levels are here marked out.
I have ZERO interest in taking a position here however a deeper sell-off and I will start paying attention.❗️
⚠️ ALERTS set and LEVELS marked.
🟢Now go away and ENJOY your WEEKEND and lets HURRY UP AND WAIT and lets see what NEXT WEEK has for us👍

Tesla - There Is Hope For Bulls!Tesla ( NASDAQ:TSLA ) is just crashing recently:
Click chart above to see the detailed analysis👆🏻
After Tesla perfectly retested the previous all time high just a couple of weeks ago, we now witnessed a quite expected rejection of about -50%. However market structure remains still bullish and if we see some bullish confirmation, a substantial move higher will follow soon.
Levels to watch: $260, $400
Keep your long term vision!
Philip (BasicTrading)

Comstock Resources (CRK) – Expanding U.S. Natural Gas DominanceCompany Overview:
Comstock Resources NYSE:CRK is accelerating natural gas production, reinforcing its position in the Western Haynesville play, a key U.S. gas region.
Key Catalysts:
Production Expansion & Strategic Acquisitions ⛽
Increasing drilling rigs from 5 to 7 for higher output.
Acquired 64,000 net acres in Haynesville, boosting reserves & market share.
Investment in Drilling & Midstream Infrastructure 🏗️
$1.0-$1.1 billion planned for 46 horizontal wells in 2025.
$130-$150 million allocated to midstream development, optimizing gas transport & profitability.
Market Strength & Growth Outlook 📈
Positioned to capitalize on rising U.S. natural gas demand & global LNG expansion.
Investment Outlook:
Bullish Case: We are bullish on CRK above $15.50-$16.00, supported by production growth & infrastructure investment.
Upside Potential: Our price target is $30.00-$31.00, driven by expansion, operational efficiency, and market strength.
🔥 CRK – Fueling the Future of U.S. Natural Gas. #CRK #NaturalGas #EnergyStocks
