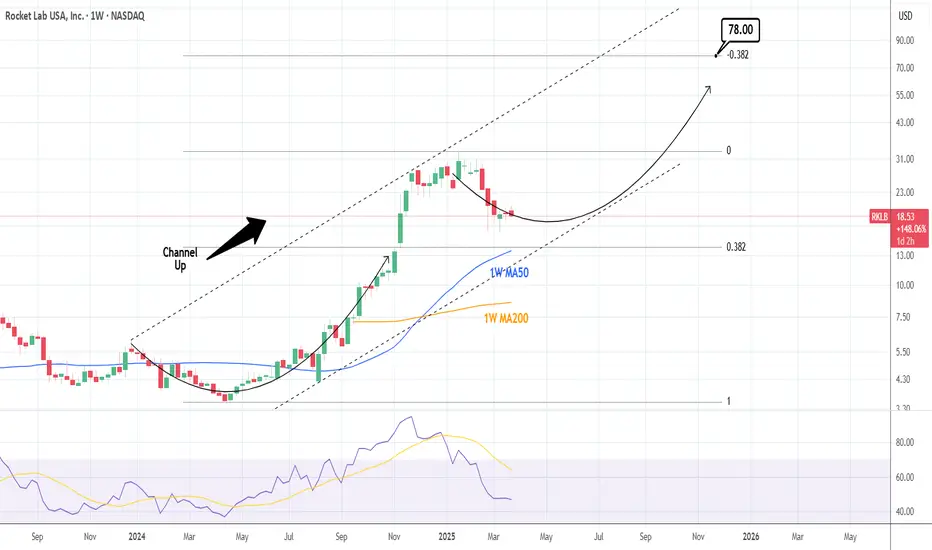
ROCKET LAB: Channel Up aiming at $78.RKLB turned marginally neutral again on its 1W technical outlook (RSI = 47.190, MACD = 1.683, ADX = 38.570) as it basically remains flat for the past 3 weeks. Since the price is not that far off the 1W MA50, we believe that's the (long term) bottoming process of the 1 year Channel Up. We are also a little bit over the 0.382 Fibonacci retracement level and once the process is over we expect the new bullish wave to target the -0.382 Fib extension (TP = 78.00) as the top of this Cycle.
See how our prior idea has worked out:
## If you like our free content follow our profile to get more daily ideas. ##
## Comments and likes are greatly appreciated. ##
Stocktrading
JP MORGAN: Perfect 1W MA50 rebound targeting $350. JP Morgan is neutral both on its 1D and 1W technical outlooks (RSI = 54.173, MACD = 7.520, ADX = 32.502), suggesting that it remains inside the best buy zone for the long term. As a matter of fact, having rebounded exactly on its 1W MA50, this is the best buy opportunity since October 23rd 2023, which was the last time it hit the 1W MA50. As shown, the long term pattern is a Channel Up and every contact with the 1W MA50 has coincided with a 1W RSI test of the S1 Zone. There is no better buy entry than the current level and we can safely aim for yet another +57.76% run (TP = $350.00).
## If you like our free content follow our profile to get more daily ideas. ##
## Comments and likes are greatly appreciated. ##

Beginning of the Uptrend for Stock #01Beginning of the Uptrend for Stock #01: 9988 (BABA)
The price has broken out of a consolidation range that lasted approximately two years, supported by a normal volume distribution.
The stock has risen to meet the Fibonacci Extension resistance level of 161.8 at a price of 144 HKD. Currently, it is forming a sideways consolidation pattern on the smaller timeframe, establishing a base structure viewed as re-accumulation.
The 6-month target is set at the Fibonacci Extension level of 261.8, which corresponds to a price of 189 HKD. This target aligns with a price cluster based on the valuation from sensitivity analysis, using the forward EPS estimates for 2025-2026 as a key variable for calculations, along with the standard deviation of the price-to-earnings ratio.
Wait for the Right Moment to Accumulate Shares within the Consolidation Range
Purchase near the support level of the range when the price pulls back. Look for a candlestick reversal pattern as a signal to add to your position.
However, should the price break down to the lower consolidation range, the stock would lose its upward momentum, potentially leading to a prolonged period of consolidation or a deeper pullback to around 90 HKD.
Always have a plan and prioritize risk management.

GOOGL: Bullish Bounce Before a Bigger Drop? Here's My RoadmapGoogle NASDAQ:GOOG NASDAQ:GOOGL is shaping up to look bullish in the short term, and I believe that in the next few weeks to months, we could see a solid upside move - before things could turn ugly again later on. Let me explain why.
Big picture: we’re currently in a Wave (2) corrective structure, which is playing out as a complex WXY correction (marked in orange). This type of correction follows a 3-3-3 wave pattern, and everything we’ve seen so far fits that structure. Since the top in February, NASDAQ:GOOGL has dropped around 24% , which is significant - but also not unexpected within this context.
What’s interesting now is that we’ve just printed a bullish divergence on the RSI for the first time in this move down. That’s the first green flag. The second? The lower wick, which I currently mark as sub-wave ((a)) has been very well respected so far. That’s the second sign that this could be the turning point - at least temporarily.
I’m expecting a move up in the coming weeks toward the 2024 VAH, around $178, where we could see a first rejection. From there, the price should continue higher in a 3-wave structure toward Wave ((b)), likely reaching between $187.80 and $196.30 (the 61.8% to 78.6% retracement zone).
But let’s be clear: this is not the start of a new bullish trend. After Wave ((b)), I expect a 5-wave move to the downside, completing Wave ((c)) - and that means lower prices ahead , potentially in Q3, Q4 2025 or even into 2026.
Until then, I’m keeping a close eye on this structure. As long as the current Wave ((a)) low holds, this short-term bullish scenario remains valid. If we get a strong breakout in the coming days / weeks, I’ll be looking to enter on a retest, targeting that $187.80–$196.28 zone.
Let’s see if the market plays it my way.
Make sure to follow me for future updates on this scenario and other setups !

TTD LONG SET UP (The Trade Desk)Entry 1 $55.50
Entry 2 $45.50
Stop loss $35.50
Take profit 1- $65.50
(Close 25%)
Take profit 2- $75.50
(Close 50%)
Take profit 3-$90.50
(Close 75%)
Take profit 4-$110.50
(Close 100%)

RITES: INVERSE H&S BREAKOUTThe Inverse Head and Shoulders pattern is a bullish reversal chart pattern that signals a potential trend reversal from bearish to bullish. It consists of three key components:
Structure of the Pattern:
Left Shoulder: A price decline followed by a temporary rally.
Head: A deeper decline forming the lowest point, followed by another rally.
Right Shoulder: A decline similar in size to the left shoulder but not as deep as the head, followed by a move higher.
Neckline: A resistance level that connects the highs of the two rallies after the left shoulder and head.
The Inverse Head and Shoulders pattern in RITES, with a neckline at ₹225, indicates a potential bullish reversal. The stock has formed a well-defined left shoulder, head, and right shoulder, suggesting that selling pressure is weakening. The target price for this breakout is ₹263 calculated by measuring the distance from the head’s low to the neckline and projecting it upwards. If the stock sustains above the neckline, it could gain further momentum. However, traders should consider placing a stop-loss at 212 to manage risk in case of a failed breakout.

Why I think JP Morgan Predicts a $120 price for Tesla1) The price channel (white) reveals that we’re only halfway to the next major bounce on the daily chart. With boycotts gaining traction and sales projections looking bleak, the stage is set for more downward pressure.
2) Looking back at the last significant downward swing ( purple ) within this channel, history could repeat itself with a drop of similar magnitude. The pattern is hard to ignore.
3) A critical support zone ( green ) lies beneath an unresolved price imbalance, still waiting to be tested. It’s like a magnet pulling the price lower.
4) When you weave these factors together—channel dynamics, past swings, and untouched support—they converge ominously around the $120 mark. Coincidence? I think not...
Let me know what you guys think.

SMCI: Channel Up bottomed on the 1D MA50. Long term Target: $148Super Micro Computer Inc is neutral on its 1D technical outlook (RSI = 52.184, MACD = 0.800, ADX = 28.146), the ideal condition to go on a long term buy as the price has been holding the 1D MA50 for 2 straight weeks. The goal now is to cross again above the 1D MA200 but that was already done on February 18th and the pattern that has been established is a Channel Up. The market however may be aiming at much higher as the November 14th 2024 bottom was priced on the Head of an Inverted Head and Shoulders pattern, a technical bullish reversal formation that targets its 2.0 Fibonacci extension once completed. The trade is long, TP = 148.00.
## If you like our free content follow our profile to get more daily ideas. ##
## Comments and likes are greatly appreciated. ##

NikePoor results mean Nike has broken out of a triangle pattern which started forming in March 2022.
Clean break down with large sell side volume.

ELI LILLY: The time to buy and target 1,300 is now.Eli Lilly is neutral on its 1D technical outlook (RSI = 48.409, MACD = -5.160, ADX = 28.927) and this is technically the most efficient level to buy for the long term towards the end of the year, as the price is sitting around its 1W MA50. The macro pattern is a Channel Up starting back in March 2019 and every time this broke under the 1W MA50 (but remained supported above the 1W MA100) and consolidated, it was the most efficient long term buy signal. In 6 years this has only happened 4 times and all those times the 1W RSI hit the 38.750 S1 level. The immediate target of all bullish waves that started after such bottoms, has been the 2.0 Fibonacci extension. Go long, TP = 1,300.
## If you like our free content follow our profile to get more daily ideas. ##
## Comments and likes are greatly appreciated. ##

Alibaba (BABA) Share Price Declines from 40-Month HighAlibaba (BABA) Share Price Declines from 40-Month High
As shown in the Alibaba (BABA) share chart, the price reached a 40-month high this week, surpassing $145 per share.
Bullish sentiment is being fuelled by news related to AI prospects in China. According to media reports:
→ China’s AI spending is increasing through investments from state-owned enterprises, private companies, and local authorities, aiming to keep pace with the US $500 billion Star Gate project.
→ Alibaba plans to invest $52 billion over three years in artificial intelligence and cloud computing.
Technical Analysis of Alibaba (BABA) Shares
Despite a positive fundamental backdrop, the chart signals potential concerns:
→ The price is near the upper boundary of the ascending channel, which could act as resistance.
→ Bulls attempted to break the $145 level (which has acted as resistance since late February) on 17 March but failed, as the price could not hold above this mark.
→ Using your preferred oscillator, you are likely to observe a bearish divergence between peaks A and B.
This suggests that bullish momentum may be weakening, and investors could consider taking profits after Alibaba’s exceptionally strong price rally—up approximately 70% since early 2025. If so, a break below the orange trendline could lead to a correction towards the median of the blue channel.
This article represents the opinion of the Companies operating under the FXOpen brand only. It is not to be construed as an offer, solicitation, or recommendation with respect to products and services provided by the Companies operating under the FXOpen brand, nor is it to be considered financial advice.

BHARAT FORGE: INVERSE H&SThe Inverse Head and Shoulders pattern is a bullish reversal chart pattern that signals a potential trend reversal from bearish to bullish. It consists of three key components:
Structure of the Pattern:
Left Shoulder: A price decline followed by a temporary rally.
Head: A deeper decline forming the lowest point, followed by another rally.
Right Shoulder: A decline similar in size to the left shoulder but not as deep as the head, followed by a move higher.
Neckline: A resistance level that connects the highs of the two rallies after the left shoulder and head.
The Inverse Head and Shoulders pattern in Bharat Forge, with a neckline at ₹1100, indicates a potential bullish reversal. The stock has formed a well-defined left shoulder, head, and right shoulder, suggesting that selling pressure is weakening. A breakout above ₹1100, supported by strong volume, could confirm the pattern and trigger an upward move. The target price for this breakout is ₹1200, calculated by measuring the distance from the head’s low to the neckline and projecting it upwards. If the stock sustains above the neckline, it could gain further momentum. However, traders should consider placing a stop-loss below the right shoulder to manage risk in case of a failed breakout.

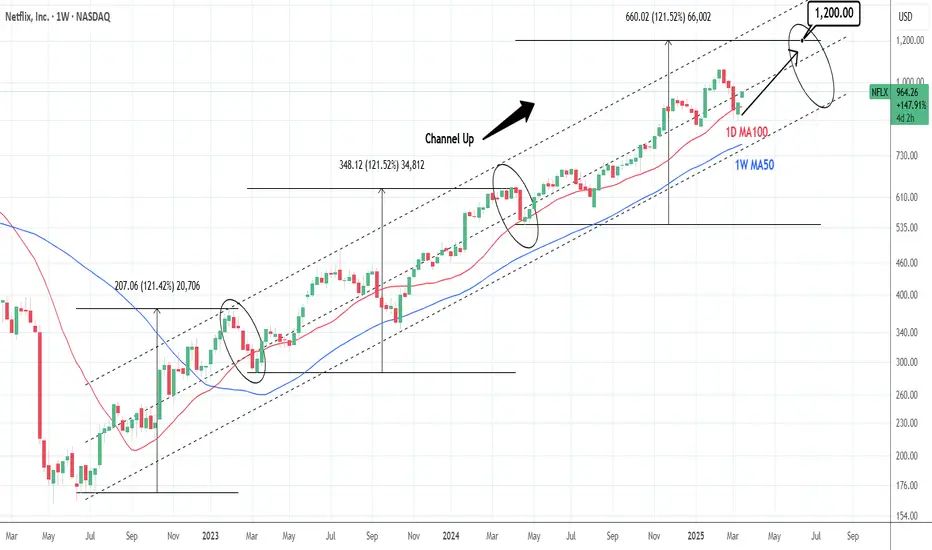
NETFLIX: Strong buy opportunity with this 1D MA100 bounce.Netflix is neutral on its 1D technical outlook (RSI = 52.399, MACD = -10.400, ADX = 30.636) and is rebounding on the 1D MA100. This is another HL on the 20 month Channel Up, which should be enough to give the stock a push to a new HH. The Channel Up is on its 3rd main bullish wave and both prior saw a +121.52% price increase. We expect the 3rd one to be completed by July. The trade is long, TP = 1,200.
## If you like our free content follow our profile to get more daily ideas. ##
## Comments and likes are greatly appreciated. ##
PayPal - Multiple Signals Pointing to a Potential Bottom!I’ve just entered a position in PayPal, and the reason is that several overlapping factors are lining up in a way that suggests a potential bottom may be in.
First, it looks very likely that Wave (2) is complete. The stock tapped the 61.8% Fibonacci retracement level with precision and has held that level over the past few days – all while the RSI has been climbing, which is a strong bullish divergence signal in my book.
Second, PayPal just touched last year’s VWAP level perfectly, which I view as another strong technical indicator for a potential reversal.
How far this move could go is still unclear, but the open gap above is definitely something I’m watching closely. For that to be in play, $71 needs to be reclaimed. And from here on, $66 should not be touched again.
That’s my plan – and that’s how I’m trading it. Let’s see if the market plays along.

TG Therapeutics (TGTX) – Biotech Innovation & Global ExpansionCompany Overview:
TG Therapeutics NASDAQ:TGTX is a biotech leader focused on novel cancer and autoimmune treatments, gaining momentum as an IBD Leaderboard and IBD 50 Top 10 Growth Stock.
Key Catalysts:
Regulatory Approvals & Expansion 🌍
BRIUMVI secured approvals in Europe & the UK, unlocking new revenue streams in key markets.
Strong Profitability & Growth 💰
88.3% gross margin ensures sustainable reinvestment into R&D and future pipeline advancements.
High-Growth Stock Recognition 📊
Technical strength is validated by its inclusion in top-performing stock lists, signaling strong investor confidence.
Investment Outlook:
Bullish Case: We are bullish on TGTX above $34.00-$35.00, driven by global expansion, financial strength, and biotech leadership.
Upside Potential: Our price target is $55.00-$56.00, supported by continued innovation and market penetration.
🔥 TG Therapeutics – Pioneering the Future of Cancer Treatment. #TGTX #Biotech #GrowthStocks

SHRIRAM FINANCESince the low in January 2024, the stock has been rising impulsively and is currently trading within wave 3. This indicates that any pullback should remain above the 590 zone, with prices expected to continue trending toward 730 in the coming weeks to complete the wave-4 and wave-5.

AmazonAmazon should definitely reach 151.37 (even if it moves up again, it will start to move down again)

My take on XRP for Vecino Peache.XRP is currently testing the 50 EMA on the daily time frame, a strong resistance level. Throughout February, it made multiple attempts to break above but failed. This suggests a possible correction. A confirmed break below the 200 EMA on the daily chart would further validate this bearish outlook.
My take; I have an OTZ (Optimal Trade Zone) on the 4-hour time frame, which acts as a strong support level. If price breaks below this zone, it signals a potential shift in market direction. As long as XRP respects this support, I will trade it conservatively.
Let me know what are your thoughts on my take.

BROADCOM: Is this a legit recovery on the 1D MA200?AVGO is almost neutral on its 1D technical outlook (RSI = 44.867, MACD = -8.280, ADX = 49.944) as it has stabilized following a direct contact with the 1D MA200. That was the first time the price hit that level since the September 9th 2024 low. This is also a technical HL at the bottom of the 9 month Channel Up, while also the 1D RSI is rebounding on its S1 Zone. The Sep 9th 2024 rebound hit its upper R1 level, so our worst case target is 250 (TP1), while the November 27th 2024 low rose by +59.97%, which gives a best case target of 285 (TP2).
## If you like our free content follow our profile to get more daily ideas. ##
## Comments and likes are greatly appreciated. ##

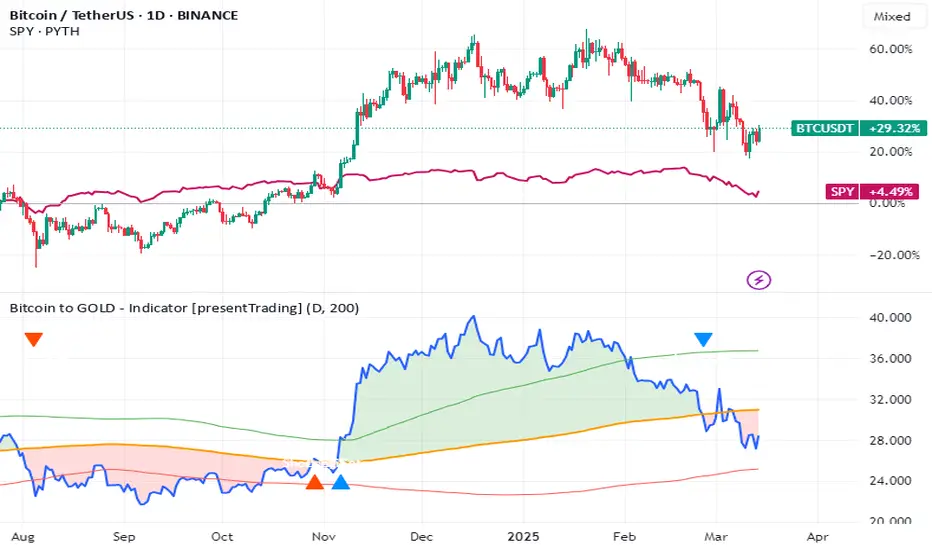
Bitcoin, S&P, Gold: Market Decline & DivergenceThe intricate dance of financial assets often reveals hidden correlations and predictive patterns. Recently, the synchronized decline of Bitcoin and the S&P 500 has raised concerns, while gold's historic rally has left Bitcoin trailing. However, a deeper dive into the data suggests a potential turnaround, hinting at a shift in market dynamics.
For much of the past few years, Bitcoin has exhibited a strong correlation with the S&P 500, behaving as a risk-on asset.1 When the stock market surged, Bitcoin often followed suit, and conversely, market downturns typically coincided with Bitcoin's price depreciation. This correlation stems from shared macroeconomic drivers, such as interest rate expectations, inflation concerns, and overall investor sentiment. The recent parallel decline reflects anxieties surrounding persistent inflation, potential interest rate hikes, and geopolitical uncertainties.
However, this synchronized movement doesn't tell the whole story. While Bitcoin and the S&P 500 have been grappling with downward pressure, gold has embarked on a remarkable rally, reaching unprecedented heights. This surge is fueled by several factors, including substantial inflows into gold ETFs, escalating geopolitical tensions, and heightened market volatility. Gold's traditional role as a safe-haven asset has been reaffirmed, as investors seek refuge from the turbulence in equity and cryptocurrency markets.
The divergence between Bitcoin and gold is particularly striking. The Bitcoin-to-gold ratio, a metric that reflects the relative value of Bitcoin compared to gold, has broken a 12-year support level. This breach signals a significant shift in investor preference, with gold emerging as the dominant asset. The recent climb of gold to a hypothetical $3,000 mark (or equivalent in other currencies) further underscores this trend, demonstrating its resilience in the face of economic uncertainty.
The observed pattern of Bitcoin breaking its multiyear uptrend against gold bears a striking resemblance to the market behavior witnessed between March 2021 and March 2022. During that period, Bitcoin experienced a similar decline relative to gold, ultimately leading to a substantial drop in its dollar value. This fractal pattern suggests that Bitcoin may be poised for further depreciation, potentially falling below the $65,000 mark.
However, it's crucial to acknowledge that historical patterns are not infallible predictors of future performance. Market dynamics are constantly evolving, and unforeseen events can significantly alter the trajectory of asset prices. While the current data points towards a potential decline for Bitcoin, there are countervailing factors that could trigger a reversal.
One such factor is the increasing institutional adoption of Bitcoin. As more institutional investors allocate a portion of their portfolios to cryptocurrencies, the market may become less susceptible to short-term fluctuations driven by retail sentiment. Moreover, the long-term potential of Bitcoin as a decentralized store of value remains a compelling narrative for many investors.
Additionally, the regulatory landscape surrounding cryptocurrencies is gradually becoming clearer. As governments and regulatory bodies establish frameworks for the operation of digital asset markets, investor confidence may improve, leading to renewed interest in Bitcoin. The upcoming Bitcoin halving is also anticipated to reduce the supply of new Bitcoin entering the market, which could potentially drive up its price.
While the current correlation between Bitcoin and the S&P 500 may persist in the short term, the underlying fundamentals of Bitcoin suggest a potential decoupling in the long run. As the cryptocurrency market matures and gains wider acceptance, its correlation with traditional asset classes may weaken.
The recent divergence between Bitcoin and gold highlights the importance of diversifying investment portfolios. While gold has proven its resilience in times of uncertainty, Bitcoin offers the potential for substantial returns in the long term. Investors should carefully consider their risk tolerance and investment objectives when allocating capital to these assets.
The breakdown of the Bitcoin to gold ratio is a concerning indicator, however, the cryptocurrency world moves quickly. The market is driven by new innovation, and adoption. The market has been known to have large pullbacks, followed by even larger rallies. The current market may be pricing in a large amount of fear, and a simple change in the news cycle could cause a large change in the price of bitcoin.
In conclusion, the current market dynamics present a complex picture. The synchronized decline of Bitcoin and the S&P 500, coupled with gold's historic rally, suggests a potential downturn for Bitcoin. However, the long-term potential of Bitcoin, coupled with increasing institutional adoption and a maturing regulatory landscape, could trigger a reversal. Investors should remain vigilant, monitor market trends, and make informed decisions based on a comprehensive understanding of the underlying fundamentals. The data suggests a potential turn around, but only time will tell if the market will comply.
Amd - Please Look At The Structure!Amd ( NASDAQ:AMD ) is about to retest massive support:
Click chart above to see the detailed analysis👆🏻
For about 5 years Amd has been trading in a decent rising channel formation. That's exactly the reason for why we saw the harsh drop starting in the beginning of 2024. But as we are speaking, Amd is about to retest a massive confluence of support which could lead to a beautiful reversal.
Levels to watch: $100
Keep your long term vision,
Philip (BasicTrading)

A Huge Technical Re-Test of This Important TL Has Just Occurred!Trading Family,
Tariff FUD is recking traders rn. After breaking important support which started in Nov. '24, I knew the SPY was in trouble. My first target down was 563. We hit that and broke it. My second target down was 550. We are there right now! Will it hold? I don't know. TBH, I don't think any analyst that is honest knows. Investors have never seen Tariffs levied like they have been recently by the Trump admin. Noone really knows how this is going to impact the current economy, which is now global (big diff from the last U.S. tariff econ in the late 1800's).
But I can say that this is a big support which is the neckline of our large long-term Cup and Handle pattern started all the way back in Jan. of 2022! We did have one retest already. Usually, this is all that is needed. But apparently, the market wants another. Though the support is strong, remember, every time it is tagged, it weakens. Thus, if it can't hold this current downturn, I suspect it will drop hard from here should it break, possibly dropping all the way to 460. Be prepared for this and watch your trendline closely!
On the other hand, if it holds, I see a huge bounce incoming! We'll probably then go all the way back up to test the underside of that support (red with two with lines) that we broke. Hold on to your hats! We are living in unprecedented times with unprecedented market volatility.
The last item to note is that, once again, this all seems to be occurring at the same time that U.S. congress and senate are voting on a continuing resolution. Correlation does not necessarily equal causation however, in this case, I would suggest that should a U.S. gov't shutdown occur, our support will break and down we'll go. Should a CR pass, big bounce incoming. Stay tuned and watch the news closely for this. It seems to be a news driven event.
✌️ Stew

AMD: Bottomed and can rally by as much as +140%.AMD is bearish on its 1D technical outlook (RSI = 40.266, MACD = -4.630, ADX = 52.178) but technically appears to be forming a new multi-month bottom after exactly 1 year of downside. The 1D RSI hit the S1 level, which priced the October 10th 2022 bottom. The outcome of that bottom was a +142.42% rally, same as the October 23rd 2023 Low, whose +142.42% rally formed the March 2024 ATH. This time this week's low has come very close to the S1 level, which is the strongest support level on the long term. A new potential +142.42% rally from the current levels would make a marginal ATH (TP = 230) and that's our current target for the end of the year.
## If you like our free content follow our profile to get more daily ideas. ##
## Comments and likes are greatly appreciated. ##
