TSLA (Tesla) long set up Entry 1 $220.00
Entry 2 $200.00
Stop loss $180.00
Take profit 1- $250.00
(Close 33%)
Take profit 2- $290.00
(Close 66%)
Take profit 3-$330
(Close 100%)
Stocktrading

NVIDIA: Megaphone bottomed. Rally to $195 starting.NVIDIA is almost oversold on its 1D technical outlook (RSI = 34.183, MACD = -6.220, ADX = 39.717) as it reach the bottom (LL) trendline of the Megaphone pattern that it has been trading in since November 21st 2024. This is not the first time we see NVDA inside such Megaphone pattern. As a matter of fact, it was during July-October 2023 when it last did so. The 3rd LL was the buy signal and it coincided with a Triple Bottom on the 1D RSI. This is the exact position we are at right now. The stock has completed three lows below the 1D MA50 and looks ready to rebound with force. The smallest recent rally has been +86.41%. The trade is long, TP = 195.00.
## If you like our free content follow our profile to get more daily ideas. ##
## Comments and likes are greatly appreciated. ##

TSLA (Tesla) long set upEntry 1 $255.00
Entry 2 $225.00
Stop loss $200.00
Take profit 1- $275.00
(Close 33%)
Take profit 2- $300.00
(Close 66%)
Take profit 3-$325
(Close 100%)

TSLA’s Failed Breakout: Reversal or Deeper Drop Ahead?Tesla (TSLA) Market Outlook & Long-Term Investment Report
Tesla (TSLA) has positioned itself as more than just an electric vehicle (EV) manufacturer. With its advancements in robotics, artificial intelligence (AI), autonomous driving, and energy solutions, Tesla is becoming a major player in multiple high-growth industries. While recent price action has shown volatility, long-term investors see buying opportunities at key support levels.
Technical Analysis & Key Levels
1. High-Timeframe Context (HTF)
- HTF Resistance: $415.71 – Tesla attempted to break above this level but faced rejection, leading to a sharp pullback.
- Major Support & Resistance Zone – A critical level where Tesla has previously consolidated and reacted strongly.
- Liquidity Zones (LQZs):
- Daily LQZ (~$238.18) – A key demand area where buyers could step in.
- Weekly LQZ (~$182.44 - $108.01) – A deeper liquidity zone, potentially offering even better long-term buying opportunities if the downtrend continues.
2. Market Structure & Trend Analysis
- **Failed Breakout:** Price action showed a breakout above resistance, but the failure to hold led to a sharp reversal, indicating a potential liquidity grab.
- **Retest of Support:** The price is currently testing a significant support level, which will determine the next move.
- **Momentum Shift:** The aggressive rejection at HTF resistance suggests sellers are in control in the short term, but this creates long-term entry opportunities.
Long-Term Investment Thesis
Tesla's expansion into AI, robotics, and autonomous technology presents significant long-term growth potential beyond its traditional automotive business. Here are the key areas driving Tesla's future:
1. Robotics & Artificial Intelligence
- **Tesla Optimus Robot:** Tesla’s humanoid robot project is expected to revolutionize industrial automation. It could become a major revenue source as industries move toward AI-driven labor solutions.
- **Neural Networks & AI Advancements:** Tesla’s AI systems, used for Full Self-Driving (FSD), are also being adapted for robotics, increasing its competitive edge.
2. Energy & Infrastructure Expansion
- **Solar & Energy Storage:** Tesla’s **Megapack** and **Powerwall** businesses are growing as renewable energy adoption accelerates.
- **Grid-Scale Energy Solutions:** Tesla’s energy division could play a crucial role in stabilizing power grids worldwide, providing another strong revenue stream.
3. Autonomous Vehicles & FSD
- Tesla’s **Full Self-Driving (FSD)** software could create a high-margin subscription-based revenue model.
- The potential for a **Tesla Robotaxi network** could disrupt the ride-sharing industry and unlock new business models.
4. Synergies with SpaceX & AI Computing
- Tesla benefits indirectly from advancements in **SpaceX** technologies, such as materials science and AI computing.
- The **Dojo supercomputer** is being developed to enhance AI training, which could accelerate Tesla’s robotics and self-driving ambitions.
Investment Strategy & Accumulation Plan
For long-term investors, Tesla's volatility provides attractive buying opportunities. A strategic approach would involve:
1. Key Accumulation Levels
- **Daily LQZ (~$238)** – A strong support zone where Tesla could see renewed buying interest.
- **Weekly LQZ (~$182-$108)** – A deeper level that may offer excellent long-term value if the price declines further.
2. Dollar-Cost Averaging (DCA) Strategy
- Instead of trying to time the absolute bottom, investors can **ladder buy-ins** at different liquidity zones to optimize their cost basis.
- This reduces risk and takes advantage of market dips without excessive exposure.
3. Risk Management & Long-Term Horizon
- Tesla is known for its volatility; maintaining **a long-term vision (5+ years)** is crucial for maximizing gains.
- Investors should be prepared for short-term fluctuations while focusing on Tesla’s multi-industry expansion.
Conclusion
Tesla’s failed breakout and recent pullback present a strategic buying opportunity for long-term investors. With its advancements in robotics, AI, energy, and autonomous technology, Tesla is well-positioned to be a key player in multiple trillion-dollar industries over the next decade. The current price action suggests that accumulation at liquidity zones could provide strong long-term returns.
As the robotics industry grows, Tesla’s potential as a leading producer for industrial automation is increasingly clear. Investors with a bullish long-term outlook may find current and upcoming dips as prime entry points.
Final Thought
**Is Tesla’s current dip a gift for long-term believers?** With its expanding technological footprint, this may be an opportunity to accumulate before the next major growth cycle. 🚀

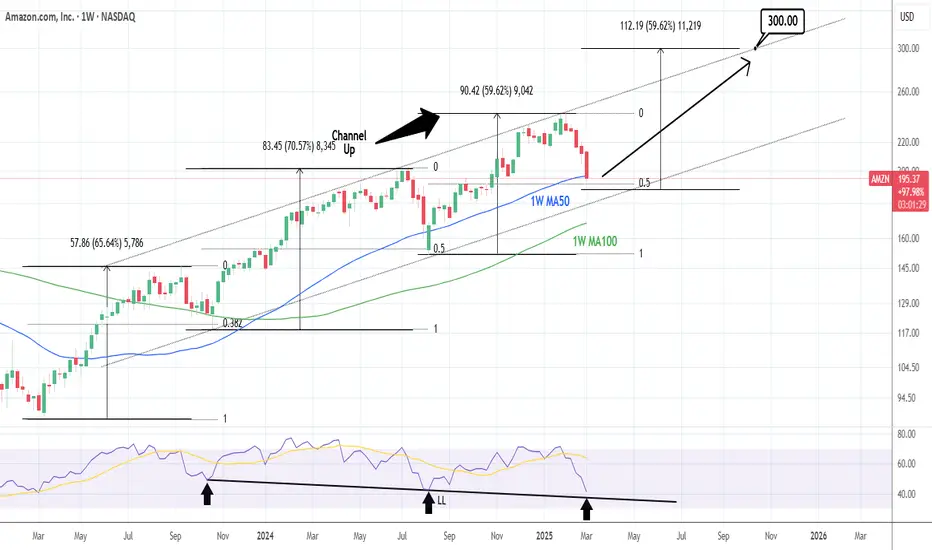
AMAZON: Oversold on 1D. Massive buy opportunity.Amazon is oversold on its 1D technical outlook (RSI = 27.320, MACD = -7.090, ADX = 63.698) and this is best displayed on the 1W timeframe where the price hit this week its 1W MA50 for the first time in 7 months. The decline since the January top is technically the bearish wave of Amazon's 2 year Channel Up. The previous HL was priced on the 0.5 Fibonacci level and the one before on the 0.382. We are now just over the 0.5 Fib again, while the 1W RSI is about to hit its LL trendline. All those form massive support levels for the stock, which translate into the best buy opportunity since the early August 2024 bottom. We are expecting a similar +59.62 bullish wave to begin. The trade is long, TP = 300.
## If you like our free content follow our profile to get more daily ideas. ##
## Comments and likes are greatly appreciated. ##
PALANTIR: It's a buy but don't expect a rally any time soon.Palantir is bearish on its 1D technical outlook (RSI = 41.509, MACD = -1.570, ADX = 35.869) as it's trading under the 1D MA50. The long term pattern is a Channel Up that gives a strong buy signal every time it hits its 1D MA100. As a matter of fact, the February 19th High has been a HH for the pattern and last time the price hit that top (July 31st 2023), it entered a lengthy Accumulation period. As in today, the 1D RSI was again on a similar Bearish Divergence. Consequently we believe that every 1D MA100 test is a buy opportunity, but the breakout rally will probably take another 4-5 months to happen. Aim for the 1.786 Fibonacci extension (TP = 200.00).
See how our prior idea has worked out:
## If you like our free content follow our profile to get more daily ideas. ##
## Comments and likes are greatly appreciated. ##

Google Update - Trade this range and new ATH Identified Update video on the google Long that has been planned since early FEB. The level has now been hit and we got a nice reaction off that level . In this video I look into where I think we go next and how price plays out .
In the video I use the following tools TR Pocket FIB , 0.618 FIB , Pivots , Parallel Channel and the Fixed range Vol Profile.
If we stay range bound inside the channel then we have the potential to see a new high on google at the top of the channel in confluence with 1-1 ext + tr pocket expansion .
Watch the video and mark the levels on your chart and ensure to set your alerts .
Dont forget to Boost the chart Please and i welcome any questions TY

COINBASE: Reached the bottom of the 1 year Channel Up.Coinbase is bearish on its 1D technical outlook (RSI = 39.040, MACD = -17.200, ADX = 47.118) and has hit the bottom of its 1 year Channel Up following a 4H Death Cross. This is typically seen at the end of downtrends and with the 4H RSI already rebounding after turning oversold, we technically have the best buy opportunity since September 6th 2024. The trade is long, TP = 395.00.
## If you like our free content follow our profile to get more daily ideas. ##
## Comments and likes are greatly appreciated. ##

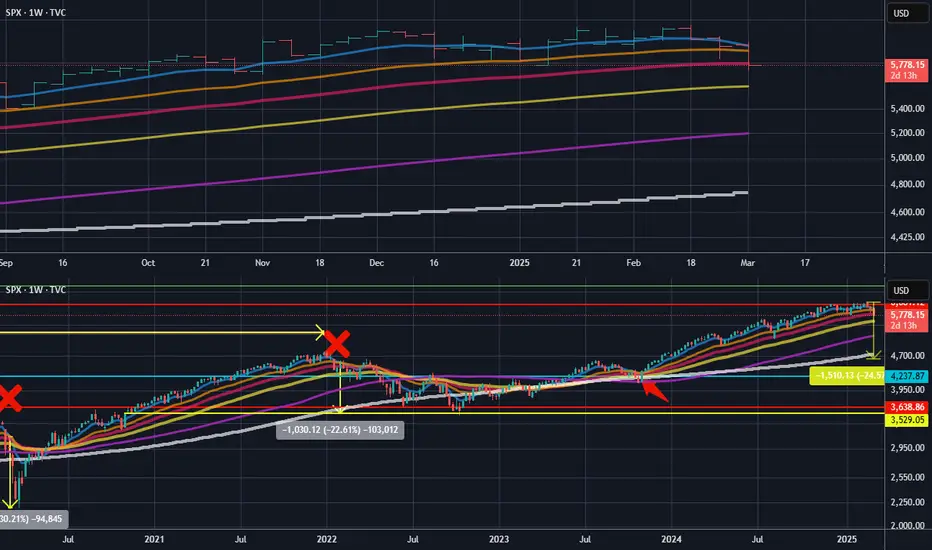
SPX chart update after calling moves to the $ for 3 yearsHere is the 1st chart I did of SPX back in Jan 2022:
I called the drop to the yellow line on chart. Nailed it to nearly the exact $.
Then in October 2023 I mentioned this:
The rally was confirmed for the next 6 months minimum.
Then in Jan 2024 I posted a red horizontal line as target for the rally:
Now you can see on current bottom chart that price hit the red line target.
This chart setup you see on bottom chart also shows relevance to the 1st chart I did on SPX where when the blue EMA8 went below the orange MA21, a drop happened as per the red X marks and price changes shown on chart. This is close to happening currently which is easier to see on the top chart as I give a close up view on current price action and the EMA/MA's.
Are we about to see a drop as per yellow price change on chart or can SPX bounce from here and move up to the green horizontal line on chart? The EMA/MA crossunder will tell us.
Even though I called the moves all correct previously, at this time in the markets, things are alot trickier so I cannot say with conviction this time around as to which way it will go.
I will update the analysis once the bounce or cross under is confirmed.
TSLA: Down 44% – Is This the Bottom?Tesla has been absolutely crushed since hitting its all-time high at $485. A 44% drop isn’t shocking after such a huge rally, but it’s still a brutal move. Now, we’re back into support, sitting near the level of Wave 1 – so far, nothing completely out of the ordinary.
Maybe to counter some of the selling pressure, Elon Musk tweeted yesterday that he sees a 1000% price increase in the next five years – if the work is put in. Take it however you want. The tweet probably gave TSLA a short-term boost, since Musk’s words always spark some level of hope. But we’ve seen this game before – big claims, and sometimes, reality doesn’t follow through.
Technically speaking:
As long as Tesla holds the order block between $240 and $260, or at least the current support, things don’t look too bad. But if that level breaks, things could get ugly – and $150 might not be far off.
For now, this remains one to watch.

MMM Technical Outlook: Potential Buy SetupMMM is in a strong bullish uptrend after finding support around the 76 zone in March 2024. The stock has posted positive earnings for four consecutive quarters, meeting expectations. Trading above the daily trendline, it's likely to fill the gap formed after January earnings, setting up a new higher low.
Entry Suggestions:
Buy 1: 142.5
Buy 2: 135.5
Stop Loss (on closing basis): 124
For exits, consider a tiered approach. In the near term, aim to book profits around 154.4 and 172. Looking ahead, there's potential for further gains with targets at 182 and 215, although these may take longer to materialize. A weekly bearish divergence is forming and could influence price action around the upcoming earnings on April 29. Until then, the price seems well-positioned to hit the initial targets, making this an attractive trading opportunity.
Happy trading!

Is NASDAQ Losing Steam? A Reality Check for TradersHey Realistic Traders, Is CAPITALCOM:US100 Out of Steam? Let’s Dive Into the Analysis…
On the daily timeframe, the Nasdaq remains above the EMA-100, which has served as strong support through multiple successful rebounds. Simultaneously, the price has moved above the bullish trendline, reinforcing the ongoing uptrend.
Within wave 4, the price formed a falling wedge pattern, followed by a breakout. This signals the initiation of wave 5, which could potentially extend beyond the length of wave 1, given that wave 3 did not exceed the 1.618 Fibonacci ratio. Meanwhile, the MACD indicator has already formed a bullish crossover, adding further confirmation of a positive outlook for the Nasdaq.
Considering these strong technical signals, the price is likely to move upward toward the first target at 23,538 , or potentially the second target at 24,356.
However, this bullish scenario depends on the price staying above the critical stop-loss level at 20,833.
Support the channel by engaging with the content, using the rocket button, and sharing your opinions in the comments below.
Disclaimer: "Please note that this analysis is solely for educational purposes and should not be considered a recommendation to take a long or short position on Nasdaq."

Starbucks (SBUX) AnalysisCompany Overview:
Starbucks NASDAQ:SBUX is executing a strategic turnaround, focusing on barista wages, store renovations, and menu optimization to enhance efficiency and customer experience.
Key Catalysts:
Loyalty & Digital Engagement 📊
34.6M U.S. Rewards members now drive 57% of total sales.
Personalized offers and data-driven engagement are boosting customer retention and spending.
China Expansion & Growth Potential 🌏
Despite a 4% decline in same-store sales, Starbucks opened 169 new stores, reinforcing its long-term commitment to China.
The region remains a key growth driver, with opportunities for premiumization and digital adoption.
Financial Strength & Shareholder Returns 💰
SEED_TVCODER77_ETHBTCDATA:5B in share buybacks could increase EPS by 3-4% annually.
A SEED_TVCODER77_ETHBTCDATA:1B sustainability bond aligns with ESG-focused institutional investors.
Investment Outlook:
Bullish Case: We are bullish on SBUX above $97.00-$98.00, driven by loyalty growth, operational improvements, and capital efficiency.
Upside Potential: Our price target is $160.00-$165.00, reflecting strong turnaround execution and long-term expansion.
📢 Starbucks—Brewing Growth with Digital Innovation, Expansion, and Shareholder Returns. #SBUX #StockMarket #LoyaltyEconomy

Tesla - Elon Is Playing The Charts!Tesla ( NASDAQ:TSLA ) is perfectly respecting structure:
Click chart above to see the detailed analysis👆🏻
Two months ago Tesla perfectly retested the previous all time high resistance and closed with a massive rejection wick. This means that a correction - which is currently happening - is expected and after the bullish break and retest, we will then finally see new all time highs.
Levels to watch: $280, $400
Keep your long term vision,
Philip (BasicTrading)

Forex Patterns that makes up market structureThe whole market is made up of two main patterns, the head and shoulders and inverse. For continuous and corrections, the double top and bottom.
leave a comment for more for information.

CHINA GALAXY ($601881.SS) Q4—STEADY IN CHINA’S STORMCHINA GALAXY ($601881.SS) Q4—STEADY IN CHINA’S STORM
(1/9)
Good morning, TradingView! China Galaxy (601881.SS) is buzzing—$ 35.37B ‘24 revenue, up 2.23% 📈🔥. Q4 hints at grit—let’s unpack this securities star! 🚀
(2/9) – REVENUE HUM
• ‘24 Haul: $ 35.37B—2.23% up from $ 34.6B 💥
• Steady: X says no big dips—brokerage shines 📊
• Edge: Tough market, still ticking
Galaxy’s humming—China’s steady hand!
(3/9) – EARNINGS ZAP
• ‘24 Profit: $ 10.13B—up 45.6% YoY 🌍
• EPS: $ 0.63—beats ‘23 slump 🚗
• Q4 ‘24: X buzzes resilience—details soon 🌟
Galaxy’s profit surges—market maestro!
(4/9) – BIG MOVES
• Lead: Tops brokerage, futures—$ 36.26B 🌍
• No Merge: CICC rumor nixed—solo run 📈
• Cash: $ 115.03B net—loaded vault 🚗
Galaxy’s flexing—steady as she goes!
(5/9) – RISKS IN SIGHT
• China Slow: Demand wobbles—yikes ⚠️
• Regs: Rules tighten—costs nip 🏛️
• Volatility: Trading dips could sting 📉
Hot run—can it dodge the heat?
(6/9) – SWOT: STRENGTHS
• Broker King: $ 36.26B—top dog 🌟
• Profit: $ 10.13B—45.6% zing 🔍
• Cash: $ 115.03B—rock solid 🚦
Galaxy’s a steady beast—built tough!
(7/9) – SWOT: WEAKNESSES & OPPORTUNITIES
• Weaknesses: Slow 2.23%, China lean 💸
• Opportunities: Digital boom, stimulus lift 🌍
Can Galaxy zap past the bumps?
(8/9) – Galaxy’s Q4 buzz—what’s your vibe?
1️⃣ Bullish—Profit shines bright.
2️⃣ Neutral—Solid, risks hover.
3️⃣ Bearish—China stalls it out.
Vote below! 🗳️👇
(9/9) – FINAL TAKEAWAY
Galaxy’s $ 35.37B ‘24 and $ 10.13B profit spark zing—steady champ 🌍🪙. Low P/E, but risks lurk—gem or pause?

META Technical Analysis: Potential Buy OpportunityMETA is currently exhibiting a bullish trend, trading above both its 100-day SMA and a key weekly trendline. The stock is currently retracing, having recently tested the 0.5 Fib retracement level, a common area of support. The RSI is also synced with the price action, further supporting the bullish outlook. This pullback could present a favorable buying opportunity.
Trading Recommendations:
Buy 1 (CMP): 669
Buy 2: 642
Stop-Loss: Closing below 575
Take Profit 1: 738
Take Profit 2: Open
A stop-loss order placed below the last higher low, which is also positioned below the trendline, is recommended on a closing basis. A laddered buy approach is suggested to take advantage of potential further price dips. Happy trading!

Alibaba (BABA) AnalysisCompany Overview:
Alibaba NYSE:BABA is a global e-commerce and technology powerhouse, with leadership in online retail, cloud computing, and digital entertainment.
Key Catalysts:
Generative AI Leadership 🤖
Alibaba’s Qwen2.5 Max AI model has outperformed GPT-4 and LLaMA3.1-405B in benchmark tests, reinforcing its AI dominance.
Strategic Partnership with Apple 🍏
Integration of Alibaba’s AI models into iPhones in China could boost Alibaba Cloud adoption, driving revenue growth and market share expansion.
Cloud Computing Growth ☁️
Alibaba Cloud’s margins are projected to expand from 3% to 10% by 2026, with 18% annual revenue growth, positioning it as a $100B valuation business.
Shareholder Value Initiatives 💰
A $25B share buyback and a growing 1.2% dividend yield reflect strong financial confidence and commitment to shareholder returns.
Investment Outlook:
Bullish Case: We are bullish on BABA above $108.00-$110.00, driven by AI advancements, cloud expansion, and strategic partnerships.
Upside Potential: Our price target is $185.00-$190.00, supported by cloud growth, AI innovation, and strong capital allocation.
📢 Alibaba—Powering the Future of AI, Cloud, and E-Commerce. #Alibaba #AI #CloudComputing #Ecommerce

Nike (NKE) at a Pivotal Point: Reversal or Further Decline?The weekly chart of Nike (NKE) displays a prolonged downtrend, with price action respecting a descending trendline. A harmonic Bat pattern has formed, with key Fibonacci retracement levels indicating potential reversal zones. The price has recently tested the AB=CD completion zone around $77.17 and $69.90, aligning with historical support.
Technical indicators suggest oversold conditions, as both momentum oscillators (stochastic and RSI) show signs of bullish divergence. A breakout above the trendline and sustained buying pressure could trigger a move towards T1 ($107.99) and T2 ($132.31). However, failure to hold support may lead to further downside continuation.

TESLA: The best buy entry is here. $600 long term.Tesla is bearish on its 1D technical outlook (RSI = 37.443, MACD = -16.180, ADX = 38.976) as it is expanding the bearish wave of the Channel Up, under the 1D MA50. As the 1D RSI rebounded at 30.000 and the 1D MACD is close to a BUllish Cross, we see a striking resemblance with the lows of August 5th 2024 and April 22nd 2024. With the help of the 1D MA100, we expect the price to start making a slow recovery. Go long on this bullish wave, TP = 600.
## If you like our free content follow our profile to get more daily ideas. ##
## Comments and likes are greatly appreciated. ##

Called before handplaying out nicely called it on feb 19 2025. everything was showing downside move. quarterly trade in play

PSX FFL TRADE IDEA LOOKING STRONG ON H2 AND H4FFL IS LOOKING STRONGON H2 AND H4. The stock retest its equal low where all of the big liquidity was resting at 14.50 Now the stock is heading to the next h2 resistance the breakout at H2 resistance with good volume will start a quick uptrend. Watch for volumes and orderbook.
The next target will be the previous lower low around 16.
Trading above EMA 21 at H2 AND H4.
VOLUME GAINER.
Buy before breakout if the volumes are rising watch on shorter time frame and see how the price reacts near the resistance. WATCH THE ORDERBOOK MUST and see what is being played there.

META: 2nd Expansion Era targets $900 by the end of the year.Meta may have only now turne bullish on its 1D technical outlook (RSI = 56.480, MACD = 20.520, ADX = 63.183) but on 1W it has been on an exceptionally healthy bullish tech (RSI = 66274) since the October 2022 bottom. Ever since that was formed, Meta entered its 2nd Expansion era with similarities in price and RSI terms obvious with the 1st Expansion era of 2012-2018. As long as the 1W MA50 supports, we can see a similar Channel Up targeting $900 by the end of 2025.
## If you like our free content follow our profile to get more daily ideas. ##
## Comments and likes are greatly appreciated. ##
