"STOXX50/EURO50" Trading Plan: Ride the Wave or Get Trapped?🚨 EUROPEAN INDEX HEIST: STOXX50 Breakout Robbery Plan (Long Setup) 🚨
🌟 Hi! Hola! Ola! Bonjour! Hallo! Marhaba! 🌟
Attention Market Bandits & Index Robbers! 🏦💶💸
Using 🔥Thief Trading tactics🔥, we're targeting the STOXX50/EURO50 for a clean breakout heist. The plan? Go long and escape before the MA trap snaps shut. Overbought? Yes. Risky? Absolutely. But real thieves profit when weak hands panic. Take your cut and run! 🏆💰
📈 ENTRY: TIME TO STRIKE!
Wait for MA breakout at 5460.00 → Then move fast!
Buy Stop Orders: Place above Moving Average
Buy Limit Orders: Sneak in on 15M/30M pullbacks
Pro Tip: Set a BREAKOUT ALARM - don't miss the action!
🛑 STOP LOSS: DON'T GET CAUGHT!
For Buy Stop Orders: Never set SL pre-breakout - amateurs get burned!
Thief's Safe Zone: Recent swing low (5300.00 on 4H chart)
Rebels: Place SL wherever... but don't cry later! 😈
🏴☠️ TARGET: 5680.00 (OR ESCAPE EARLY!)
Scalpers: Long only! Trail your SL like a pro
Swing Traders: Ride this heist for max gains
💶 MARKET CONTEXT: BULLISH BUT TRAPPY
Fundamentals: Macro data, COT reports, Quant analysis
Market Sentiment: Intermarket flows, positioning
Full Analysis: Check our bio0 linkss 👉🔗 (Don't trade blind!)
⚠️ WARNING: NEWS = VOLATILITY TRAP!
Avoid new trades during high-impact news
Lock profits with trailing stops - greed gets you caught!
💥 SUPPORT THE HEIST!
Smash that Boost Button 💖→ Stronger crew = bigger scores!
Steal profits daily with the Thief Trading Style 🎯🚀
Next heist coming soon... stay sharp! 🤑🐱👤🔥
Stocktrading

HUGE $5 to $49 today +900% vertical $MCTR told you early!HUGE 🤯 $5 to $49 today +900% vertical 🚀 shared a chart with you early before it went on a power squeeze NASDAQ:MCTR

$5 to $19 or +300% vertical! Catching a safe piece of $MCTR$5 to $19 🚀 Catching a safe piece daily from the move like that is all you need to keep the job away 💯 NASDAQ:MCTR

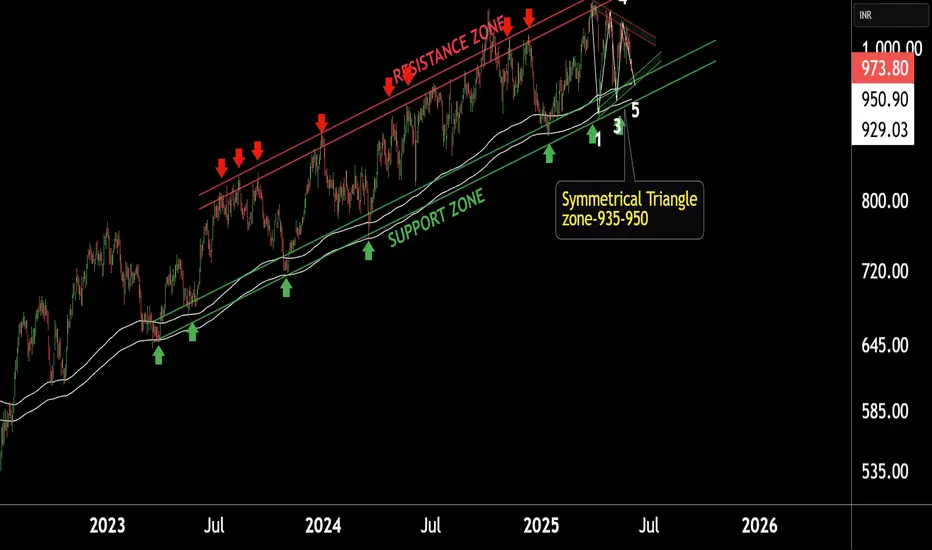
JSW Steel is near its Support LevelThis is Daily chart of JSWSTEEL.
The stock is trading within an Ascending Channel.
It is currently near the lower support zone of the channel, which lies in the ₹920–₹945 range.
Simultaneously, a Symmetrical Triangle pattern is forming with a consolidation range between ₹930–₹950.
The stock is currently taking dynamic support from two EMAs: the first EMA is providing support near ₹245, while the second EMA is acting as a deeper support around ₹230. Both EMAs are helping maintain the stock’s bullish structure."
If this level is sustain , we may see higher prices in the stock.
Full trade plan with exact prices laid out ahead of time!After shortsellers forcefully pushed NASDAQ:MODV down from mid $2's I said this will most likely result into powerful squeeze.
I said buy at the dip $2.31 exactly, waited to get filled, double dip to $2.31 happened to get a full position and from there straight up to mid $3's, took profits in 2 parts and sent out messages live as it was happening so everyone that followed along knew what to do.
Solid +30% gain in minutes, taking safest piece of the 200% move the stock made before focus shifted elsewhere.
That's how it's done, in and out at highly predictable levels, then moving on to the next stock because NASDAQ:NIVF NASDAQ:EYEN NASDAQ:REVB are already up and hot this morning, not marrying it and holding & hoping forever.

NVIDIA: 4H Golden Cross starting new Channel Up Leg.NVIDIA is bullish on its 1D technical outlook (RSI = 65.736, MACD = 5.860, ADX = 49.646) as it has established and maintained a Channel Up since its April bottom. The completion of a 4H Golden Cross has validated the start of the pattern's new bullish wave. The previous one topped at +30.58%. With the price already rebounding, we are bullish, aiming for a new HH (TP = 169.00).
See how our prior idea has worked out:
## If you like our free content follow our profile to get more daily ideas. ##
## Comments and likes are greatly appreciated. ##

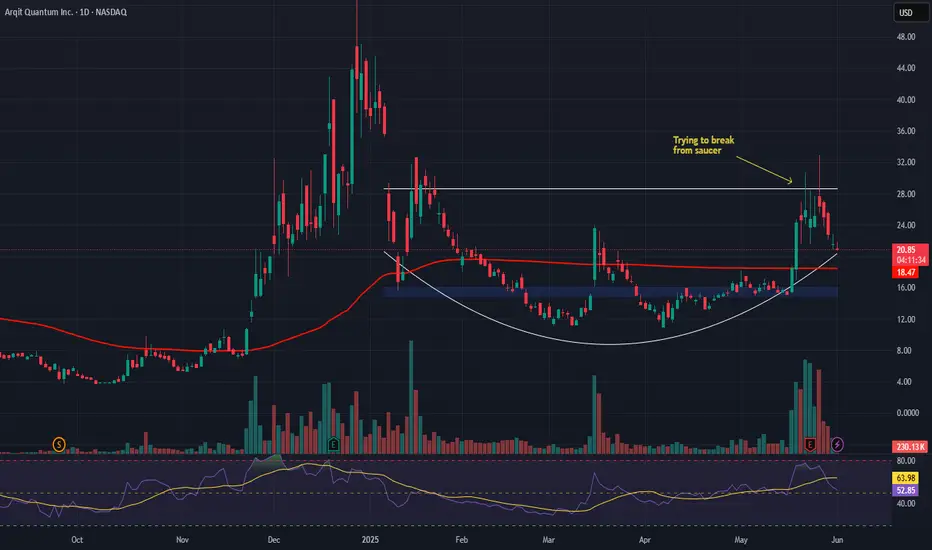
Arqit Quantum Inc. (ARQQ) – Securing the Future of DataCompany Overview:
Arqit NASDAQ:ARQQ is redefining cybersecurity by offering quantum-resilient encryption solutions—future-proofing critical communications infrastructure for governments, enterprises, and hyperscale cloud networks.
Key Catalysts:
Strategic Acquisition of Ampliphae 📡
Adds a powerful risk management suite + experienced innovation team
Expands Arqit’s capability to serve end-to-end encryption needs across cloud, edge, and IoT systems
Government Validation & Traction 🏛️
Multi-year license deal with a government client in EMEA
Signals institutional confidence, even with deferred revenue accounting
Quantum Threat = Rising Demand 📈
As quantum computing advances, the need for quantum-safe encryption becomes urgent
Arqit’s cloud-based QKD platform is uniquely suited to meet these demands at scale
Enterprise-Grade Solutions 🌐
Positioned to become a go-to cybersecurity partner for mission-critical infrastructure in a post-quantum world
Targeting global clients across finance, defense, telecom, and more
Investment Outlook:
✅ Bullish Above: $15.00–$16.00
🚀 Upside Target: $43.00–$44.00
🔒 Key Drivers: Strategic M&A, government adoption, quantum-resilient tech, first-mover advantage
Arqit isn’t just building encryption—it’s building the cybersecurity foundation for the quantum era. #ARQQ #QuantumSecurity #FutureProof
Mastercard: Approaching the Top of Wave BMastercard has rebounded after a brief cooling period, and we now expect turquoise wave B to complete just below resistance at $620. Once that top is in, wave C should drive a meaningful retracement, ending with the low of magenta wave (4). Alternatively, if turquoise wave alt.(4) has already bottomed — which we estimate as a 40% probability — then a direct breakout above $620 would suggest a shift toward a much more aggressive advance. That path would take the stock straight into magenta wave (5), completing blue wave (I) with a strong rally.
📈 Over 190 precise analyses, clear entry points, and defined Target Zones - that's what we do.

GiftNifty at Best Support !!This is the 4 hour chart of GiftNifty
And GiftNifty having good Law of Polarity at 24500 range
If this level is sustain, then we may see higher prices in GiftNifty
Thank You !!

$1 to $7.18 continued to 600% vertical $BMGLIt just didn't want to stop ripping higher, congrats if you got in if not sooner then at least when I posted a chart in $3's there was still time to catch a doubler up into $7's NASDAQ:BMGL

S&P 500 Daily Chart Analysis For Week of May 30, 2025Technical Analysis and Outlook:
The S&P 500 Index has undergone considerable price fluctuations during the trading sessions of this week, successfully reaching a critical target at the Mean Support level of 5800. Presently, the index is exhibiting an upward trend with a focus on the retest of the Inner Index Dip at 5955 and Key Resistance at 5965. Furthermore, additional significant levels have been identified, including the Next#1 Outer Index Rally at 6073, Key Resistance at 6150, and the Next#2 Outer Index Rally at 6235. Conversely, there is a potential for the index prices to downfall aiming to retest Mean Support 5800 and to complete the Outer Index Dip, noted at 5730.

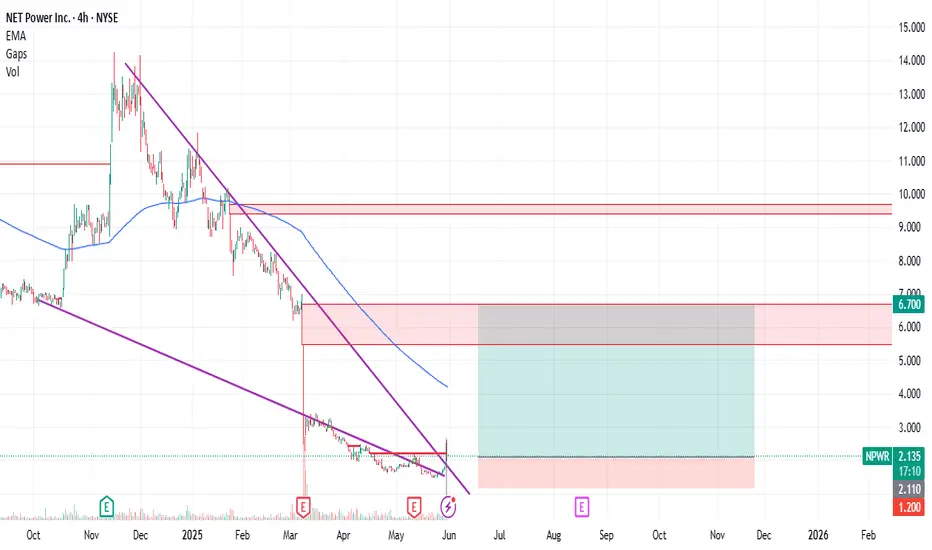
NPWR : Small Position Size Play with 5.00 Risk-Reward RatioNet Power Inc. NPWR stock has seen high volume and a tendency to break the falling wedge. Can this initiative close the gap that ended at 6.7 ?
This traded can be tried with very small position size.
Because Stop-Loss and Target are very wide.
Risk-Reward Ratio : 5.00
Stop-Loss : 1.20
Target: 6.70
AMD LONG IDEA: AMD IS READY FOR A GOOD BULLISH RUNAMD is bouncing off the monthly time frame key level that is acting as support for price.
On weekly time frame and daily we had a shift in market structure from bearish trend to bullish.
I will be buying AMD on this retracement to the recent weekly gap created by price.
Once I see a good bullish price confirming that the retracement is over, i will enter for a buy trade.
My overall target is the 187 price level.

Tesla: Completed!TSLA has moved somewhat closer to the resistance at $373.04 since our last update, but these gains have now been tempered. We now consider the turquoise wave 4 as finished and anticipate imminent sell-offs during wave 5. These should eventually complete the magenta wave (3) of a larger downward impulse below the support at $215.01. However, due to recent upward momentum, we have increased the relevance of our alternative scenario. We now consider it 38% likely that the stock has already completed the large correction of the blue wave alt.(II) with the last significant low and will continue to rise directly during wave alt.(III). In this case, the price would next not only rise above the nearby resistance at $373.04 but also overcome the higher levels at $405.54 and $488.50.
📈 Over 190 precise analyses, clear entry points, and defined Target Zones - that's what we do.

Is This the Perfect Moment to Execute the Tesla Heist?💰 Tesla Stock Market Heist Blueprint 🚀
🌟 Hi! Hola! Ola! Bonjour! Hallo! Marhaba! 🌟
Dear Money Makers & Robbers, 🤑💰💸✈️
Here’s our grand plan: a 🔥Thief Trading Style heist🔥 targeting the TESLA stock! Let’s break in with this cunning strategy — chart-ready and primed for action!
🎯 Entry:
The vault’s open! Grab the bullish loot at any price — the heist is live!
Tip: For precision, use a buy limit order on 15m/30m swing highs or lows — that’s your perfect pullback entry!
🛑 Stop Loss:
Thief SL is stashed at the nearest swing low (or just below the MA on the daily chart ~300.00 for swing trades).
Tailor SL to your trade risk, lot size, and your thieving gang’s order plan.
🏴☠️ Target:
460.00 — or vanish before hitting the target to avoid the traps of the overbought zone!
💎 The Setup:
We’re seeing bullishness fueled by key factors: macro moves, fundamentals, sentiment, intermarket trends… it’s all in play! 📈🔗🌏
Check the macro, COT report, sentiment outlook, and future trend targets to stay ahead of the game!
⚠️ Trading Alert:
News releases can flip the game fast.
Avoid fresh trades during major news.
Use trailing stops to lock in those juicy profits and protect your loot.
❤️🔥 Support the Heist Crew!
💥Hit the Boost Button💥 — fuel our robbery plans and let’s keep cashing in every day!
The Thief Trading Style: slick, powerful, and ready for the next heist.
See you soon with another plan, fellow robbers! 🤑🐱👤🤩

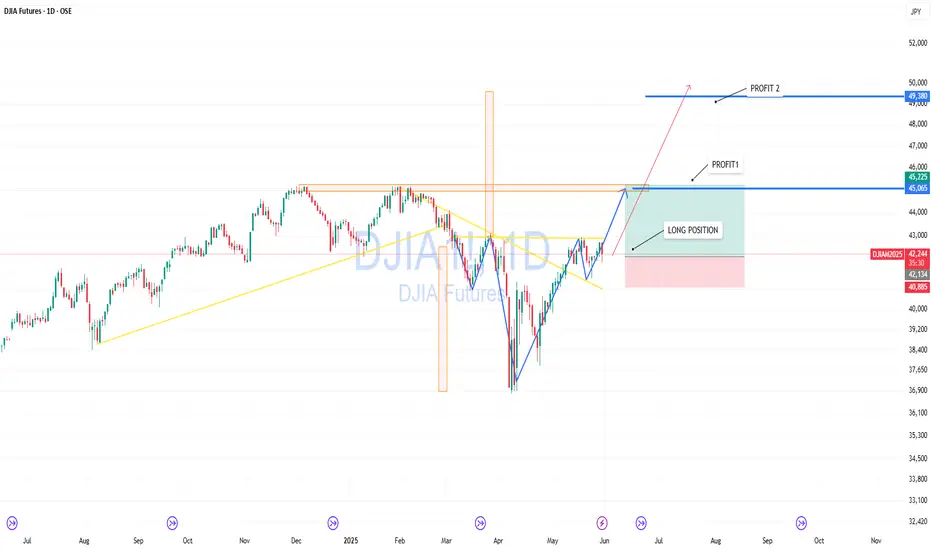
DJIA — Setting Up for Breakout and New ImpulseThe Dow Jones Index is approaching a critical resistance zone. After a deep V-shaped recovery and clear bullish structure, price is preparing for a breakout.
Chart shows a clean long entry with a stop below the recent consolidation. A break and hold above 45,000 could lead to a move toward 46,000, and if momentum holds — up to 49,300.
Partial profit-taking levels:
— Target 1: 45,225
— Target 2: 49,380
Fundamentally, US equity markets remain strong, and DJIA may play catch-up after lagging during the last correction.
Credo Technology Group (CRDO) – Powering the AI Data Center BoomCompany Snapshot:
Credo Technology NASDAQ:CRDO is a rising star in AI infrastructure, delivering high-speed, low-power connectivity solutions that are mission-critical to modern data centers.
Key Catalysts:
AI Infrastructure Tailwinds 🧠🏢
Direct exposure to Active Electrical Cables (AEC) and PCIe retimers
Positioned for rapid demand acceleration from AI, cloud, and hyperscale data centers
AEC chip market expected to grow 15x from $68M (2023) to $1B+ by 2028
Sticky Software + Hardware Model 🧩
PILOT software platform offers real-time diagnostics and performance tuning
Enables a recurring revenue model and strengthens customer retention
Scalable, Energy-Efficient Portfolio ⚡🌐
High-bandwidth, low-power design aligns with sustainability goals of large data centers
Integrated solutions are already seeing early adoption momentum
Investment Outlook:
✅ Bullish Above: $51.00–$52.00
🚀 Upside Target: $90.00–$92.00
📈 Growth Drivers: AI infrastructure demand, software expansion, chip market scale
💡 Credo isn’t just riding the AI wave—it’s building the rails for it. #CRDO #AIInfrastructure #Semiconductors

IBM: Bullish AttemptsIBM has made progress in our scenario: Currently, the price is rising above the crucial resistance at $265.72; clearly surpassing this mark is important in the ongoing wave (3) in magenta. While we cannot entirely remove our alternative scenario with a new low for wave alt. in green, it still holds a 33% probability. We primarily expect that the regular wave in green was already completed at $211.52 and are therefore preparing for a direct continuation of the increases in the broader wave in green.
📈 Over 190 precise analyses, clear entry points, and defined Target Zones - that's what we do.

Apple Stock Heist Blueprint – Precision Buy Setup Unlocked!🏴☠️ Apple Stock Heist: The Stealthy Long Setup
🎯 Entry Zone – Loot the Dip!
Current Price: $200.21
Action: Initiate long positions now or target pullbacks near the $193–$190 support zone.
Pro Tip: Place buy limits near swing lows/highs. Utilize chart alerts as your secret weapon.
🛡️ Stop Loss – Guard the Treasure!
Swing Traders: Position stop loss below the $190 support level.
Day Traders: Adjust stop loss according to your risk tolerance and order count.
TECHi
💰 Profit Target – Escape with the Loot!
Primary Target: $210 resistance zone.
Secondary Target: $227–$230 range.
⚔️ Scalpers vs. Swing Traders – Choose Your Weapon!
Scalpers: Focus on quick strikes. Enter long positions and exit swiftly.
Swing Traders: Trail stops and lock in gains as the price moves in your favor.
🌪️ Market Pulse – Bullish Winds Blowing!
Technical Indicators: Price is supported near $201, with potential to bounce back toward local resistance at $213.
RSI: Approximately 35 on the 1-hour timeframe, indicating oversold conditions and potential for a rebound.
TradingView
⚠️ News Trap Warning!
Upcoming Events: Monitor for any high-impact news that may affect Apple's stock price.
Strategy: Freeze trades or tighten stops ahead of major announcements.
🚨 Join the Trading Crew!
Engage: Like 👍 or Boost 🚀 this idea to fuel our next raid.
Support: Your engagement keeps the strategies alive!
🤑 Stay Locked In – The Next Big Score is Coming…
Timing: Watch the charts closely.
Action: Strike hard. Exit smarter.

DELL Stock Price Analysis Ahead of Earnings ReleaseDELL Stock Price Analysis Ahead of Earnings Release
In addition to Nvidia’s (NVDA) quarterly report, this week financial market participants are also closely watching Dell Technologies’ (DELL) earnings release, scheduled for Thursday, 29 May, after the close of the trading session.
According to analysts cited by the media:
→ the company’s revenue is expected to come in at $23.18 billion (compared to $22.24 billion in the same period last year, and $23.9 billion in the previous quarter);
→ particular attention will be paid to Dell’s business segment focused on manufacturing servers for AI applications.
Notably, DELL’s price chart shares several similarities with the NVDA chart we analysed yesterday.
Technical Analysis of DELL’s Share Price
Price movements have formed a downward channel (shown in red) that has remained valid since 2024. In a broader context, it resembles a bullish flag pattern, which typically signals the potential continuation of an uptrend — a scenario that seems increasingly likely given the following:
→ the DELL’s price is currently near the upper boundary of the channel;
→ the May price rally suggests strong demand for DELL shares. Note the confident breakout above the psychologically significant $100 level (highlighted by the arrow), accompanied by a bullish gap and a series of rising candlesticks.
It is possible that the upcoming earnings report will act as a catalyst, enabling the bulls to gather momentum and attempt a breakout from the prevailing downward channel.
This article represents the opinion of the Companies operating under the FXOpen brand only. It is not to be construed as an offer, solicitation, or recommendation with respect to products and services provided by the Companies operating under the FXOpen brand, nor is it to be considered financial advice.

SPY (S&P500 ETF) - Price Bounced Above Gap Support Zone - DailySPY (S&P500 ETF) price has bounced up from the $576 price support gap level.
EMA Golden Cross is still active, the yellow 50EMA crossed above the red 200EMA which could signal a longer term bullish rally.
SPY price has been in an uptrend since May 2025.
Resistance Levels: $594, $596, $600, $607, $613.
Support Levels: $581, $575, $572, $567, $564.
Tariff and trade deal news, corporate earnings, presidential and government law changes, inflation data, economic data, and consumer sentiment can all affect Stock and ETF prices.

Apple: Wave [2] Correction We now consider the dark green wave to be complete and thus place AAPL in the intermediate corrective movement of wave , which can be further subdivided into waves (A), (B), and (C) in magenta. Currently, only the last part of this (C) wave should be missing before the next impulsive uptrend unfolds towards the previous all-time high. We must still weigh our alternative scenario with a 34% probability: If the price falls below support at $168, this scenario with a new low for the blue wave alt.(IV) would be confirmed, although in this case, the price should not fall significantly below our previous Target Zone.
📈 Over 190 precise analyses, clear entry points, and defined Target Zones - that's what we do.

What Is Stock Tape Reading, and How Do Traders Use It?What Is Stock Tape Reading, and How Do Traders Use It?
Tape reading is a real-time market analysis method used to track buying and selling pressure. Unlike technical indicators, which rely on historical data, tape reading focuses on executed trades, order flow, and liquidity shifts. Traders use it to assess momentum, identify institutional activity, and refine trade timing. This article explores how tape reading works, its role in modern markets, and how traders apply it to short-term decision-making.
The Origins and Evolution of Tape Reading
Tape reading began in the late 19th century when stock prices were transmitted via ticker tape machines, printing a continuous stream of price updates on paper strips. Traders would gather around these machines, scanning for large trades and unusual activity to anticipate market moves. One of the earliest and most well-known tape readers, Jesse Livermore, built his fortune by studying these price changes and spotting institutional buying and selling patterns.
By the mid-20th century, as markets became faster and more complex, ticker tape machines were replaced by electronic order books. Instead of scanning printed numbers, traders began using Level 2 market data and time & sales windows to track order flow in real time. This transition allowed for more precise liquidity analysis, making it easier to see how large orders impacted price movement.
The rise of algorithmic and high-frequency trading (HFT) in the 2000s further changed the landscape. Today, market depth tools, order flow software, and footprint charts have replaced traditional tape reading, but the core principle remains the same: analysing how buyers and sellers interact in real time. While charts and indicators offer historical insight, tape reading provides a direct window into current market behaviour, giving traders an edge in fast-moving conditions.
How to Read the Tape
Nowadays, tape reading is all about real-time market data—watching when and how orders are placed and filled to gauge momentum and liquidity. Unlike technical indicators, reflecting past price action, tape reading focuses on what’s happening right now. Stock, forex, and commodity traders use it to assess buying and selling pressure, spot large orders, and understand market sentiment as it unfolds. Here is the key information provided by tape reading:
Time & Sales
The time & sales window (the tape) displays every completed trade. Each entry shows time, price, trade size, and whether it hit the bid or ask.
- Trades at the ask suggest aggressive buying, as buyers are willing to pay the market price.
- Trades at the bid indicate selling pressure, as sellers accept lower prices.
- Large block trades often signal institutional activity—tracking these can reveal where big players are positioning.
Bid-Ask Activity
Nowadays, an order book is a part of tape reading. The order book (Level 2 or DOM) shows the number of buy and sell orders at different price levels. While not all orders get filled, traders watch for:
- Stacked bids (a high concentration of buy orders) near a price level, which may indicate strong buying interest.
- Stacked offers (large sell orders) acting as resistance.
- Orders rapidly appearing or disappearing, suggesting hidden liquidity or fake orders meant to mislead traders.
Volume and Trade Size
Changes in trade size and volume help traders judge the conviction behind a move:
- Consistent large trades in one direction can suggest institutions accumulating or distributing a position.
- A surge in small trades may indicate retail participation rather than institutional moves.
- A sudden drop in trade activity after a sharp move may hint at exhaustion or a potential reversal.
Trade Speed
The pace of executions matters.
- Fast, continuous transactions suggest urgency—buyers or sellers are aggressively taking liquidity.
- A slowdown in transactions near a key level can indicate hesitation or a shift in sentiment.
Tape Reading vs Technical & Fundamental Analysis
Tape reading differs from technical and fundamental analysis in both approach and timeframe. While technical traders study historical price patterns and fundamental analysts focus on company performance and economic data, tape readers focus on real-time order flow to assess market direction as it develops.
Technical Analysis
Technical traders rely on chart patterns, moving averages, and oscillators to identify trends and potential turning points. These tools are built on past price data, meaning they lag behind actual market activity. For example, a trader using a moving average crossover strategy waits for confirmation before acting, whereas a tape reader sees momentum shifting as it happens by watching the flow of orders.
Fundamental Analysis
Fundamental analysis is longer-term, based on financial statements, earnings reports, and macroeconomic indicators. Investors using this approach focus on factors like revenue growth, interest rates, and industry trends to decide whether a stock is undervalued or overvalued. Tape reading, by contrast, ignores these metrics entirely—it’s used by short-term traders reacting to immediate buying and selling pressure.
Where Tape Reading Fits In
Many traders combine approaches. A day trader might use technical analysis to find key price levels and then apply tape reading to fine-tune entries and exits. Similarly, a swing trader tracking earnings reports may use tape reading to see how large players are reacting. Each method provides different insights, but tape reading offers a unique advantage: it reveals market sentiment in real time, helping traders assess momentum before price movements become obvious.
Advantages and Disadvantages of Tape Reading
Tape reading gives traders an inside look at real-time market activity, but it also comes with challenges, especially in modern electronic markets.
Advantages
- Immediate Market Insight: Unlike lagging indicators, tape reading reflects live buying and selling pressure, helping traders react before price changes become obvious.
- Identifying Large Buyers & Sellers: Institutions often execute orders in patterns, leaving clues in the stock market tape. Recognising these can help traders gauge potential price direction.
- Fine-Tuning Entries & Exits: By tracking order flow near key price levels, traders can time their trades more precisely rather than relying on static chart signals.
- Useful in Fast-Moving Markets: Tape reading can be particularly valuable in scalping and day trading, where short-term momentum plays a key role.
Disadvantages
- Algorithmic Trading Distortion: High-frequency trading firms place and cancel orders rapidly, making it harder to interpret true supply and demand.
- Steep Learning Curve: Unlike technical analysis, which provides visual patterns, tape reading requires experience in spotting meaningful order flow changes.
- Mentally Demanding: Constantly watching the tape can be exhausting, requiring a high level of focus and quick decision-making.
- Less Effective in Low-Volume Markets: When liquidity is thin, tape reading becomes unreliable, as fewer trades mean less actionable data.
Modern Footprint Charts and Order Flow Software
While some stock tape readers rely on raw order flow data, many use footprint charts and order flow software to visualise buying and selling pressure more effectively.
Footprint charts display executed trades within each price bar, showing volume distribution, bid-ask imbalances, and point of control (POC)—the price level with the highest traded volume. This helps traders see where liquidity is concentrated and whether buyers or sellers are in control.
Order flow software offers heatmaps, cumulative delta, and volume profile tools. Heatmaps highlight resting liquidity in the order book, revealing where large players may be positioned. Cumulative delta tracks the difference between market buys and sells, helping traders assess momentum shifts.
These tools provide a more structured approach to tape reading, filtering out noise and making it easier to spot large orders, absorption, and potential reversals. While experience is still essential, modern software gives traders a clearer view of market behaviour beyond just raw time & sales data.
The Bottom Line
Reading the tape remains a valuable tool for traders looking to analyse real-time order flow and market liquidity. While there are numerous algorithms that place trades, understanding executed trades and bid-ask dynamics can provide an edge in fast-moving conditions.
FAQ
Is Tape Reading Still Useful in Trading?
Yes, but the application of tape reading in trading has changed. While traditional tape reading focuses on printed ticker tape, modern traders use time & sales data, Level 2 order books, and footprint charts to analyse order flow. High-frequency trading and algorithmic activity have made tape reading more complex, but it remains valuable for scalpers, day traders, and those tracking institutional activity.
What Are the Principles of Tape Reading?
Tape trading is based on real-time order flow analysis. Traders focus on executed trades (time & sales), bid-ask activity (order book), volume shifts, and trade speed to gauge buying and selling pressure. The goal is to understand how liquidity moves in the market and spot signs of institutional accumulation or distribution.
What Is the Difference Between Order Book and Tape?
The order book (Level 2 or DOM) shows pending orders at different price levels, representing liquidity that may or may not get filled. The tape (time & sales) displays completed transactions, showing actual buying and selling activity in real time.
What Is the Difference Between Technical Analysis and Tape Reading?
Technical analysis relies on historical price patterns and indicators, while tape reading focuses on real-time executed trades and market depth. Technical traders look at charts, whereas tape readers analyse live order flow to assess momentum and liquidity shifts.
How to Read Ticker Tape?
Modern ticker tape is displayed in time & sales windows on trading platforms. Traders monitor price, trade size, and whether transactions occur at the bid or ask. Rapid buying at the ask suggests demand, while consistent selling at the bid indicates selling pressure.
This article represents the opinion of the Companies operating under the FXOpen brand only. It is not to be construed as an offer, solicitation, or recommendation with respect to products and services provided by the Companies operating under the FXOpen brand, nor is it to be considered financial advice.
