NEM SHORT IDEANEM Insurance stock is ready to have a drop. There's a bearish divergence signal from the awesome oscillator showing that there's a high tendency for the price of the stock to drop as much as to 11.65 and below that value. Any value below 11.50 is the discount level where there can be a potential for the next long opportunity.
Looking at the past data, some patterns were revealed. In September 2016, there was a bearish divergence signal and the price dropped from around 3.71 to around around 1.51. Likewise, in September 2022, there was a bearish divergence and the price dropped from around 5.65 to around 3.71. Similar pattern is what is repeating itself showing that there's a higher probability that the price dropped into the discount level. For an investor holding this stock, this maybe a signal to sell and wait for another long opportunity. For a trader, it's an opportunity to short the stock, targeting the discount price around 11.65.
Confluences for the short signal:
1. Price is showing higher high while awesome oscillator is showing lower high indicating bearish divergence.
2. When similar patterns occured in the past, price dropped into the discount level.
3. A bearish engulfing candlestick had been formed showing that price is likely going to drop further.
Disclaimer: This is not a financial advice. The outcome maybe different from the projection. If you can't accept the risk, don't take the signal.
Stocktrading

NASCON LONG IDEA CONTINUATIONNASCON stock reached its all time high value of around 77 in January 2024. This happened after a bearish divergence signal from the awesome oscillator. Then, it dropped into the discount level. After which a bullish divergence signal was given, followed by a breakout. Since that breakout, price has been going up and rally for the all-time-high value. The first long opportunity could have been in November 2024 when the price was around 30. The next opportunity was when the price was around 44. Then the next opportunity was when price was around 54. Joining the rally now is not too late since the stock has a potential to hit 77.
Confluences for the long idea
1. Price was coming from the discount level.
2. Price broke out of a down trend line.
3. Price has been rally after a bullish divergence signal given by the awesome oscillator.
4. Bullish engulfing candlestick was formed recently after breaking a key level.
Disclaimer: this is not a financial advice. The outcome maybe different from the projection. If you can't accept the risk, don't take the signal.

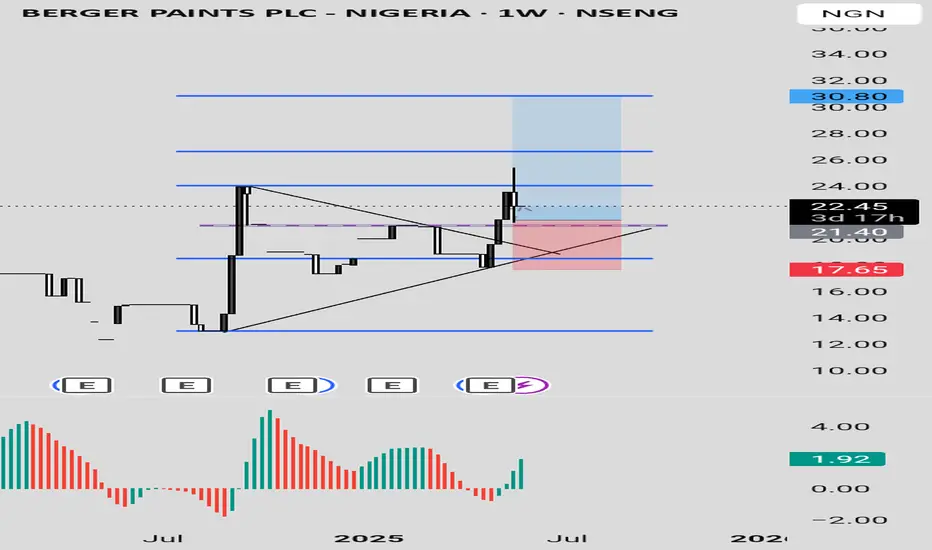
Berger Paints PLC Berger Paints PLC stock is showing a bullish signal for appreciating in value. The price dropped into a discount level and broke a down trend line with a strong bullish candle, closing above the trendline. This happened when the price was also in an oversold region as indicated by Awesome Oscillator.
Currently, there has been a pull back with a rejection, showing more confidence in the bullish move. The stock can be bought at the current price while targeting 24, 26.60 and 30.80 as the final target based on the Fibonacci level.
Confluences for the long signal:
1. Price is coming from a discount level
2. Price was in oversold level before and it is showing more bullish signal
3. Price had broken out of a down trend line with a strong bullish candle
4. There was a strong rejection from last week candle.
Disclaimer: this is not a financial advice. The outcome maybe different from the projection. Don't take the signal if you don't accept the risk.
Heikin Ashi VS Regular candlesticks - EducationalNASDAQ:AMZN
Everything is explained in the video.
I hope you will find it very educational and test it. Those who trade stocks will probably switch to Heikin Ashi :)
Thank you!

Intel Breakdown Alert! Bearish Setup with High R:R Opportunity !📉 Intel Corporation (INTC) – Bearish Setup Analysis
Timeframe: 4H | Ticker: NASDAQ:INTC | Exchange: NASDAQ
🔍 Technical Breakdown
We are currently observing a potential bearish reversal on Intel Corp. following a clear breakdown from a rising parallel channel on the 4H chart.
🟦 Pattern Observed
Price was previously moving within a rising channel, forming higher highs and higher lows – a typical short-term bullish structure.
Recently, price broke down below the lower boundary of this channel, signaling a potential shift in momentum from bullish to bearish.
📌 Trade Setup
Entry Zone: Between $20.22 – $20.06
Price is currently trading in this zone, presenting a potential short entry opportunity following the channel breakdown.
Stop Loss: $21.77
Placed above the previous resistance zone and the broken channel. If the price reclaims this level, the bearish thesis is invalidated.
Final Target: $17.70
This level represents a key support zone from previous price action and aligns with potential measured move from the channel breakdown.
✅ Why This Setup?
Channel Breakdown
A break below a well-defined channel often marks a change in trend. This gives a high-probability setup for trend reversal traders.
Bearish Momentum Confirmation
After the breakdown, price failed to reclaim the channel, and is now trading below the prior support, flipping it into resistance.
Risk/Reward Ratio
This setup offers an excellent R:R ratio, with downside potential toward $17.70 and a relatively tight stop just above the failed structure.
Market Structure Alignment
Lower highs and lower lows now appear to be forming post-breakdown, further confirming a potential bearish move ahead.
📉 Bias: Short
📈 Invalidation: Break and close above $21.77
🎯 Target: $17.70
🧠 Disclaimer: This is not financial advice. Always do your own research and manage your risk accordingly. Trade safe!

COINBASE: 3rd Bollinger Squeeze is a pullback buy signalCoinbase is bullish on its 1D technical outlook (RSI = 65.834, MACD = 21.140, ADX = 19.909) as it is extending the bullish wave following the S1 rebound. The Bollindger Bands are now expriencing a squeeze, which is the 3rd since the bottom. The 2024 bullish wave also had three Bollinger Squeezes with the 3rd being the last that made the 349.50 High but not before a pullback to the Bollinger bottom. If that takes place, it will be a signal to go even stronger on the bullish side and target the R1 level (TP = 348.50).
## If you like our free content follow our profile to get more daily ideas. ##
## Comments and likes are greatly appreciated. ##

Electronic Arts: Heading LowerElectronic Arts has dropped roughly 13% since our last update, continuing the expected decline within ongoing wave (3). This move is likely to break below support at $114.60 and gradually push the stock downward to the anticipated low. Our alternative scenario suggests the correction may already be done, but that path hinges on a convincing move above $169.82 — a threshold we’re not close to yet. For now, the downtrend remains in control.
📈 Over 190 precise analyses, clear entry points, and defined Target Zones - that's what we do.

Palantir Technologies (PLTR) Shares Pull Back from Another HighPalantir Technologies (PLTR) Shares Pull Back from Another High
Shares in Palantir Technologies (PLTR), a company specialising in big data analytics software, have seen phenomenal growth in 2024, surging by approximately 340%, making it the top performer in the S&P 500 (US SPX 500 mini on FXOpen). This exceptional performance was driven by booming demand for artificial intelligence (AI) and machine learning technologies, which underpin Palantir’s products. The company has demonstrated steady growth in revenue and profitability, attracting major new clients across both the commercial and government sectors.
In 2025, PLTR remains among the market leaders, with its share price up roughly 60% year-to-date. In mid-May, it hit a fresh record high on the back of a strong fundamental backdrop. That backdrop was bolstered yesterday by news that the Pentagon had increased funding for its Maven Smart System programme — which involves deploying AI on the battlefield — to $1.3 billion through to 2029.
However, this news did not result in a new high. In fact, this week, PLTR stock have underperformed the broader stock market — and this may be explained by technical analysis.
Technical Analysis of the PLTR Chart
The interplay of supply and demand in 2025 has formed a broad ascending channel, characterised by:
→ The price breaking above the upper boundary in February following a strong earnings report, and dipping below the lower boundary in response to Donald Trump’s announcement of new international trade tariffs.
→ In mid-May (as shown by the arrow), the median line acted as support. However, after reaching the upper boundary, bullish momentum faded. As a result, the PLTR price has failed to hold recent highs and has fallen back below $130 — with market participants seemingly viewing the stock as overvalued, evidenced by false breakouts above previous peaks.
Given the above, it is reasonable to assume that PLTR may undergo a deeper pullback — potentially towards the median of the channel or even its lower boundary.
This article represents the opinion of the Companies operating under the FXOpen brand only. It is not to be construed as an offer, solicitation, or recommendation with respect to products and services provided by the Companies operating under the FXOpen brand, nor is it to be considered financial advice.

CHAMBLEFERT IDEAChamblfert looks like at a good demand zone. Expecting good one time bounce from this area and one green candle after long rail of back to back red candles.

Core Scientific (CORZ) – Mining Bitcoin to Powering AICompany Snapshot:
Core Scientific NASDAQ:CORZ is evolving from a crypto miner into a high-density colocation provider, strategically pivoting into the explosive AI infrastructure space.
Key Catalysts:
Strategic Shift to AI Infrastructure 🧠📡
$1.2B agreement with CoreWeave expands AI compute colocation footprint
Signals institutional validation of CORZ’s infrastructure capabilities
Massive Power Footprint ⚡
1,300 MW capacity across North America
Ideal for power-hungry AI training and inference workloads
AI & HPC Market Tailwinds 🚀
AI infrastructure demand is surging; CORZ is positioned as a first-mover
Colocation demand outpacing supply = pricing power & revenue upside
Transformation Narrative 📈
Transitioning from volatile crypto dependence to stable, high-margin AI hosting
Increased diversification and enterprise appeal
Investment Outlook:
✅ Bullish Above: $8.75–$9.00
🚀 Upside Target: $15.00–$16.00
📈 Growth Drivers: Strategic AI pivot, large-scale power assets, and long-term demand for compute
💡 Core Scientific – No longer just mining blocks, now powering breakthroughs. #CORZ #AIInfrastructure #DigitalTransformation

Apple (AAPL) share price slips towards psychological $200 levelApple (AAPL) share price slips towards psychological $200 level
Yesterday, Apple shares (AAPL) fell by 2.5%, edging closer to the key psychological threshold of $200. Moreover, the stock is underperforming the broader market, which reached new highs earlier this week — a move AAPL has yet to replicate.
Why is AAPL’s stock price declining?
According to media reports, investors may have grown concerned after OpenAI acquired a startup founded by Jony Ive, Apple’s former chief designer, for $6.5 billion.
The move is being interpreted as OpenAI’s first step toward launching a physical AI-powered device — one that could, eventually, pose a challenge to Apple’s hardware, even if not in the near term.
Technical analysis of the AAPL chart
Bulls may be hoping the AAPL price finds support at the confluence of two key levels:
→ the psychological $200 mark;
→ support from the second half of May (the lower blue trendline).
However, the broader technical context raises some bearish concerns:
→ the $215–222 zone, which previously acted as support, is now capping price advances (as highlighted by the arrows);
→ the red descending channel appears to define the current trend trajectory — and its relevance may be reinforced if the price drops and consolidates near its median line, signalling a balance between buying and selling pressure.
This article represents the opinion of the Companies operating under the FXOpen brand only. It is not to be construed as an offer, solicitation, or recommendation with respect to products and services provided by the Companies operating under the FXOpen brand, nor is it to be considered financial advice.

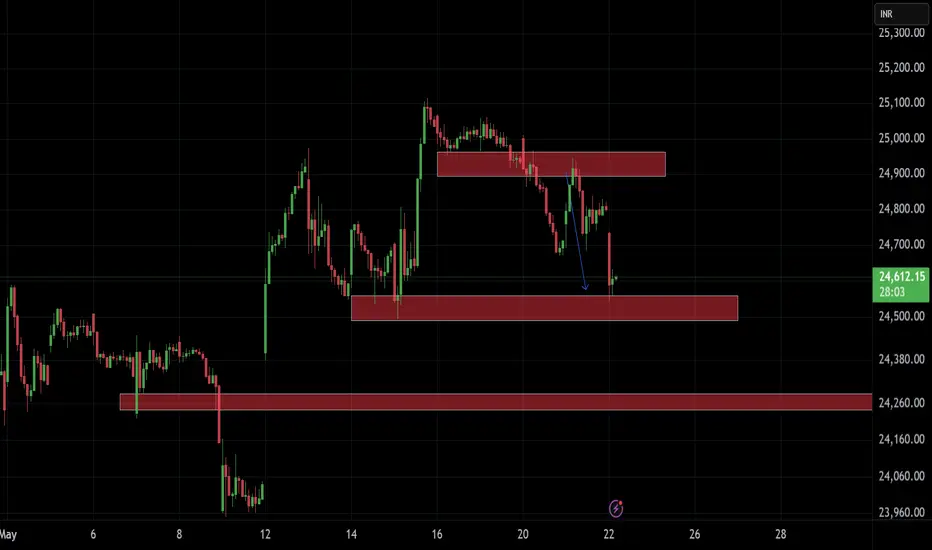
NIFTYI see these levels on Nifty. Forgot to paste the good shorting trade opportunity yesterday, however shared 2 charts with analysis of gift nifty which hinted short for market from past 2 days. Don't go into patterns and take early trades trade only when levels break or sustain.
PLTR WAIT FOR THE CRACK!The double top is complemented with a bearish rising wedge stuck in a rising bearish F flag.
A straightforward, short setup if you wait for the CRACK!

TESLA: Can it worth $4,000 a share buy end of 2026?Tesla is bullish on its 1D technical outlook (RSI = 65.527, MACD = 22.160, ADX = 43.922, being on a bullish wave to recover the ATH. Since the 2019 low the prevailing long term pattern is a Channel Up and the recent Feb-March correction resembles COVID's in March 2020. If that's the case then the stock is on a powerful long term bullish wave that can reach the 4.5 Fibonacci extension before the 5.0 time Fib. This implies that TSLA price per share can be $4,000 by the end of 2026. Do you think that's realistic?
See how our prior idea has worked out:
## If you like our free content follow our profile to get more daily ideas. ##
## Comments and likes are greatly appreciated. ##

Nasdaq’s Next Move Revealed This Week – Don’t Miss the Breakout Following a strong surge at the start of the trading week, the Nasdaq reached a new high since March 26th. At this juncture, I anticipate a potential pullback before any sustained upward movement. My analysis suggests monitoring for a retracement to the New Week Opening Gap (NWOG), where price action will likely provide critical insights. I see two probable scenarios:
1. A move to the NWOG, followed by a strong bounce, potentially targeting a new all-time high, as some market commentators have suggested.
2. A weak reaction at the NWOG, leading to a breakdown below this level, with 16,000 as the next key support target.
This week's price action will be pivotal in determining the Nasdaq's near-term direction. I recommend close observation of these levels and disciplined risk management when positioning for either outcome.

UnitedHealth (UNH) Share Price ReboundsUnitedHealth (UNH) Share Price Rebounds
A month ago, in our analysis of the UNH chart, we:
→ highlighted that UnitedHealth shares had lost nearly 23% in value;
→ drew a descending channel and suggested that bearish pressure could continue, threatening the support level around $450, which had held since early 2022.
Since then, UNH’s stock price decisively broke below that level (as marked by the arrow), falling to around $250 — its lowest point since spring 2020 — before staging a sharp rebound. This steep price movement was driven by a series of fundamental developments, including:
→ the resignation of the CEO and news of a Department of Justice investigation into potential Medicare fraud;
→ UnitedHealth withdrawing its earnings guidance for the coming year;
→ political debates over the Medicaid programme as part of the 2025 budget negotiations;
→ President Trump’s directive to cut prescription drug prices.
Recent news that the new CEO and several top executives have bought tens of millions of dollars’ worth of UNH shares appears to have renewed investor confidence — the share price rose above the $300 mark yesterday.
Technical Analysis of UNH Share Chart
These latest developments justify an update to the descending channel configuration. Of particular note is the gradual decline with limited volatility — a sign that the price is moving along the channel's median line (highlighted on the chart).
In this setup:
→ the bounce from the $250 level points to the lower boundary of the channel;
→ traders may consider a scenario where the current recovery pushes UnitedHealth stock towards the median, after which supply pressure may return and offset the recent dominance of demand.
It’s also possible that the key psychological level of $300 could now act as support.
This article represents the opinion of the Companies operating under the FXOpen brand only. It is not to be construed as an offer, solicitation, or recommendation with respect to products and services provided by the Companies operating under the FXOpen brand, nor is it to be considered financial advice.

NIFTY!Selling started at supply zone discussed in earlier chart analysis of gift nifty. Same has been applied to Nifty and overall market.

4H FVG level is indicating a strong bullish sentiment.Market Analysis – Gold (XAU/USD)
Gold is currently trading within a bullish Fair Value Gap (FVG) on the 4-hour timeframe, accompanied by notable volume activity. Just below this zone lies a weekly FVG, and multiple other FVG and Breaker Block (BPR) formations have emerged in the same region. The price action around the 4H FVG level is indicating a strong bullish sentiment.
However, on the 1-hour chart, the market has recently formed a bearish FVG in the 3214–3220 range. If the price breaks above this level with strength, the bullish momentum could potentially drive the market toward the following upside targets: 3233, 3240, 3250, and 3260.
Let’s monitor closely and remember: Do Your Own Research (DYOR).

$LMT began scaling the world’s most expensive weapons programLockheed Martin began scaling the world’s most expensive weapons program back in 2013. A nice match with Palantir? Isn't it? ;)
Since 2013, NYSE:LMT has been on a long-term upward trajectory - marked by consistent higher lows and major consolidation zones.
But here’s what most people don’t ask:
Why 2013? Why then?
The Real Catalyst: F-35 Lightning II
That single event? It triggered:
→ Full-rate production across the U.S. and allied nations
→ Huge visibility into long-term defense revenues
→ Global adoption (UK, Israel, Japan, Australia…)
Look closely at the chart and you’ll see:
→ Key support zones (red lines) from $430–$450
→ Massive consolidation in 2017–2020 and again 2022–2024
→ A textbook bullish structure on the weekly time frame
Price is sitting at ~$469. If this support holds… we may be at the start of the next leg up.
This wasn’t just a product launch. It was a multi-decade defense bet. And it paid off.
Post-2011 U.S. defense budgets started climbing again.
And where did that money go?
→ Aerospace
→ Missile defense
→ Cybersecurity
All categories where Lockheed Martin dominates.
Major wins that anchored the trend
From 2013 to today:
→ Multi-billion dollar Pentagon F-35 contracts (Lot 6 to Lot 17 — $18B in 2023 alone)
→ International THAAD defense system deals
→ Long range hypersonic weapon delivery
→ Space wins via NASA’s Artemis program
Each of these was a fundamental “trust” signal to the market.

Analysing the Spike in Volatility on the Walmart (WMT) ChartAnalysing the Spike in Volatility on the Walmart (WMT) Share Price Chart
On Thursday, the US retail giant reported its quarterly results — which turned out to be broadly better than expected. While total revenue was roughly in line with analysts’ forecasts, earnings per share came in higher at $0.61 versus the expected $0.57.
At the same time, Walmart CEO Doug McMillon stated on Thursday:
"We will do everything we can to keep our prices as low as possible. But given the scale of the tariffs, even at reduced levels, we won't be able to absorb all the pressure, considering the reality of tight retail margins."
This statement may have raised concerns among market participants about the company’s future earnings, contributing to Friday’s drop in the share price to $92.
It also drew the attention of the US President. On Saturday, Donald Trump said that Walmart (WMT) should “swallow the tariffs” instead of blaming them and raising prices.
In response, Walmart reiterated that it will keep prices as low as possible for as long as it can — which has always been the company’s approach.
Technical Analysis of the WMT Stock Price Chart
Looking at the broader market context, we can see that price fluctuations formed a narrowing triangle in late April — a sign that buyers and sellers had reached some agreement around a fair value of approximately $95.50.
In early May, sentiment shifted in favour of the bulls, with this level acting as support (marked by an arrow).
The earnings release triggered a spike in volatility — the ATR indicator is now at a one-month high. The Walmart stock price extremes seen at the end of last week suggest two key levels, roughly equidistant from the $95.50 axis:
→ resistance around $99 (reinforced by the psychological level of $100);
→ support around $92.
Given the above, it is reasonable to suggest that once the market has digested the news, price movements may calm down again. In that case, we may well see another narrowing triangle form on the WMT chart — slightly above the previous one.
This article represents the opinion of the Companies operating under the FXOpen brand only. It is not to be construed as an offer, solicitation, or recommendation with respect to products and services provided by the Companies operating under the FXOpen brand, nor is it to be considered financial advice.

NIFTY!Gift nifty at supply area which means a selling could start or slow buying could persist. Although stocks are showing good momentum, i will keep a cautious watch all over.

Netflix - The bulls just never stop!Netflix - NASDAQ:NFLX - is insanely bullish now:
(click chart above to see the in depth analysis👆🏻)
The entire stock market basically collapsed during April. Meanwhile, Netflix is creating new all time highs with a +20% parabolic bullish candle. Looking at the chart, this strength is very likely to continue even more until Netflix will (again) retest the upper resistance trendline.
Levels to watch: $1.400
Keep your long term vision!
Philip (BasicTrading)

COCA-COLA: This is a +43% wave, aiming at $82.Coca-Cola is about to turn bullish on its 1D technical outlook (RSI = 53.500, MACD = -0.130, ADX = 31.368), trading on a flat 1M candle, coming off another flat candle before it (April). This neutrality has historically been a re accumulation period for the stock. Given that its most recent low was on the 0.382 of its multi year Channel Up and the rebound took place on the 1M MA50, we expect at least a +43.22% rise from there. On this pattern, all rallies that started on the 1M MA50, grew by at least +43.22% and touched the 0.786 Fibonacci level of the Channel. Our TP = 82.00 and we expect to get there by the end of the year.
## If you like our free content follow our profile to get more daily ideas. ##
## Comments and likes are greatly appreciated. ##
