Elon Can Suck a Phat One Because Richard Branson Is KingChart is self-explanatory. Elon and SpaceX don't have shit on Virgin Galactic
Stonks

Palantir Head & Shoulders - Hype Poof - #cashexit NOWAnother pandemic era hopium stonk. Sell now & stay away. Don't be a reddit lemming.

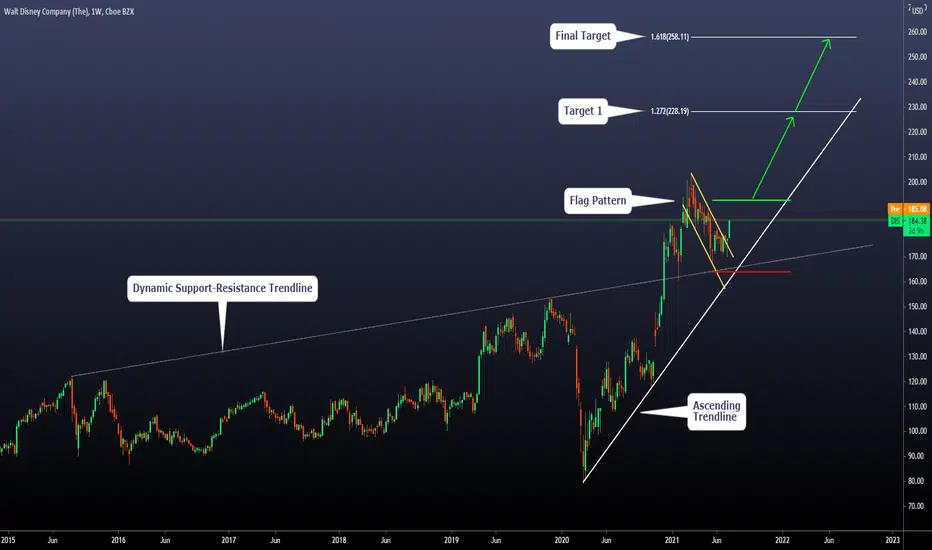
Breakout on DIS after 120 days inside a Flag PatternToday we will speak about DIS; what are we observing right now?
a) The price has been on a Flag Patter for almost 120 days. Yesterday we observed a major breakout of it, and now we have defined confirmation levels for the bullish movement
b) Let's speak about the context first:
-The price is above a dynamic support resistance zone (positive for the bullish move)
-The Price is above the current ascending trendline (positive for the bullish move)
-We have observed a clear Weekly flag pattern above all the two areas, and now we have the breakout of it
c) Relevant levels: If the price reaches the Green horizontal line, we will consider that as a confirmation for our bullish view. If not, we will not execute the setup. Our stop level and also invalidation level (in case the price never executes our setup) is the red horizontal line (below the flag pattern)
d) We have defined two targets using fibo extensions. The first one can be used as a protective area where we move our stop loss to the entry-level or also as a preliminary take-profit zone. However, our final target is the 2nd fibo extension, where we will close all the setup if the expected movement happens.
e) How long can the setup take?: If the movement is successful, we think the resolution can be between 150 and 250 days.
f) How much would you risk on a setup like this?: ALWAYS 1% to 2% of our capital, Never more than that.
Thanks for reading!
New Highs for Stocks!!Stocks have squeezed out new highs at 4389, which we are identifying as a new technical level. They are maintaining a narrow range between this and 4380. The bull momentum here is very strong as measured by the Kovach OBV. We will have strong support from former highs at 4364, should we face a retracement. The levels 4327 and 4306 will provide further support if needed. Our next target is 4408, which could be hit today if momentum continues

Bullish Filters for NIO Today we will analyze the current scenario on NIO, and we will define what we consider can be a high-quality scenario in case we observe the following structure (confirmation idea). Please, it's important to understand that we are not saying "that will happen." Our trading approach is defining trading scenarios in advance and only trade if those happen.
Let's start:
a) The price has been moving around the broken ascending trendline. Can the price go above again? That would be key for the bullish perspective
b) Ok, what's next? If the price manages to go above the ascending trendline again, we want to see a breakout of the descending trendline (yellow line). There the price reacted and has been falling a 20%
c) So, what would be the perfect bullish scenario for us? A breakout of the yellow descending trendline followed by an ABC or ABCDE pattern above or in the edge. IF that happens, we think that a breakout above B would be a great confirmation for new highs. However, we should pay attention to the previous ATH.
We hope this was useful to create zones and trading plans. Remember, Risk Management is more important than any analysis or trade.

Stocks Ranging Near HighsThe S&P has squeezed out new highs at 4375, coming within a few points of our target of 4380. We are currently at 4354, just above one of our technical support levels of 4350 (once a profit target). The Kovach OBV was pretty strong but has tapered with this retracement. Thus it is likely for stocks to range a bit at current levels in a sideways correction before gearing up for a run at highs again. If not, 4380 is still our target and will provide resistance. From below, 4327 and 4306 will provide support

Possible Long Position ASP!!ASX:ASP
SELF DEVELOPMENT/METHODOLOGY/PSYCHOLOGY
SMP Strategy
Market Direction: Long Position
Chart time frame - Daily
Timeframe - 30 days
A – Activating Event
Market will meet support in zone @ current levels - ... . In order to enter into this trade, the pair MUST be in line with my Entry Procedure....
B – Beliefs
Market will move towards the first Target 1 level @ 0.046
C - Fundamentals that may affect the pair
N/A
D - Trade Management
Entered @ .....
Stop Loss @ .....
Trailing Stop Loss@.....
Target 1 @ 0.046
Target 2 @ ....
Risk/Reward @ 1.6.5
Happy trading :)
Follow your Trading plan, Remain disciplined and Keep learning !!
Please Follow, Like,Comment & Follow :)
This information is not a recommendation to buy or sell. It is to be used for educational purposes only!

REG Correlation buyEarlier this year Japara health care (JHC, bottom chart) had a take over bid, pushing the stock to higher prices, outperforming REG. The stock is typically highly correlated, and with the deviation from the mean I'm looking for a return back to the mean. I will be going long REG and potentially taking a short on JHC for a reversion.

Stocks Find Support!!The S&P 500 has found good support at 4293. It barely broke into the 4200 handle before catching a nice burst of momentum that sent us rallying to near highs again. We were anticipating perhaps another bear wave taking us back to more auspicious levels at 4272 or 4245. This still could be the case, but as of now, it appears that a sideways correction is more likely. That is, stocks are set to range in the neighborhood of 4293 and highs at 4364, which we have identified as a new technical level. The Kovach OBV is still quite strong, stuttering only briefly with the selloff so this should be but a brief setback for stocks.


Correction in Stocks!!We are finally seeing our correction in stocks. The tiny retracement we saw on the 6th was paltry and we knew we should be seeing something more significant. The S&P fell to one of our support levels at 4298, but still could have more in the tank. We anticipate good support at 4272 or even 4245. This is a healthy correction for stocks, and we are still in 'bull mode'. The Kovach OBV is still very strong, dipping only slightly to reflect the correction. The Kovach Chande indicator is starting to round off, suggesting we may be bottoming out soon.

Stocks Slip, Get Bought Back!!Stocks sold off a bit from highs only to get swiftly bought back up again. We found support at 4327, but quickly bounced. We have been anticipating a more significant retracement, perhaps down to 4272 or 4245. If the S&P regains momentum, then we should hit our next target at 4380 perhaps today. Broadly, the Kovach OBV is extremely strong, but has leveled off a bit reflecting stock's ranging at highs.

Current view on JMIA. Relevant levels and structuresToday, we will speak about JMIA.
Let's check the main items we can see on the chart.
a) The price has broken a huge descending Wedge pattern
b) As usual, after the breakout of this type of structure, we can observe a retest or consolidation close to it.
c) In this case, we are observing a consolidation between 34.00 and 27.00. It's possible to observe a new local low on that range or a range between the specified price levels
d) However, the most important level we are observing right now is the activation one. (Green horizontal line at 34.80)
e) If the price reaches it, we expect a continuation of the bullish movement towards the next resistance zone at 48.00
f) Pay attention to the horizontal yellow line as a possible inner resistance zone
g) If the activation level is reached, we expect a resolution between 20 to 40 days
h) Of course that if the price keeps falling, we will cancel our view. Also, if the idea is activated, our invalidation level is below the consolidation structure.
Thanks for reading!

Stocks Ranging at HighsStocks have achieved another highs and have hit our profit target of 4352 on Friday. They've ranged at that level due to the Holiday in the US for the Fourth of July weekend. We are clearly establishing value at current levels but we have a very narrow range suggesting we could break out soon. If stocks have enough momentum to continue the rally, our next target is 4380. If not, we have levels of support below at 4327 and 4306. We keep saying we are due for a healthy correction at possibly a 50% retracement of the channel at 4272 or so, but the trend is clearly bullish for now

Red FlagsRed Flag #1: Insiders dumping a decent size of their positions.
Red Flag #2 : Daily chart looks VERY Bearish. 1 Reversal chart pattern, 2 Indicators.
Red Flag #3 : We’ll see (:

Stocks Hit Profit Target!! 🤑🤑Stocks have hit the next profit target at 4327. We seem to be forming a bull channel, and will eventually correct to the down side, with 4293 and 4272 being potential points of support. The Kovach OBV is very strong, but we are facing resistance from our profit target at 4327. If we see another breakout, our next target is 4350.

Stocks Forming Bull ChannelStocks keep edging out new highs. Our 'rounding off' behavior appears to be shifting into more of a bull channel type pattern. When these break down it is common to see a 50% retracement. But the Kovach OBV is still solidly bullish confirming the trend. The Chande, on the other hand has dipped sharply reflecting the potential rejection of our profit target of 4306. This is further confirmed by a red triangle on the KRI. The next target will be 4327. We maintain that stocks are due for a healthy retracement, potentially bringing us back to 4272.

Plug Power back on the trend linePLUG is a long term play, tesla hedge (10 Years)
As long as PLUG is on this trend I will continue to dollar cost average daily
- for beginners this literally means start off slow on cashapp with $10/day
- for advance traders DCAing at levels you feel comfortable buying and buying BIG #getwrecked
If it dips below the parallel stop DCA and find another trade u might want to participate in
IF it rises above feel free to take profit and buy other assets or go on amazon and treat yo self
trading is about YOU and not your personal life finance
communities make it about the community
never feel ashamed to profit off a great trade
people that bully are those that have lost and have broken their own rules time and time again
#notonmighwatch

Stocks Losing Steam??Stocks have extended gains yet again, coming just shy of our target of 4306, before pulling back ever so slightly. This is nowhere near the retracement we were expecting but it does validate our assertion that stocks are 'rounding off', potentially in preparation for a further selloff. Watch for support at 4272, and 4245. The Kovach OBV is still strong however, and no one can deny the bull trend, so watch for momentum at open to determine if we have the strength to break past 4293 to our target of 4306.

DBX clear way towards $34.00Today, we will share our view on DBX
The main two key items we were paying attention was the first resistance zone and the ABC pattern on the edge of it.
From there, we defined the next target based on previous situations, and 34.00 was the place where we saw clear rejections.
Now we can think about the shape of the ascending movement, and we can use the cloned channels as guidelines for it.
From current levels, we expect a resolution of this movement between 70 to 120 days.
Thanks for reading!

Stocks Rounding OffStocks keep creeping up and have hit our profit target of 4293. We are seeing the price action 'round off' suggesting a retracement is to come soon. Typically these arching patterns precede selloffs. The Kovach OBV was strong but has curved over as well. There is no doubt stocks are in bull mode right now but it appears that they are ready to let off the gas for a bit. The levels 4272 or 4245 will provide support. If we are wrong and the S&P gets another burst of momentum, then 4306 is our next target.


Correction for Stocks??The price action for stocks is rounding off. We are seeing less and less momentum, and the Kovach OBV is still strong but tapering as well. When the S&P is rallying at a decreasing pace, it typically heralds a correction. There is no doubt the overall trend is bullish, but buying now would be FOMO. Levels from below like 4245, or 4228 would be enticing levels to buy back. If we are able to muster enough momentum to breakout then 4293 is the next target.
