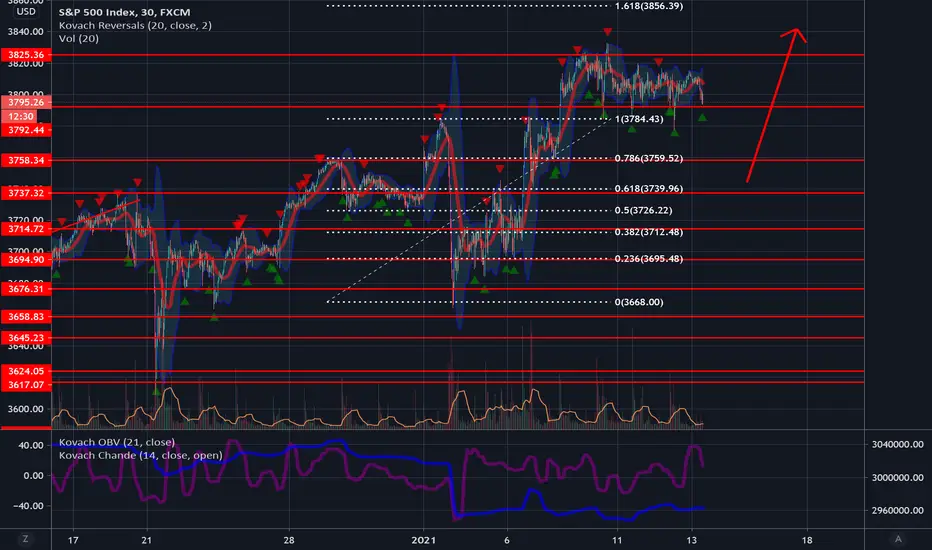
Stocks Reject Highs. What's Next?As we told you yesterday in the reports, stocks retraced to 3825. This is a strong level of support. Both Kovach Momentum indicators are solidly bearish, leading us to think the pendulum may swing back soon. Additionally there is a cluster of green triangles on the Kovach Reversals indicating that we are seeing some candlestick reversal patterns. If we do see a bounce, the S&P will likely feel out the range between 3825 and 3867. If we are wrong watch for 3811, 3800, and 3792 to provide support.
Stonks

A Bullish breakout means a 15% upside potential / ABTToday, we will take a look at ABBOTT laboratories.
- From a technical perspective, the price is above an ascending channel
- Since August 2020, we observed a 150 days consolidation
- We can now see an ascending triangle, which is considered a continuation pattern once the flat line is broken.
- IF we have a clear breakout, we expect a bullish movement towards 132
- ABBOTT is an extremely bullish stock that has been performing really well (+80% in 2020)
- We will consider that the setup is no longer valid if the price goes below 99USD per share

Stonks Make New Highs!! What's Next??As you all are undoubtedly aware, stocks made new highs yesterday. They met resistance exactly at 3856, the level we called out for weeks. Finally they inched past this level to 3867, where they are currently facing resistance. Almost certainly they will break out higher. They could range to feel out this new price territory first, however, so don't get too excited. The S&P is at highs, so jumping into a long trade would definitely be FOMO. It is certainly possible that we could retrace to 3825. The Kovach OBV is very strong, so we are in buy on dip mode. Nested Fibonacci levels give us a price target of 3887, and then 3935.

S&P Bull Wedge Forming?Stocks bounced pretty hard off lower levels, but are still having issues making new highs. The level 3758 provided support as we said it would. We blasted through the next level 3792, which provided little resistance. It will provide support now. We should expect more resistance at all time highs. It will take a lot of momentum to break through and establish new highs. However we do appear to be in the midst of forming a bull wedge pattern, so chances are stocks are bottling up for a breakout. Consider dips as buying opportunities to accumulate a position before the breakout. The next target is 3856.

S&P Ranging Before InaugurationThe S&P 500 has rejected highs. We have been calling this out for weeks. We appear to have a double top as well at 3825. It did find support at 3758, which is a technical and Fibonacci level, and now is finding support from 3793. The Kovach OBV does seem to be edging up, but nothing to suggest a breakout today. It could go either way at this point: to retest highs or lower levels 3758 or 3737. But don't anticipate too much action in stocks until after the inauguration tomorrow.

ASX:SYR ready to play in the bullish club? 🧨🚨😀🚨ASX:SYR, has lost the enthusiasm of investors since the plunge from the 6$ levels. Everyone was thinking it is a dying stock. It dropped to the abyss towards 0.150$ during the Covid crash in March 2020. But is it time to reboot this dinosaur and prepare the entry for a multi-bagger potential speculation? Lets dive deep and analyze.
ASX:SYR has not been on my radars for quite a while as it was in a clear downtrend, but for the last 9 months, it seems to prepare for a well known bullish structure. that is none other than the Cup and Handle structure. This structure is inherently bullish and I am waiting to see it playing out before I open any long term position on this stock.
With current situation, this Cup and Handle would be playing out if the price was to break the 1.30$ levels but remember this can only be confirmed if the breakout volume is good enough and if the price stays above the 1.3$ levels.
For now, I am keeping this stock on my observation list and see what it does in next few weeks. From other Indicators point of view:
Weekly PSAR says we are in a bull trend. We are above 21 Weekly EMA, which is a good sign as well. RSI is in overbought territory which worries me a little bit. The stock is near its 52 weeks high this a sign of strength. This stock is over 140% above its 200MA this is over extended and entering requires to be very careful and play well with the SL.
I will keep an eye on this stock and will update you when I find anything interesting or if the structure is invalidated.
Lately I have not been sharing charts and some of you asked me what happened but I am gathering great structure that potentially can lead to juicy profits. Also I am waiting to see the clear direction of the major indexes as of now we seem to be in a choppy zone and that is not a great place to be trading. it is a place to strategize.
Stay safe and if you like this TA, smash the likes and share it with your friends.
XTF

EUR/USD Weekly Review 1/15/20Please see my old post for context. We have confirmed a structure break and it will be interesting to see if this down move picks up steam or retraces the next week.
What I got WRONG:I anticipated more bids around 1.21 and below.
What I got RIGHT: Bearish sentiment and confirmed down trend
On the news front next week is busy, especially the later half. As I mentioned earlier it appears politics, for better/worst is driving volatility. I'll revisit this idea later this weekend


S&P Breakout or S&P Retrace??Stocks dipped, but nowhere near to the extent we were anticipating. A 'healthy' correction would put us at 3758 or 3737. All we got was 3792. We still anticipate stocks to break out to achieve new highs sometime soon, perhaps even today. Though we are below 3792 at this point and this will provide resistance. The Kovach OBV is inching up, suggesting that we should prepare for a breakout. However the S&P may have one final squeeze left in store for us, so it would be wise to be patient and wait for a better dip.

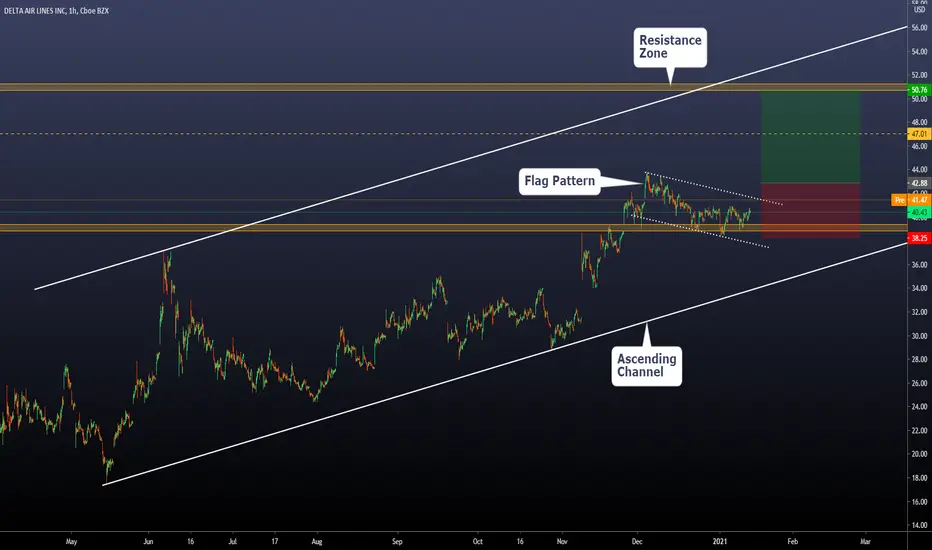
Flag Pattern on Delta Airlines - Bullish breakout expectedToday we will make a Daily and a 1h analysis on Delta + the setup we will take on this asset.
Daily Chart:
On the daily chart, we can see a Clear support zone and a resistance zone. The price is above the support zone, and we can project a bullish movement towards the next zone (Resistance)
On the 4hs chart, we will understand the setup:
Here we can see a Flag Pattern above the support zone.
Flag Patterns are considered continuation structures. That means that if we have a breakout of it, we can expect a continuation of the previous trend.
Our entry-level is a stop order at 42.88 / Stop level is at 38.25 / Break-even level is at 47.01 / Take profit at 50.76
The risk-reward ratio on this setup is 1.7, and we expect a resolution of 30 days.
If the price goes below the stop level without executing the setup, we will consider that the view is no longer valid.
Thanks for reading!
New All Time Highs for Stocks??The S&P dipped, but not nearly as much as we anticipated. It is still holding the range 3792 to 3825. This is a very narrow range for stocks and we anticipate a breakout today either way. A breakout to the downside seems a lot more likely, since the Kovach OBV is not registering much momentum. If so, consider 3758 or even 3737 to buy back. However, it is hugging the upper bound of the range, which could suggest a breakout especially if we see momentum pick up toward open. If that happens, 3856 is our next target.

When will Stocks Make ATH's Again??Stocks are ranging at highs. We do anticipate another run for ATH's soon, but it is highly likely we will see a retracement first. The levels 3758 and 3737 are great levels of support. The Kovach OBV has flat-lined, which suggests that momentum has run out. This is not a very good sign especially at highs. The S&P is stretched like a rubber band and will snap back unless we see some pressure somehow come through today.
PTON on the way to $200Great chat to take a look at today "PTON"
-We can see the ascending trendline and the Support resistance zone as the two key elements to understand this chart
The Ascending trendline represents the asset's long-term bullish trend, and we can see how the price is accelerating and taking distance from it.
-The Support Resistance zone was the previous level in which a huge corrective structure was formed (ABC pattern)
-After the breakout of it and a bullish impulse, we saw a corrective structure (smaller ABC pattern) finding support on the previous zone
-Now we had a breakout of the small structure, and we expect a continuation of the bullish movement towards 184.86 (First target in which we will move our stop loss to break-even) and then to the final target 205.5, where we will close our long setup
-The setup we developed was Entry above "B" and Stop below "C" (of the small corrective structure) / Break-Even and Take profit were explained on the previous items

Stocks Pausing Before New HighsStocks are ranging at highs, caught between all time highs, a technical level at 3825, and the nearest Fibonacci level, 3784. We are seeing some consolidation here as stocks find footing. Our target still remains 3856. Beware of some retracement first, even a 50% retracement would still be considered bullish. That would put us at 3726. There are several levels of support before that. The Kovach OBV is a bit flaccid, indicating that there may not be as much momentum to this rally as we'd like.

Best S&P 500 Trading IdeasStocks are ranging at highs. There is a divergence between the price action and the Kovach OBV. This suggests that the momentum just isnt there and a correction may be in store. We should see some support at 3759, a technical and Fibonacci level. Also 3739 and 3695 should provide major support. The next target after current highs is 3856, a Fibonacci extension level

Understanding how to trade Pennant patterns / Real exampleToday we will show you the theory behind Pennant patterns and apply them to a real example.
CONTINUATION PATTERNS: Ralph Nelson Elliott (who created the Elliott Wave Theory) discovered that there are 4 types of patterns that the resolution of them tend to be in the same direction of the previous impulse once the correction is finished and we have a breakout.
-TRIANGLES
-IRREGULARS
-ZIG-ZAGS
-FLATS
Today we will learn about pennant patterns, which are a type of triangle. Pennant Patterns are made by 5 waves (abcde); you can draw that using the tools you have on trading view on "Patterns."
In general terms, you will be able to draw two converging lines, and the price will start compressing there. It's important to know which is the previous impulse of the pattern to draw the Fibo Extension using that previous impulse. The Fibo Extension will allow you to define targets and are extremely useful when you are at ATH because you can't rely on previous technical movements to define supports or resistances.
HOW TO TRADE THEM?
Entry-level: Always above/below B depending on the direction you are trading. In this case with AMZN, our confirmation level is above B
Stop Level: Always above/below A depending on the direction, you are trading. The easiest way to define your stop level is by setting it above/below the whole structure.
Break-Even level: If the price starts going in the expected direction, you can move your stop loss to your entry-level, once the price reaches the First Fibo Extension
Target: Use the last Fibo extension level. Your minimum risk rewards ratio should always be 1.5, never less than that.
Thanks for reading!
