TLRY Swing Idea, LongPlease note I am using the logarithmic scale for these charts.
TLRY was in a clear downtrend for 78 weeks, and has since been consolidating for 34 weeks. with highs of $300, and a current price of 7.40, this thing has huge potential for a large bounce. on the 1W chart, we have been essentially range bound since the highs and have recently broken above.
Trade Idea:
I will be position trading.
Buying throughout the trading session on NOV 13th, so long as $7 to $6.70 holds intraday.
SL if price breaks back into the long term range and breaks below the current higher low on the 4h chart, around 5.35
PT above 10 selling bits and pieces on the way up. Could see this retesting $25 and even $50
Stonksonlygoup


Shutter Support Signal$SPY only go up from here, right? Can't go much lower with this many support lines. Am I right?

6 Corrective Structures on ROKU. What can we learn?Today we bring a post about finding a similar situation to the current one in the past. Why is this useful? Because if we understand the resolution of a pattern that has already happened several times before, we can start using them to know what we want to wait for before trading.
We are using a Logharitmic chart so we can see the same proportions of % bullish and bearish movements despite the nominal movement.
What are the conclusions we have based on this?
-We have 5 examples of situations where the price dropped between 25 - 40 days with durations between 28 - 60 days.
- 3 of them provided bullish resolutions with great % gains after the breakout, 2 of them provided fake signals
-If we create adequate filters, we can avoid at least one of the fake outs (like waiting for the breakout of the more external trendline of the correction and then looking for a small throwback on a lower timeframe)
-The rawest scenario is one in which you trade all of these structures without waiting for confirmations. Using that idea, even if you had 2 stops, you could manage to take profits on the 3 scenarios with at least a 1:2 Risk Reward Ratio. Imagine developing setups with much more accuracy.
We hope this type of information can help you develop your own study cases on this type of asset to project resolutions to what is happening right now. Thanks!

GME UnwindGME Signaling Potential Trend Change, new bear channel in play, see if price takes it. Entry trade at arrow, target exit marked in (X), will exit if/when price breaks bear channel.


AMC buys, expecting HIGH impact from wallstreetbets Tp 50$So far AMC has shown a crazy journey, but don't expect the end soon since this is only the beginning.
I'm considering AMC to go till 50$.

Dogecoin/usd buys till 1$ for nowBuys on dogecoin till it hits the 1$mark, then another setup will come.

Volatility Till the End!They said you can't chart VIX.. Charting VIX isn't useful.. Well I charted VIX.. Along with SPY and M1, and well decide for yourself, but I think we can tell where the volatility is coming from. Maybe the long vol trade will become popular!

Stocks Make New Highs, What's Next?Stocks broke past new highs, hitting our profit target. The S&P is facing resistance at 3825, and it is reasonable for it to retrace. There is not a lot of momentum to this rally as measured by the Kovach OBV. New highs should take some momentum to punch through. If we do retrace, we could find support at 3792 and 3784, which are nearby technical and Fibonacci levels, respectively. A sharper retracement could take us to 3759, which is a Fibonacci and technical level. Once we break out, the Fibonacci extension 3856 is the next target.

Ladies and Gentlemen, we have a new stimulus package / S&P500On Sunday, President Trump signed a 2.3 trillion pandemic aid and spending package into law. The price reacted with a strong bullish movement, and we are close to a new ATH.
The bubble goes up, and we go with the bubble.
Let's see how this situation plays from a Technical Perspective in 2 timeframes.
4HS: The price reversed from a Support zone after an aggressive bearish movement on December 21. We can see an ascending channel that explains the price behavior pretty well, so it's a relevant area to pay attention to.
We have two targets for the current movement.
a) The most conservative one: 3800 (the higher trendline of the ascending channel) that is a great place to take partial or total profits if you have long setups
b) The final target, which is a Daily trendline that we considered, has good chances of making the price reversed either for a considerable correction or for a strong bearish movement. We don't want to go further from there without observing clear structures.
Daily Chart:

TSLA Bull Flag 1Hr - could this be it?TSLA has been choppy and trading in a channel for 2 straight days now. this is mostly due to outside pressure from the non-farm payroll report, stimulus inaction, short Michael Burry. despite all the selling pressure the stock as oscillated between 590 and 595. Scaling out to the hourly view I see what looks like a bull flag forming. so if we have a breakout at end of the day maybe we have a chance. but it needs to break past 600 and stay there to confirm. if it does i see a swing over the weekend. and we can open on monday in the low to mid 600's. cautiously optimistic. as always never play what you would lose sleep over. i'm using profits for a small swing play. happy trading!

Our Stock of the Day / GOOGLToday we have a long setup to share. Here you will see a full explanation of it.
a) We can see the price above a major Resistance zone now working as a support
b) On that level, we have a corrective structure (ABC pattern), which is considered a bullish continuation pattern
c) We don't have any major resistance on the way towards the all-time highs zone. That provides us with a high-quality zone to develop long setups
d) Entry, Stop, and Take profit are the ones you can observe on the chart. The break-Even level will be the horizontal yellow line at the first Fibonacci Extension
e) We will risk 1% of our capital on this trade
f) We will cancel it if the price goes below the corrective structure
g) Remember: Trade safe, protect your capital, and always understand what you are doing.

Our Stock of the Day / ATVIToday, we have a long setup to share. Here you will see a full explanation of the logic behind it.
a) We always start on the weekly chart; we want to understand the main context.
b) There we can see that the price has broken the previous all-time highs, and after that, a massive consolidation started
c) Now, on the Daily chart, we can see that the consolidation is a clear ABC pattern (FLAG structure), which is considered a bullish pattern
d) Classic chartism would also say that we can see a CUP and HANDLE structure, which is also a bullish structure
e) Setup configurations: Entry is above B and the previous All-time highs zone. The stop is below C. Take profit is on the last Fibonacci Extension. Break-even is on the first Fibonacci Extension. Risk Rewards Ratio 1.55
f) We will risk 1% of our capital on this trade
g) We will cancel the setup if the price goes below C
h) Remember: Trade Safe, protect your capital, and always understand what you are doing


Made +20% profit NFLX , Now it's done , wait for two weeks.20% profit in 20 days. . Sold it at $570
I posted for you guys BELOW .How much you made ? 10%/5% / zero?
Now , DON'T touch it unless you are experienced /med trader. It needs time to take it's breath .
Probably the floor is $500 but for me i'm done with , I have a lot of other great stocks patterns being formed now .why would i chase a mediocre chance, gave me +20% she did great job that girl :) .
I'm sorry i don't read comments nor reply them . No time for that .
Follow me and If you want to contact me , PM me . Use the private message you are welcomed .
Stonks only goes up :) .
#NFLX $NFLX

DJI Going to 44K-DJI going to 44k over a 9 year economic golden era.
=Major crash will occur in 2029, repeat of 1929.
-Trumps going to win re-election
-The idea will be invalidated if Biden wins.
-Covid part 2 could stir things up. Market would honestly love it for more fake moonies.
*Stonks only go up

Rising or Ascending Channel for the S&P 500?The S&P 500 is forming a rising channel or ascending channel marked by two blue parallel uptrend lines.
Most stocks typically continue to channel until either trend line is broken.
An upside break is a signal that buying intensity has increased, while a downside break indicates an end to the short-term uptrend.
On the RSI there's a noticeable divergence, the blue downward sloping line of resistance will need to be purged to the upside before the pattern finishes or there's likely going to be a heinous correction if the pattern finishes bearishly.
The KST is trying to cross bullishly over the red line but has been rejected multiple times upon close observation, I've outlined a possible H&S pattern that will occur unless we see a bullish cross on the KST.

$QQQ head daily h&s$NQ_F $SPY $SPX $ES_F -- $QQQ showing alot of weakness with a head and shoulders forming on the daily chart, lets see what happens ;)


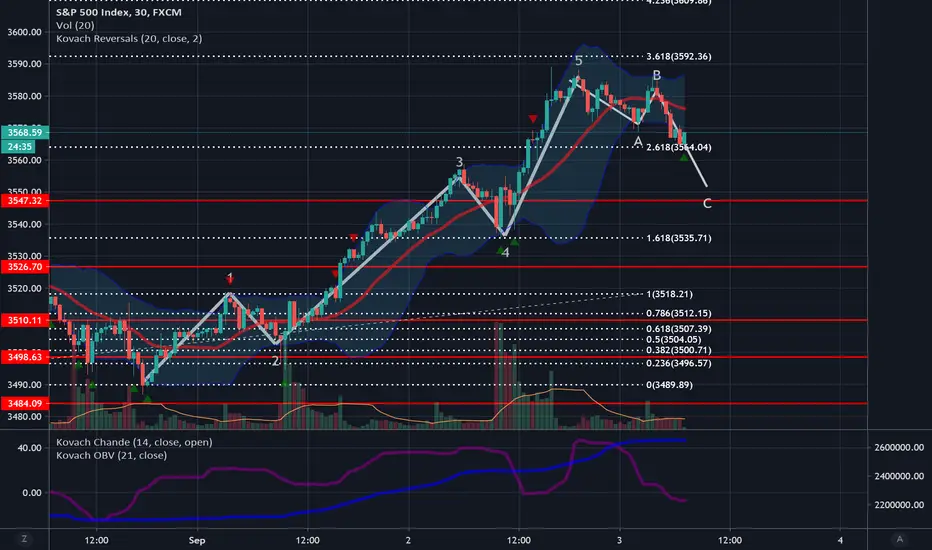
Best Ways to Trade the Rally in StocksStonks only go up, and have hit the target set from our Fibonacci Extensions. The Elliott wave suggests they could retrace very soon, and this would be a healthy retracement. We did see somewhat of a sell off yesterday. If we are right, the S&P should retrace to 3547. If we are wrong, it will pick up steam and rally around current levels at 3564. The Kovach OBV is very strong, so anticipate the rally to continue. Watch for a dip in the Kovach Chande for a good entry point, which it appears to be doing right now...