❗️USE STOP LOSS AND BECOME A BETTER TRADER❗️
🟩STOP LOSS IS:A stop-loss order is an order that automatically closes a losing position once the price hits the pre-specified level.
We usually calculate SL in pips, but there can be many ways to set it. It can be time based, percentage based or volatility based. For some investors SL is some piece of critical news, which alters their perception of the value of the asset. Regular stop losses can be many and varied too, for example trailing stop. Also, we sometimes move SL to entry after the half close to protect the gains and make our position risk free.However, all situations I listed above have one thing in common and it is the fact that the SL was used!
🟥Honestly, I am amused by the massive number of people who send me screenshots of their MT4 with several open trades on the same pair all of them without SL and with 90% of account lost. And they ask me what should they do? A great illustration of what is would take to recover from such a loss, is on the drawing above. With the 90% loss, you have only one tenth of the original account left. That means you need to make ten times more money than you have left just to recover your losses. 999% gain needs to be made just to have your old account back. It took you a day to blow it, and might take months to recover the losses. This is the brutality of the trading. The market is unforgiving and will punish you if you treat is without respect. If you are careless or if you make mistakes. The market always comes back to collect, waiting for the moment you drop your guard and relax for a second.
Please always use Stop Loss, because, as it happens, it stops you from losing too much!
I Hope you guys learned something new today✅
Wish you all Best Of Luck👍
😇And may the odds be always in your favor😇
Do you like this post? Do you want more articles like that?
Stoploss

Daily review of ETH interval 1HHello everyone, I invite you to a quick update of the situation of ETH to USDT on the 1H interval.
As we can see, we have formed a Rising Wedge pattern, which unfortunately is characterized by an exit from the bottom.
We can use the current situation to play the position, for this purpose we will mark the Stop Loss at $1618, which should be taken into account when playing short.
Entering positions in the area of the formation or just after leaving the formation at the bottom at $1525.
However, the target that can be taken into account is $ 1434.

Daily review of BTC interval 4HHello everyone, I invite you to a short discussion of the Rising Wedge formation created on the BTC chart.
We can observe the formation of the Rising Wedge, which is characterized by a bottom exit from the channel.
For a possible play, you should keep the stop loss at $ 21,630, while entering positions in the marked channel, but the safest will be at $ 20,755, after leaving the channel at the bottom.
The target that can be taken into account is around $ 19,686.
Please watch the EMA Cross 10 and 30 when the red line crosses the green from above to confirm this entry into a downtrend.

Learn Why Do You Need a Stop Loss 🟥
Hey traders,
Talking to many struggling traders from different parts of the world, I realized that the majority constantly makes the same mistake: they do not set a stop loss.
Asking for the reason why they do that, the common answer is that
these traders consider the manual position closing to be safer, implying that if the market goes in the opposite direction, they will be able to much better track the exact moment to cut loss.
In this article, we will discuss why it is crucially important to set a stop loss and why it is the number one element of your trading position.
First of all, let's discuss what is a stop loss. By a stop loss, we mean a certain price level where we close our trading position in loss. In comparison to a manual closing, the stop loss should be set at the exact moment when the order is executed.
Stop loss allows us limiting the risks in case of unfavorable movements.
On the chart above, I have illustrated 2 similar negative scenarios: 1 with a stop loss being placed and one without.
In the example on the left, stop loss helped to prevent the excessive risk, cutting the loss at the beginning of a bearish wave.
With the manual closing, however, traders usually hold the negative positions much longer, praying for a reversal.
Holding a losing trade, emotions intervene. Greed and fear usually spoil the reasoning, causing irrational decisions.
Following such a strategy, the total loss of the second scenario is 5 times bigger than the total loss with a placed stop loss order.
Stop loss defines the point where you become wrong in your predictions. Planning your trade, you should know in advance such a point and cut your loss once it is reached.
Never trade without a stop loss.
❤️If you have any questions, please, ask me in the comment section.
Please, support my work with like, thank you!❤️

Daily review of BTC interval 4HHello everyone, let's look at the BTC to USDT chart on the four hour time frame. As you can see, the price is moving above the local uptrend line.
Let's start with the support line and as you can see the first support in the near future is $17214, if the support is broken then the next support is $17169 and $17111.
Now let's go from the resistance line, as you can see the first resistance is $17311, if you manage to break it, the next resistance will be $17367, $17426 and $17505.
Looking at the CHOP indicator, we see that the energy is slowly increasing, the MACD confirms the uptrend, while the RSI is moving in the upper range, which may indicate a small correction.

Did Someone Say SUPPORT ZONE!?!Amazon is currently at support and there is a higher probability price moves up from here...
Love it or hate it, hit that thumbs up and share your thoughts below!
Every day the charts provide new information. You have to adjust or get REKT.
Don't trade with what you're not willing to lose. Safe Trading, Calculate Your Risk/Reward & Collect!
This is not financial advice. This is for educational purposes only.

BTC FOR POTENTIAL MOVE UPAs you can see on the hourly chart we successfully broke out of the local downtrend and could have a momentarily move up but DO NOT GET YOUR HOPES UP as we are still in an overall bearish market.
Potential take profit zones are to the nearest local resistance levels but first take profit is at previous local high
Have a good day and may the market treat you well.

BNB / USDT 4H INTERVAL, STOPLOSS AND TARGETSHello everyone, let's look at the 4H BNB to USDT chart as you can see that the price is moving in a sideways trend channel denoted by the white lines.
Let's start by setting goals for the near future that we can take into account:
T1 = $246.9
T2 = $248.4
T3 = $250.6
and
T4 = $253.6
Now let's move on to the stop loss in case the market goes down further:
SL1 = $245.2
SL2 = $243.3
SL3 = $240.4
and
SL4 = $236.8
Looking at the CHOP indicator, we see that the energy is charged on the 4H interval, while the MACD indicator indicates a local uptrend.

Average True Rangehe Average True Range is a volatility indicator measuring how much the price of an asset has moved over a certain number of periods, in other words how volatile the asset is. It was created by J. Welles Wilder and was featured in his book “New Concepts in Technical Trading System”. It was originally designed as a volatility indicator able to capture gaps in commodities, since a volatility formula based solely on the high-low range would miss that movement. However, the ATR can be used for stocks, indexes and currencies as well.
What traders use the ATR for is to determine their profit target and the optimal price level for placing protective stops by predicting how far the asset may move in the future. The Average True Range is most commonly calculated on a 14-period basis, but as with most other indicators, it can be fine-tuned according to each traders unique trading system.
The ATR is a directionless indicator, basically a type of moving average of the assets price movement over a certain period of time, which does not indicate the direction of the trend. You can see how the ATR is visualized on a chart on the screenshot below.
As you can see, We have plotted in every opened trade the value of the ATR at that moment. We've used the default 14-period basis, which means that the average price movement over the last 14 periods ( candles ) is 151 pips for the first trade, 137,8 for the second, and 196,2 for the last one. A trader can therefore expect the price to move within the range of 151 / 137 and 196 pips during these trades, thus giving a hint of where his/her profit target and protective stops should be.
As you can see. We have used 2 methods for using the ATR on these trades.
On the first trade, we have opened a position on the pullback of the previous Resistance, the SL and the TP have been calculated using the ATR multiply one time.
151 pips for the SL and 151 for the TP.
The second trade is based on a continuation trend strategy and also on this occasion the TP and SL have used the multiply ATR 1 time.
Last trade, Again Pullback on previous support with ATR multiply 2 times.
How is the ATR calculated?
The Average True Range is calculated by estimating the True Range for each of the included periods and then finding their average using a formula, which is shown below.
The True Range is defined as the greatest of the following:
– The difference between the current high and the current low
– The difference between the current high and the previous close in an absolute value
– The difference between the current low and the previous close in an absolute value
The first scenario is used when the current high is above the previous period's high and the recent low is below the preceding period's low (the previous candle is engulfed by the current one).
The second and third scenarios are used when a gap has occurred or the current period is engulfed by the previous period. Since Wilder was interested in measuring the distance between two points, and not in the direction of movement, here we use absolute values.
After we've calculated the True Range for each period we have decided to track back, we must now calculate the Average True Range by adding these values and calculating their average (as we've already said, the ATR is a moving average of the TR values).
As mentioned before, the most commonly used and set as default in most trading platforms' period settings is 14 periods. After we estimated the ATR for the initial 14 periods, we must then use the following algorithm to estimate future values:
Current ATR = / 14
How to trade the ATR
You've already learned that the Average True Range acts as a tool to measure the degree of interest or disinterest in a price movement. This means that inspiring moves are often accompanied by large TRs, especially at the beginning of a move, while weak moves are followed by narrow ranges. This allows us to use this indicator to gauge the enthusiasm behind every move, including breakouts.
For example, a price reversal, accompanied by an increase in the ATR value would suggest strong sentiment toward that move and reinforce the reversal, while a weak ATR would suggest proceeding with caution.
This is also true when the price breaks through support or resistance. If the breakout is supported by a rise in the ATR, it will be most likely a real move, but waning support from the indicator would suggest that the breakout might be false.

CRO / USDT 1W Interval ReviewHello everyone, let's take a look at the 1W CRO to USDT chart as the price is currently at the 2020 low and also looking from the 2021 high at around 95% down.
Let's start by setting goals for the near future that we can take into account:
First, the price has to break through the strong resistance zone from $0.0629 to $0.0876, only then will it be able to move towards the targets:
T1 = $0.1071
T2 = $0.1397
and
T3 = $0.1723
Now let's move on to the stop loss in case the market goes down further:
SL1 = $0.0571
SL2 = $0.0463
SL3 = $0.0376
and
SL4 = $0.0288
Looking at the CHOP indicator, we see that on the 1W interval, the energy is used for price decreases, the MACD is close to the intersection, however, it indicates an uptrend, while the RSI has been moving at the lower end of the range for a long time, which may indicate upcoming price increases.

FTM / USDT 1D Interval - Targets and StoplossHello everyone, let's look at the 1D FTM to USDT chart as you can see that the price is moving below the local uptrend line.
Let's start by setting goals for the near future that we can take into account:
T1 = $0.2091
T2 = $0.2193
T3 = $0.2277
T4 = $0.2355
and
T5 = $0.2473
Now let's move on to the stop loss in case the market goes down further:
SL1 = $0.2019
SL2 = $0.1854
and
SL3 = $0.1644
Looking at the CHOP indicator, we see that most of the energy has been used on the 1D interval, the MACD indicator indicates that we are moving in a local downtrend.

UNIUSDT 4H Interval- Targets and StoplossHello everyone, let's take a look at the 4H UNI to USDT chart as you can see that the price is moving below the uptrend line and we are still below trending as well.
Let's start by setting goals for the near future that we can take into account:
T1 = $5.53
T2 = $5.72
T3 = $5.89
T4 = $6.04
and
T5 = $6.26
Now let's move on to the stop loss in case the market goes down further:
support zone from $5.44 to $5.14
SL2 = $4.28
Looking at the CHOP indicator, we see that the energy is heavily depleted on the 4H interval, the MACD indicates a local downtrend, while the RSI is at the lower end, which could potentially indicate upcoming increases.

COTI / USDT 4H CHART - Targets and Stoploss!Hello everyone, let's look at the 4H COTI to USDT chart as you can see that the price is moving below the local downtrend line.
Let's start by setting goals for the near future that we can take into account:
T1 = $0.0686
T2 = $0.06943
T3 = $0.07013
T4 = $0.07077
and
T5 = $0.07176
Now let's move on to the stop loss in case the market goes down further:
SL1 = $0.0675
SL2 = $0.06638
and
SL3 = $0.06494
Looking at the CHOP indicator, we see that the energy is gathering more and more strength on the 4H interval, while the MACD indicator indicates a local downtrend. It is also worth adding that we have a rebound on the RSI.

LUNAUSDT - 4H Interval - Targets and StoplossHello everyone, let's look at the 4H LUNAUSDT chart as you can see that the price is moving in the uptrend channel, however it has locally moved sideways from the uptrend line in the channel.
Let's start by setting goals for the near future that we can take into account:
T1 - $1.6663
T2 - $1.6928
T3 - $1.7154
T4 - $1.7373
and
T5 - $1.7694
Now let's move on to the stop loss in case the market goes down further:
SL1 - $1.6464
SL2 - $1.6114
SL3 - $1.5821
SL4 - $1.5533
and
SL5 - $1.5145
Looking at the CHOP indicator, we see that the energy is strongly charged on the 4H interval, the MACD indicator indicates entering a local uptrend, while the RSI shows that despite we are high, we have room for further growth, but it is worth keeping the SL.

UNIUSDT 1D Interval- Targets and StoplossHello everyone, let's look at the 1D UNI to USDT chart as you can see how we can see the price moving below the downtrend line marked in yellow.
Let's start by setting goals for the near future that we can take into account:
T1 - $6.68
T2 - $7.29
T3 - $7.91
T4 - $8.76
and
T5 - $9.85
Now let's move on to the stop loss in case the market goes down further:
SL1 - $5.81
SL2 - $4.72
and
SL3 - $3.33
Looking at the CHOP indicator, we see that on the 1D interval, the energy is starting to slowly increase, while the MACD indicator shows an uptrend, and the RSI shows that we still have room for further growth.

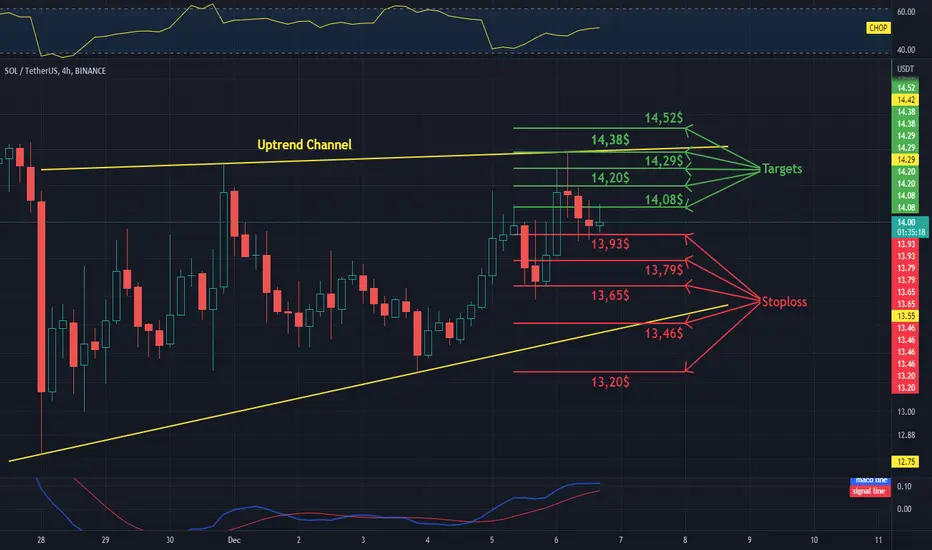
SOL - USDT 4HChart, targets and stoplossHello everyone, let's look at the 4H SOL to USDT chart as you can see that the price is moving in the uptrend channel.
Let's start by setting goals for the near future that we can take into account:
T1 = $14.08
T2 = $14.20
T3 = $14.29
T4 = $14.38
and
T5 = $14.52
Now let's move on to the stop loss in case the market goes down further:
SL1 = $13.93
SL2 = $13.79
SL3 = $13.65
SL4 = $13.46
and
SL5 = $13.20
Looking at the CHOP indicator, we see that the energy is slowly gaining strength on the 4H interval, while the MACD indicator indicates a local uptrend.
XLV Short IdeaAfter regarding the 200SMA Daily as Resistance,
forms a Diamond Reversal w/ Triple MACD + RSI Hidden Bearish Divergence
w/ 4 Hour MACD Bearish Divergence
Looking for a breakout and to see how markets open this week before a final decision, loosen or tighten targets as you will.
GIVE ME FEEDBACK
** NOT FINANCIAL ADVICE **

CHZUSDT 30M - Targets and StoplossHello everyone, let's take a look at the CHZ 30M to USDT chart as you can see that the price has moved above the local downtrend line.
Let's start by setting goals for the near future that we can take into account:
T1 = $0.1626
T2 = $0.1656
T3 = $0.1687
and
T4 = $0.1706
Now let's move on to the stop loss in case the market goes down further:
SL1 = $0.1609
SL2 = $0.1601
SL3 = $0.1594
and
SL4 = $0.1588
Looking at the CHOP indicator, we see that the energy has been exhausted on the 30M interval and is slowly rebounding, while the MACD indicator indicates that we are close to confirming the trend change to an upward one, however, looking at the volume despite the visible green candles, we see that it is very low compared to the red candle.

ETH / USDT 4HChart - Targets And StopLossHello everyone, let's look at the 4H ETH to USDT chart as you can see that the price is moving above the uptrend line.
Let's start by setting goals for the near future that we can take into account:
T1 = $1272
T2 = $1281
T3 = $1310
and
T4 = $1355
Now let's move on to the stop loss in case the market goes down further:
SL1 = $1261
SL2 = $1251
SL3 = $1241
and
SL4 = $1233
Looking at the CHOP indicator, we see that on the 4H interval, some energy has been used, but there is still some left to continue the movement, while the MACD indicator indicates a local downtrend.

XRP - USDT on 4H interval Targets and StoplossHello everyone, let's look at the 4H XRP to USDT chart as you can see that the price is moving below the local uptrend line, and within the triangle outlined by the blue lines.
Let's start by setting goals for the near future that we can take into account:
T1 = $0.3923
T2 = $0.3980
T3 = $0.4028
T4 = $0.4070
and
T5 = $0.4133
Now let's move on to the stop loss in case the market goes down further:
SL1 = $0.3865
SL2 = $0.3833
SL3 = $0.3799
SL4 = $0.3754
and
SL5 = $0.3694
Looking at the CHOP indicator, we see that there is a lot of energy for a new move on the 4H interval, while the MACD indicator indicates a local downtrend.

Analysis, Set Up and Taking Trade Part 2Sometimes trades don't go the way we anticipated but for that reason, we have Stop Loss.
This Is one trade at the loss so far.
One more trade and I'm done regardless if I make win or lose.

HOW TO MANAGE YOUR EMOTIONSHello everyone! One of the most important , and in the same time, one of the hardest aspects of trading is the ability to manage correctly your emotions and leave them aside while trading. So how can we manage our emotions in stressful situations? Here are some tips that every trader should consider when starting trading:
1. DO NOT ACT ON ANGER: every time you feel strong emotions, hold back and revisit your trading plan, is your move aligned with your initial plan or are you acting on irrational emotions? One of the worst things is to take a position based on anger after a loss in order to recover the losses. Take a deep breath and rethink your decision!
2. DO NOT FALL IN LOVE WITH YOUR POSITIONS: we all want to always be right, but sometimes we have to accept a bad position and close it. It is common to fall in love with our positions and hold it out of hope that the market will switch, but involving emotions just blow the account, stick to your plan!
3. ESTABLISH SOME TRADING RULES AND KEEP A TRADING JOURNAL: setting your own rules of trading and risk management is crucial for a profitable account. No matter what you hear from others and how good a position may look, if it is not aligned with your rules, do not take it! Moreover, do not change a strategy after some losses, stick to what you have learnt and planned, keep the information in a trading journal and plan your next moves based on you learnt from it.
4. TAKE A BREAK AFTER 3 LOSSES IN A ROW: it is natural to have a bad day, but when this happen do not become over emotional and over trade, but rather take a break and wait for a new and fresh trading day. Strong emotions will ruin any important decision, no matter the context, so try to avoid them.
5. SET TP AND SL AND TRUST YOUR JUDGEMENT: after establishing your trading plan and risk management plan, in order to stick to your risk to reward strategy, you have to use Take Profit and Stop Loss orders, and trust your judgment and the market. No matter what happens, this helps you have a clear forecast of your account, without blowing it. Also, avoid getting greedy and secure your profits with take profit order.
6. LOWER THE TRADE SIZE: if you feel overwhelmed by the risk on each trade, and out of fear you make irrational decisions, try to lower the trade size to what feels comfortable with you. After doing this, always update your trading strategy!
7. DO NOT GIVE UP! : there is a point when every trader feels like giving up, losing all his faith, but you should understand that this is the normal journey, with ups and downs, and if you do not let yourself intimidated by the downs, the ups are limitless!

QNTUSDT 4H Interval Targets and StoplossHello everyone, let's take a look at the 4H QNT to USDT chart as you can see that the price is moving in a sideways trend channel and locally trying to break out of the down trend line upwards.
Let's start by setting goals for the near future that we can take into account:
T1 = $114.1
T2 = $117.6
T3 = $120.5
T4 = $123.5
and
T5 = $127.3
Now let's move on to the stop loss in case the market goes down further:
SL1 = $112.5
SL2 = $110
SL3 = $108.2
SL4 = $106.3
and
SL5 = $103.5
Looking at the CHOP indicator, we see that most of the energy has been used on the 4H interval, while the MACD indicator indicates a local downtrend.
