Daily review of BNB interval 1H - SHORTHello everyone, let's take a look at the 1H BNB to USDT chart as you can see the price is moving above the local uptrend line.
Let's start by setting goals for the near future that we can consider:
T1 - $ 283
T2 - $ 284.6
T3 - $ 285.9
and
T4 - $ 287.3
Now let's move on to the stop loss in case of further market declines:
SL1 - $ 282.2
SL2 - $ 280.9
SL3 - $ 279.9
SL4 - $ 278.9
and
SL5 - $ 277.4
Looking at the CHOP indicator, we can see that in the 1H range we have a lot of energy, and the MACD indicator shows a local upward trend.
Stoploss

Daily review of ETH interval 1H - ShortHello everyone, let's take a look at the 1H ETH to USDT chart as you can see the price is moving in the channel marked by the yellow lines and is approaching the exit from it.
Let's start by setting goals for the near future that we can consider:
T1 = $ 1,327
T2 = $ 1,339
T3 = $ 1,351
T4 = $ 1,369
and
T5 = $ 1,391
Now let's move on to the stop loss in case of further market declines:
SL1 = $ 1,314
SL2 = $ 1,305
SL3 = $ 1296
SL4 = $ 1288
and
SL5 = $ 1277
Looking at the CHOP indicator, we can see that in the 1H range we have a lot of energy, and the MACD indicator shows a local downward trend.

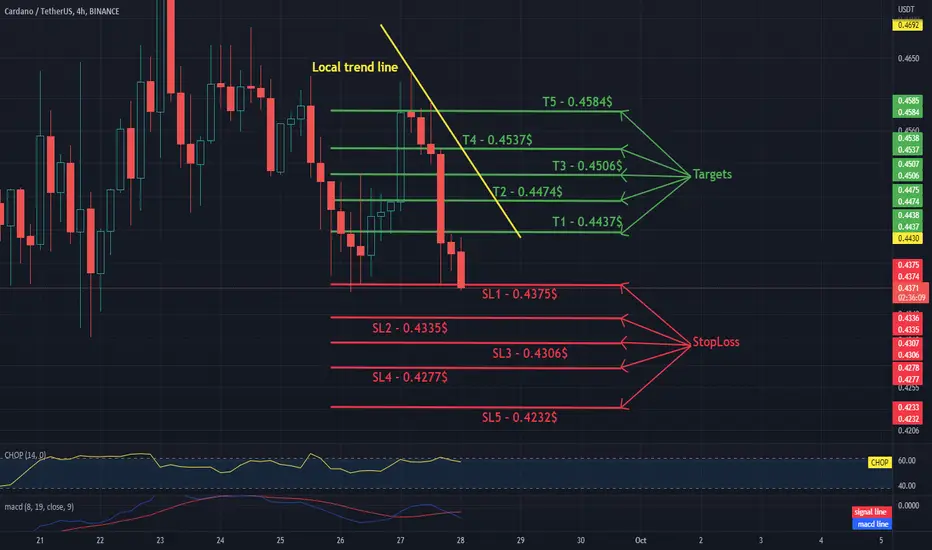
ADA/USDT TARGETS AND STOPLOSS 4HHello everyone, let's take a look at the 4H ADA to USDT chart as you can see the price is moving below the local downtrend line.
Let's start by setting goals for the near future that we can consider:
T1 - $ 0.4437
T2 - $ 0.4474
T3 - $ 0.4506
T4 - $ 0.4537
and
T5 - $ 0.4584
Now let's move on to the stop loss in case of further market declines:
SL1 - $ 0.4375
SL2 - $ 0.4335
SL3 - $ 0.4306
SL4 - $ 0.4277
and
SL5 - $ 0.4232
Looking at the CHOP indicator, we can see that in the 4H range we have a lot of energy, while the MACD indicator shows a local downward trend.
4 ways to set a Stop LossIn this video I explain how to set a stop loss 4 different ways, In order for more traders to become systematic.

XRP - USDT on 4H interval Targets and StoplossHello everyone, let's take a look at the 4H XRP to USDT chart as you can see the price is moving below the local uptrend line.
Let's start by setting goals for the near future that we can consider:
T1 = $ 0.4000
T2 = $ 0.4082
T3 = $ 0.4143
T4 = $ 0.4208
and
T5 = $ 0.4294
Now let's move on to the stop loss in case of further market declines:
SL1 = $ 0.3899
SL2 = $ 0.3844
SL3 = $ 0.3806
SL4 = $ 0.3762
and
SL5 = $ 0.3699
Looking at the CHOP indicator, we can see that in the 4H range the energy slowly starts to rise, while the MACD indicator shows a local downward trend.

SOL - USDT 1HChart, targets and stoplossHello everyone, let's take a look at the 1H SOL to USDT chart as you can see the price is moving in the local downtrend channel.
Let's start by setting goals for the near future that we can consider:
T1 - $ 31.60
T2 - $ 31.86
T3 - $ 32.06
T4 - $ 32.27
and
T5 - $ 32.56
Now let's move on to the stop loss in case of further market declines:
SL1 - $ 31.35
SL2 - $ 31.04
SL3 - $ 30.79
SL4 - $ 30.54
and
SL5 - $ 30.19
Looking at the CHOP indicator, we can see that in the 1H range we have very little energy, while the MACD indicator shows a local downward trend.

Updating the SOLUSDT chart from 4H to 1D - targets and stoplossHi everyone, let's update today's SOL analysis on the 4H interval as you can see The price went up a lot and on 1D intervale we got out of the downward trend line, breaking the previously designated short targets.
Let's start by setting goals for the near future that we can consider:
T1 - $ 31.60
T2 - $ 31.86
T3 - $ 32.06
and
T4 - $ 32.27
Now let's move on to the stop loss in case of further market declines:
SL1 - $ 31.35
SL2 - $ 31.04
SL3 - $ 30.79
SL4 - $ 30.54
and
SL5 - $ 30.19
Looking at the CHOP indicator, we can see that in the 1D range we still have a lot of energy for further moves, while the MACD indicator shows that in the long term we are entering an upward trend.

ETH / USDT 4HChart - Targets And StopLossHello everyone, let's take a look at the 4H ETH to USDT chart as you can see the price is moving above the local downtrend channel.
Let's start by setting goals for the near future that we can consider:
T1 = $ 1,351
T2 = $ 1,368
T3 = $ 1,382
T4 = $ 1,396
and
T5 = $ 1,416
Now let's move on to the stop loss in case of further market declines:
SL1 = $ 1,304
SL2 = $ 1,284
SL3 = $ 1267
SL4 = $ 1,251
and
SL5 = $ 1,227
Looking at the CHOP indicator, we can see that in the 4H range some energy was used, while the MACD indicator shows a local upward trend.

ETHWUSD - Targets and StoplossHello everyone, let's take a look at the 4H ETHW to USDT chart as you can see the price is moving above the local uptrend line.
Let's start by setting goals for the near future that we can consider:
T1 = $ 5.86
T2 = $ 6.35
T3 = $ 6.78
T4 = $ 7.17
and
T5 = $ 7.78
Now let's move on to the stop loss in case of further market declines:
SL1 = $ 5.56
SL2 = $ 5.21
SL3 = $ 4.93
SL4 = $ 4.64
and
SL5 = $ 4.25
Looking at the CHOP indicator we can see that in the 4H range we have a lot of energy, while the MACD indicator shows the local uptrend.

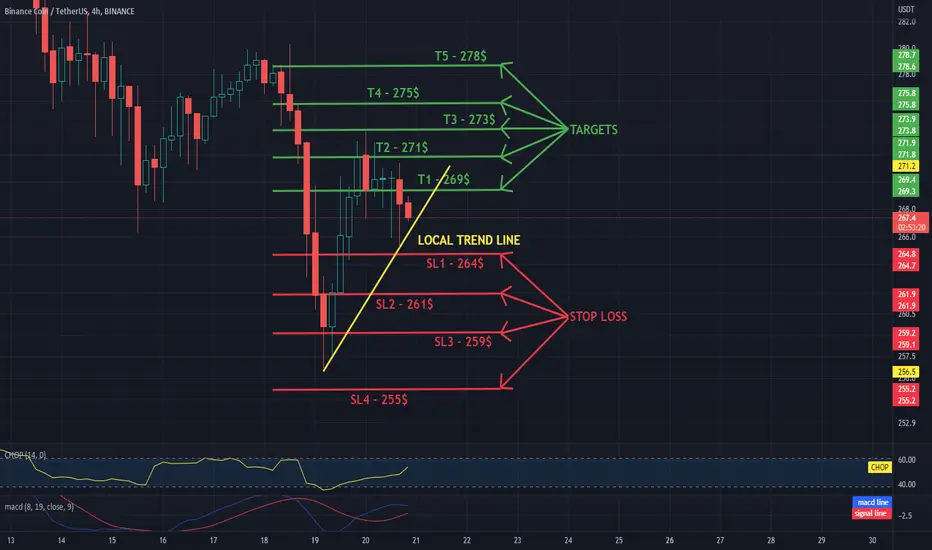
BNB / USDT 4H INTERVAL, STOPLOSS AND TARGETSHello everyone, let's take a look at the 4H BNB to USDT chart as you can see the price is moving above the local uptrend line.
Let's start by setting goals for the near future that we can consider:
T1 - $ 269
T2 - $ 271
T3 - $ 273
T4 - $ 275
and
T5 - $ 278
Now let's move on to the stop loss in case of further market declines:
SL1 - $ 264
SL2 - $ 261
SL3 - $ 259
and
SL4 - $ 255
Looking at the CHOP indicator, we can see that in the 4H range we have more and more energy, while the MACD indicator shows a local upward trend.
ETHUSDT - Targets and Stoploss - Interval 4HHello everyone, let's take a look at the 4H ETH to USDT chart as you can see the price is moving above the local uptrend line.
Let's start by setting goals for the near future that we can consider:
T1 = $ 1,357
T2 = $ 1,373
T3 = $ 1,388
T4 = $ 1,401
and
T5 = $ 1,421
Now let's move on to the stop loss in case of further market declines:
SL1 = $ 1,338
SL2 = $ 1,330
SL3 = $ 1,322
SL4 = $ 1,314
and
SL5 = $ 1,303
Looking at the CHOP indicator, we can see that in the 4H range we have more and more energy, while the MACD indicator shows a local upward trend.

Bitcoin support/resistance levels and zones in daily timeframeBitcoin is in a decisional zone and as show in the chart, the main supply and demand zones in daily timeframe are 17600 as support and 24260 as resistance . these zones are accompanies with a " Price Inefficiency " or as you might have heard " Fair Value Gap ". please refer to the ideas chart to check the zones.
basically waiting for each of these zones to be broken and to be accompanied with a pullback to that zone is the most logical strategy at the time being. the zone which is broken can also work as a stoploss in case of an entry.
for the sake of listing a possible strategy:
wait for the any of the above mentioned zones to be broken with a candle body not a shadow.
wait for the pullback for entry.
set a stop loss on top of the broken zone in case of a short position or on the bottom of the broken zone in case of a long position.
calculate you position volume based on the stop loss and your risk tolerance.
having a clear strategy and patience is the key to the game.

FTM/USDT 4H Interval - Targets and ResistanceHello everyone, let's take a look at the 4H FTM to USDT chart as you can see the price is moving in the local downtrend channel.
Let's start by setting goals for the near future that we can consider:
T1 - $ 0.2305
T2 - $ 0.2350
T3 - $ 0.2394
T4 - $ 0.2456
and
T5 - $ 0.2539
Now let's move on to the stop loss in case of further market declines:
SL1 - $ 0.2231
SL2 - $ 0.2175
SL3 - $ 0.2129
and
SL4 - $ 0.2084
Looking at the CHOP indicator, we can see that in the 4H range the energy is slowly starting to rise, while the MACD indicator confirms the local downward trend.

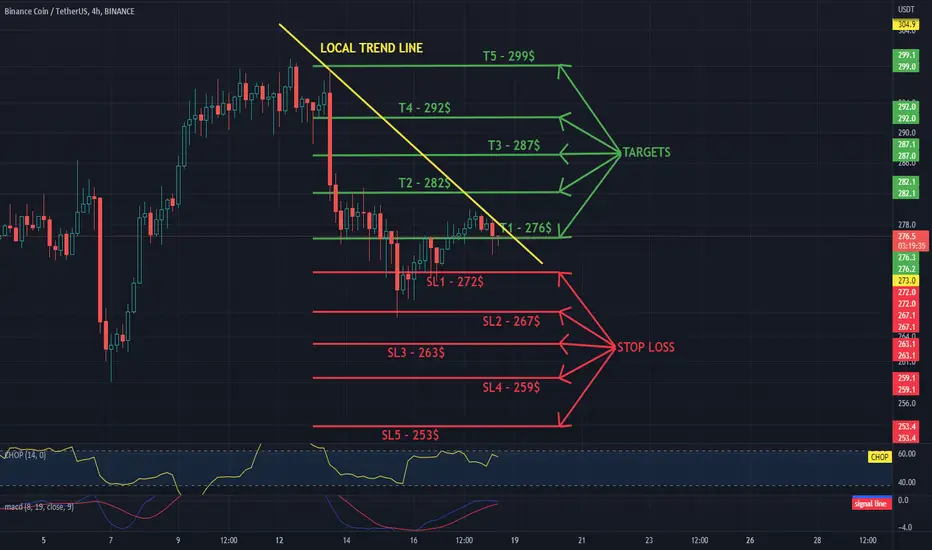
Daily review of BNB interval 4HHello everyone, let's take a look at the 4H BNB to USDT chart as you can see the price is moving below the local downtrend line.
Let's start by setting goals for the near future that we can consider:
T1 - $ 276
T2 - $ 282
T3 - $ 287
T4 - $ 292
and
T5 - $ 299
Now let's move on to the stop loss in case of further market declines:
SL1 - $ 272
SL2 - $ 267
SL3 - $ 263
SL4 - $ 259
and
SL5 - $ 253
Looking at the CHOP indicator, we can see that there is a lot of energy in the 4H range, while the MACD indicator shows the local uptrend.
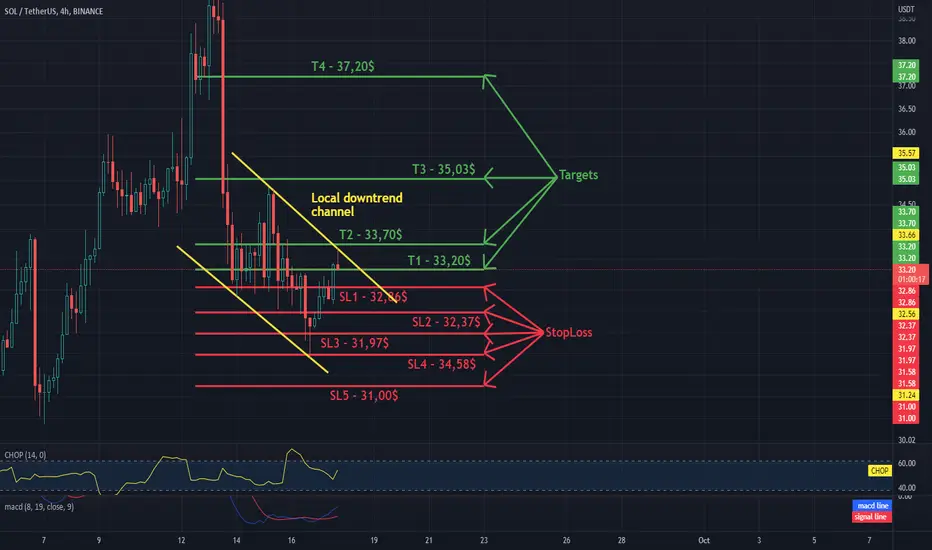
SOL - USDT 4HChart, targets and stoplossHello everyone, let's take a look at the 4H SOL to USDT chart as you can see the price is moving in the local downtrend channel.
Let's start by setting goals for the near future that we can consider:
T1 - $ 33.20
T2 - $ 33.70
T3 - $ 35.03
and
T4 - $ 37.20
Now let's move on to the stop loss in case of further market declines:
SL1 - $ 32.86
SL2 - $ 32.37
SL3 - $ 31.97
SL4 - $ 34.58
and
SL5 - $ 31.00
Looking at the CHOP indicator, we can see that in the 4H range the energy started to rise, while the MACD indicator shows a local upward trend.
DOT / USDT 4H CHART - targets and stoploss!Hello everyone, let's take a look at the 4H DOT to USDT chart as you can see the price is moving in the local downtrend channel.
Let's start by setting goals for the near future that we can consider:
T1 = $ 7.06
T2 = $ 7.24
T3 = $ 7.40
T4 = $ 7.55
and
T5 = $ 7.77
Now let's move on to the stop loss in case of further market declines:
SL1 = $ 6.76
SL2 = $ 6.62
SL3 = $ 6.44
SL4 = $ 6.28
and
SL5 = $ 6.13
Looking at the CHOP indicator, we can see that there is a lot of energy in the 4H range, while the MACD indicator indicates that we can enter a local upward trend.

Daily review of ETH interval 4HHello everyone, let's take a look at the 4H ETH to USDT chart as you can see the price is moving in the local uptrend channel.
Let's start by setting goals for the near future that we can consider:
T1 = $ 1,621
T2 = $ 1,665
T3 = $ 1,700
T4 = $ 1735
and
T5 = $ 1,786
Now let's move on to the stop loss in case of further market declines:
SL1 = $ 1564
SL2 = $ 1,536
SL3 = $ 1508
SL4 = $ 1,467
and
SL5 = $ 1,416
Looking at the CHOP indicator, we can see that in the 4H range the energy slowly starts to rise, while the MACD indicator shows a local upward trend.

ETCUSDT - Targets and Stoploss - Interval 4HHello everyone, let's take a look at the 4H ETC to USDT chart as you can see the price is moving below the local downtrend line.
Let's start by setting goals for the near future that we can consider:
T1 = $ 37.51
T2 = $ 38.41
T3 = $ 39.29
T4 = $ 40.52
and
T5 = $ 42.14
Now let's move on to the stop loss in case of further market declines:
SL1 = $ 36.49
SL2 = $ 35.58
SL3 = $ 34.90
SL4 = $ 34.19
and
SL5 = $ 33.17
Looking at the CHOP indicator, we can see that in the 4H range we have a lot of energy, while the MACD indicator indicates that we are entering an uptrend locally.

XRP - USDT on 4H interval Targets and StoplossHello everyone, let's take a look at the 4H XRP to USDT chart as you can see the price is moving below the local uptrend line.
Let's start by setting goals for the near future that we can consider:
T1 = $ 0.3425
T2 = $ 0.3498
T3 = $ 0.3558
and
T4 = $ 0.3617
Now let's move on to the stop loss in case of further market declines:
SL1 = $ 0.3310
SL2 = $ 0.3265
SL3 = $ 0.3226
SL4 = $ 0.3189
and
SL5 = $ 0.3137
Looking at the CHOP indicator, we can see that in the 4H range most of the energy has been consumed, while the MACD indicator shows a local downward trend.

ADA/USDT TARGETS AND STOPLOSS 4HHello everyone, let's take a look at the 4H ADA to USDT chart as you can see the price is moving above the local downtrend line.
Let's start by setting goals for the near future that we can consider:
T1 - $ 0.4885
T2 - $ 0.4966
T3 - $ 0.5050
and
T4 - $ 0.5167
Now let's move on to the stop loss in case of further market declines:
SL1 - $ 0.4724
SL2 - $ 0.4629
SL3 - $ 0.4556
SL4 - $ 0.4478
and
SL5 - $ 0.4379
Looking at the CHOP indicator, we can see that in the 4H range most of the energy was used, while the MACD indicator shows that the blue line is at the border of the red line crossing from the bottom, which would confirm entering the local upward trend.

Where to place your STP LOSS is important & can be misleading Choosing your STP loss determines your risk, and is essential part of executing your trade.
On this trade analysis, we are looking at ticker F (Ford Motors) using the weekly (W) chart as the active chart, the price is selling off & coming into a Demand Zone (DZ). This DZ is also the last higher Low HL of the long-term (M) monthly uptrend.
my trading strategy; makes perfect sense of placing LNG entry, at this level. Order entered & waiting like a snipper in the DZ, surly enough the price penetrates into the DZ & the LNG order is executed at $12.90, now where to place your STP LOSS, meaning at which point do you determine the trade has gone against you & you need to exit & cut your losses short.
There are many strategies for placing your stop loss, some of the common ones, are placing the stop loss below the DZ, some other strategies offer a margin as a buffer, for example if price violates the DZ by lets say 0.50 points, am out & the STP Loss is triggered. the stop loss placement strategy that i used in this trade required a close of a candle stick below the DZ, few days after, once that occurred I executed you my STP loss, and was out at 11.30 points loss, so 1.60 loss per share. that is within my Risk to Reward ratio
Now, the trade was still a loss, yet it was not a bust; simply because I anticipated this risk within expected range of my trade plan. in other words, I followed my trading plan & rules; that really matters. Following a trading plan is how novice traders become trading sharks. Obviously it hurts the ego to witness price rallies to $15 and above; shortly after closing below the DZ & triggering my stop-loss; but thats life, you can't make sense of it all, the best we can do is learn how to navigate it.
*Active Chart (W)
*Long-term chart (M)
*Enter timing chart (D)

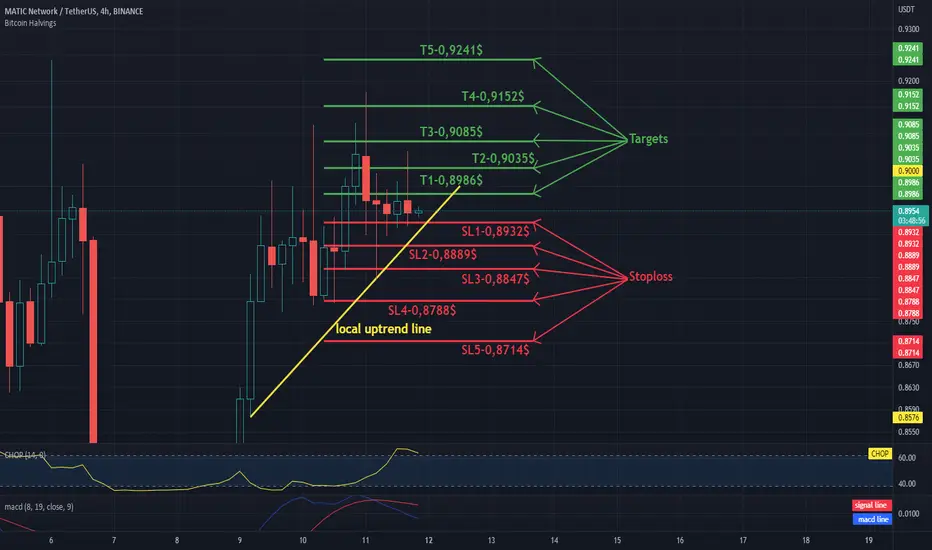
MATIC/USDT - Targets and Stoploss 4H IntervalHello everyone, let's take a look at the 4H MATIC to USDT chart as you can see the price is moving above the local uptrend line.
Let's start by setting goals for the near future that we can consider:
T1 - $ 0.8986
T2 - $ 0.9035
T3 - $ 0.9085
T4 - $ 0.9152
and
T5 - $ 0.9241
Now let's move on to the stop loss in case of further market declines:
SL1 - $ 0.8932
SL2 - $ 0.8889
SL3 - $ 0.8847
SL4 - $ 0.8788
and
SL5 - $ 0.8714
Looking at the CHOP indicator, we can see that in the 4H range we have a lot of energy for the next move, while the MACD indicator shows a local downward trend.
LUNAUSD - Targets and Stoploss Hello everyone, let's take a look at the 4H LUNA vs USD chart as you can see the price is moving in the local downtrend channel.
Let's start by setting goals for the near future that we can consider:
T1 = $ 6.04
T2 = $ 6.54
T3 = $ 6.92
T4 = $ 7.24
and
T5 = $ 7.81
Now let's move on to the stop loss in case of further market declines:
SL1 = $ 5.46
SL2 = $ 5.18
SL3 = $ 5.01
and
T5 = $ 7.81
Looking at the CHOP indicator, we can see that in the 4H range we have a lot of energy for the next move, while the MACD indicator shows a local downward trend.
