DOT / USDT 4H CHART - Targets and Stoploss!Hello everyone, let's take a look at the 4H DOT to USDT chart as you can see the price is moving above the local uptrend line.
Let's start by setting goals for the near future that we can consider:
T1 = $ 7.86
T2 = $ 8.02
T3 = $ 8.16
T4 = $ 8.31
and
T5 = $ 8.51
Now let's move on to the stop loss in case of further market declines:
SL1 = $ 7.71
SL2 = $ 7.58
SL3 = $ 7.47
SL4 = $ 7.34
and
SSL5 = $ 7.19
Looking at the CHOP indicator, we can see that in the 4H range the energy slowly starts to rise, while the MACD indicator shows a local downward trend.
Stoploss

ADA/USDT TARGETS AND STOPLOSS 4HHello everyone, let's take a look at the 4H ADA to USDT chart as you can see the price is moving above the local uptrend line.
Let's start by setting goals for the near future that we can consider:
T1 - $ 0.4975
T2 - $ 0.5083
T3 - $ 0.5232
and
T4 - $ 0.5422
Now let's move on to the stop loss in case of further market declines:
SL1 - $ 0.4828
SL2 - $ 0.4756
SL3 - $ 0.4690
SL4 - $ 0.4597
and
SL5 - $ 0.4469
Looking at the CHOP indicator, we can see that in the 4H range, energy has been used, while the MACD indicator shows a local upward trend.

Daily review of ETH interval 4HHello everyone, let's take a look at the 4H ETH to USDT chart as you can see the price is moving above the local uptrend line.
Let's start by setting goals for the near future that we can consider:
T1 = $ 1,658
T2 = $ 1,678
T3 = $ 1,698
T4 = $ 1726
and
T5 = $ 1763
Now let's move on to the stop loss in case of further market declines:
SL1 = $ 1,608
SL2 = $ 1578
SL3 = $ 1,555
SL4 = $ 1532
and
SL5 = $ 1,498
Looking at the CHOP indicator, we can see that in the 4H range the energy slowly starts to rise, while the MACD indicator shows a local upward trend.

ADA/USDT TARGETS AND STOPLOSS 4HHello everyone, let's take a look at the 4H ADA to USDT chart as you can see the price is moving below the local downtrend line.
Let's start by setting goals for the near future that we can consider:
T1 - $ 0.4718
T2 - $ 0.4768
T3 - $ 0.4830
and
T4 - $ 0.5008
Now let's move on to the stop loss in case of further market declines:
SL1 - $ 0.4611
SL2 - $ 0.4524
SL3 - $ 0.4453
SL4 - $ 0.4382
and
SL5 - $ 0.4284
Looking at the CHOP indicator, we can see that in the 4H range, energy has been used, while the MACD indicator shows a local downward trend.

Daily review of ETH interval 4HHello everyone, let's take a look at the 4H ETH to USDT chart as you can see the price is moving below the local downtrend channel.
Let's start by setting goals for the near future that we can consider:
T1 = $ 1,565
T2 = $ 1,585
T3 = $ 1,611
and
T4 = $ 1,643
Now let's move on to the stop loss in case of further market declines:
SL1 = $ 1,514
SL2 = $ 1,485
SL3 = $ 1,462
SL4 = $ 1,439
and
SL5 = $ 1,406
Looking at the CHOP indicator, we can see that in the 4H range the energy slowly starts to rise, while the MACD indicator shows a local downward trend.

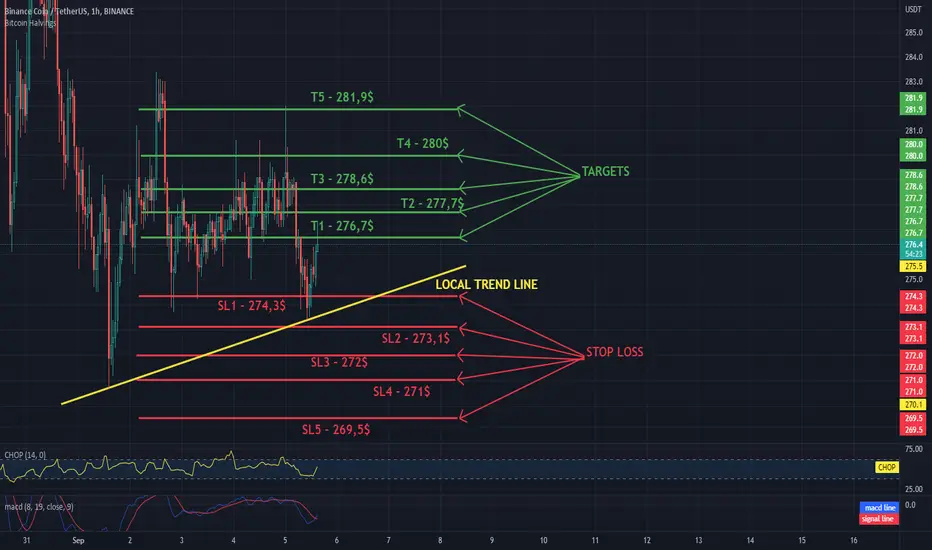
Short-term BNB / USDT analysis on the 1H intervalHello everyone, let's take a look at the 1H BNB to USDT chart as you can see the price is moving above the local uptrend line.
Let's start by setting goals for the near future that we can consider:
T1 - $ 276.7
T2 - $ 277.7
T3 - $ 278.6
T4 - $ 280
and
T5 - $ 281.9
Now let's move on to the stop loss in case of further market declines:
SL1 - $ 274.3
SL2 - $ 273.1
SL3 - $ 272
SL4 - $ 271
and
SL5 - $ 269.5
Looking at the CHOP indicator, we can see that in the 1H range we have more and more energy, while the MACD indicator shows a local upward trend.
Daily review of ETH interval 4HHello everyone, let's take a look at the 4H ETH to USDT chart as you can see the price is moving above the local uptrend line.
Let's start by setting goals for the near future that we can consider:
T1 = $ 1,587
T2 = $ 1,603
T3 = $ 1,620
T4 = $ 1,643
and
T5 = $ 1,672
Now let's move on to the stop loss in case of further market declines:
SL1 = $ 1567
SL2 = $ 1,550
SL3 = $ 1,535
SL4 = $ 1,521
and
SL5 = $ 1501
Looking at the CHOP indicator, we can see that in the 4H range we have a lot of energy, while the MACD indicator shows a local upward trend.

BTC 4H chart update.Simple and price action!
chart is so obvious that does not need anymore comments.just be careful when adjusting stoploss!
good luck all!

Daily ETH to USDT review on 4H intervalHello everyone, let's take a look at the 4H ETH to USDT chart as you can see the price is moving above the local uptrend line.
Let's start by setting goals for the near future that we can consider:
T1 - $ 1,657
T2 - $ 1720
T3 - $ 1,835
and
T4 - $ 1,906
Now let's move on to the stop loss in case of further market declines:
SL1 - $ 1,598
SL2 - $ 1563
SL3 - $ 1,537
SL4 - $ 1,507
and
SL5 - $ 1,468
Looking at the CHOP indicator, we can see that in the 4H range we have a lot of energy, while the MACD indicator shows a local upward trend.

Daily ETH to USDT review on 4H intervalHello everyone, let's take a look at the 4H ETH to USDT chart as you can see the price is moving above the local uptrend line.
Let's start by setting goals for the near future that we can consider:
T1 - $ 1,572
T2 - $ 1609
T3 - $ 1,656
and
T4 - $ 1719
Now let's move on to the stop loss in case of further market declines:
SL1 - $ 1,549
SL2 - $ 1,506
SL3 - $ 1472
and
SL4 - $ 1,436
Looking at the CHOP indicator, we can see that in the 4H range we have a lot of energy, while the MACD indicator shows that we can enter a downward trend locally.

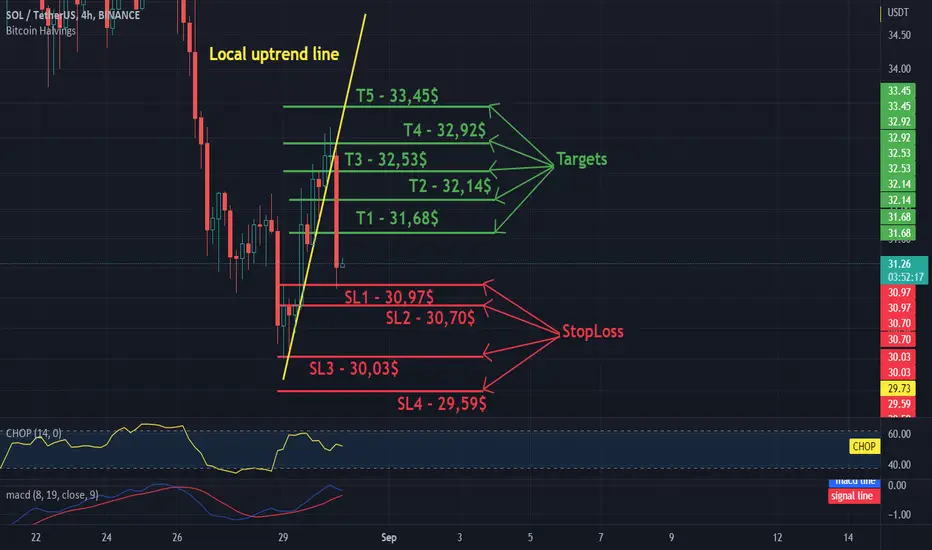
SOL/USDT on 4H interwal - Targets and StopLossHello everyone, let's take a look at the 4H SOL to USDT chart as you can see the price is moving below the local uptrend line.
Let's start by setting goals for the near future that we can consider:
T1 - $ 31.68
T2 - $ 32.14
T3 - $ 32.53
T4 - $ 32.92
and
T5 - $ 33.45
Now let's move on to the stop loss in case of further market declines:
SL1 - $ 30.97
SL2 - $ 30.70
SL3 - $ 30.03
and
SL4 - $ 29.59
Looking at the CHOP indicator, we can see that we still have a lot of energy in the 4H range, while the MACD indicator shows the local uptrend.
HOW TO SET STOP LOSS | 3 STRATEGIES EXPLAINED 📚
Hey traders,
In this post, we will discuss 3 classic trading strategies and stop placement rules.
1️⃣The first trading strategy is a trend line strategy.
The technique implies buying/selling the touch of strong trend lines, expecting a strong bullish/bearish reaction from that.
If you are buying a trend line, you should identify the previous low.
Your stop loss should lie strictly below that.
If you are selling a trend line, you should identify the previous high.
Your stop loss should lie strictly above that.
2️⃣The second trading strategy is a breakout trading strategy.
The technique implies buying/selling the breakout of a structure,
expecting a further bullish/bearish continuation.
If you are buying a breakout of a resistance, you should identify the previous low. Your stop loss should lie strictly below that.
If you are selling a breakout of a support, you should identify the previous high. Your stop loss should lie strictly above that.
3️⃣The third trading strategy is a range trading strategy.
The technique implies buying/selling the boundaries of horizontal ranges, expecting bullish/bearish reaction from them.
If you are buying the support of the range, your stop loss should strictly lie below the lowest point of support.
If you are selling the resistance of the range, your stop loss should strictly lie above the highest point of resistance.
As you can see, these stop placement techniques are very simple. Following them, you will avoid a lot of stop hunts and manipulations.
How do you set stop loss?
❤️If you have any questions, please, ask me in the comment section.
Please, support my work with like, thank you!❤️

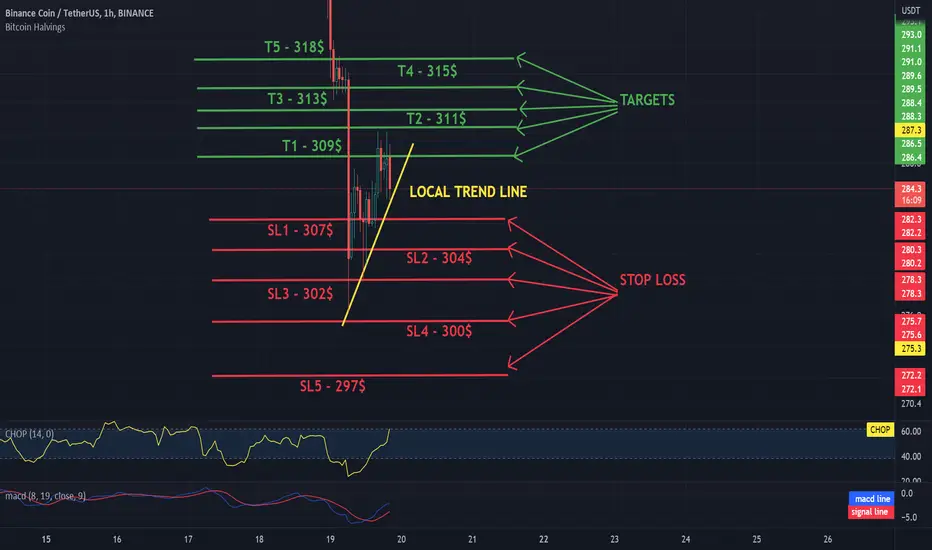
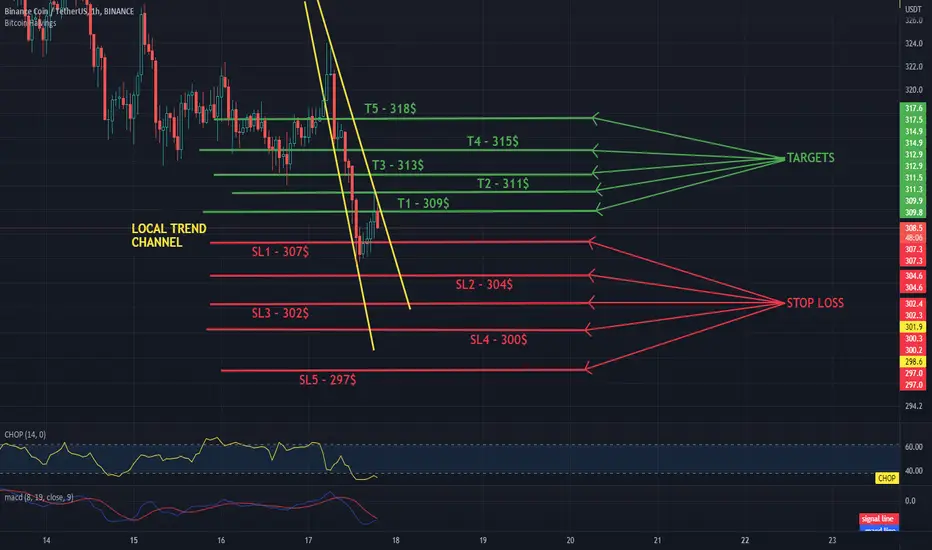
BNB / USDT 1H INTERVAL, STOPLOSS AND TARGETSHello everyone, let's take a look at the 1H BNB to USDT chart as you can see the price is moving with the local uptrend line.
Let's start by setting goals for the near future that we can consider:
T1 - $ 309
T2 - $ 311
T3 - $ 313
T4 - $ 315
and
T5 - $ 318
Now let's move on to the stop loss in case of further market declines:
SL1 - $ 307
SL2 - $ 304
SL3 - $ 302
SL4 - $ 300
and
SL5 - $ 297
Looking at the CHOP indicator, we can see that there is a lot of energy in the 1H range, while the MACD indicator shows a local uptrend.
ETH / USDT 1HChart - Targets And StopLossHello everyone, let's take a look at the 1H ETH to USDT chart as you can see the price is moving below the local downtrend line.
Let's start by setting goals for the near future that we can consider:
T1 - $ 1700
T2 - $ 1706
T3 - $ 1,712
T4 - $ 1722
and
T5 - $ 1732
Now let's move on to the stop loss in case of further market declines:
SL1 - $ 1,696
SL2 - $ 1,689
SL3 - $ 1,683
SL4 - $ 1,677
SL5 - $ 1,669
and
SL6 - $ 1,660
Looking at the CHOP indicator, we can see that in the 1H range the energy starts to rise, while the MACD indicator shows a local upward trend.

Short-term ADA / USDT analysis on the 1H intervalHello everyone, let's take a look at the 1H ADA to USDT chart as you can see the price is moving in the local downtrend channel.
Let's start by setting goals for the near future that we can consider:
T1 - $ 0.5378
T2 - $ 0.5421
T3 - $ 0.5456
T4 - $ 0.5490
and
T5 - $ 0.5540
Now let's move on to the stop loss in case of further market declines:
SL1 - $ 0.5319
SL2 - $ 0.5240
SL3 - $ 0.5178
SL4 - $ 0.5117
and
SL5 - $ 0.5027
Looking at the CHOP indicator, we can see that the energy has been consumed in the 1H range, while the MACD indicator shows that the blue line is approaching the intersection of the red line from the bottom, which would confirm the local uptrend.

Daily short review of BNB interval 1HHello everyone, let's take a look at the 1H BNB to USDT chart as you can see the price is moving in the local downtrend channel.
Let's start by setting goals for the near future that we can consider:
T1 - $ 309
T2 - $ 311
T3 - $ 313
T4 - $ 315
and
T5 - $ 318
Now let's move on to the stop loss in case of further market declines:
SL1 - $ 307
SL2 - $ 304
SL3 - $ 302
SL4 - $ 300
and
SL5 - $ 297
Looking at the CHOP indicator, we can see that energy has been consumed in the 1H range, while the MACD indicator shows that the blue line is approaching the intersection of the red line from the bottom, which would confirm the local upward trend.
ETHUSDT Short Term Analysis - Targets and StoplossHello everyone, let's take a look at the 1H ETH to USDT chart as you can see the price is moving in the local downtrend channel.
Let's start by setting goals for the near future that we can consider:
T1 - $ 1,858
T2 - $ 1,870
T3 - $ 1,882
T4 - $ 1,898
and
T5 - $ 1,921
Now let's move on to the stop loss in case of further market declines:
SL1 - $ 1,836
SL2 - $ 1,816
SL3 - $ 1798
SL4 - $ 1783
and
SL5 - $ 1,759
Looking at the CHOP indicator, we can see that in the 1H range, energy has been used, while the MACD indicator shows that the blue line is approaching the intersection of the red line from the bottom, which would confirm the local upward trend.

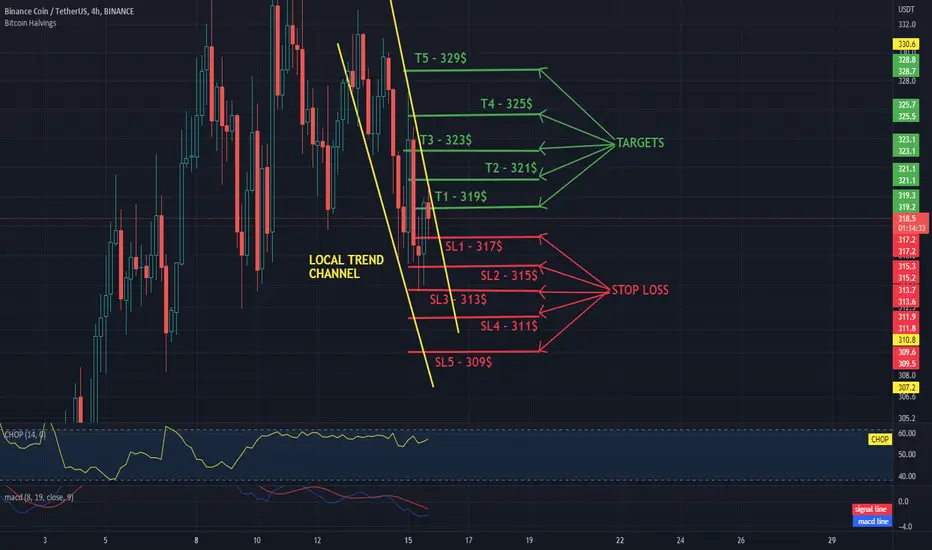
Daily review of BNB interval 4HHello everyone, let's take a look at the 4H BNB to USDT chart as you can see the price is moving in the local downtrend channel.
Let's start by setting goals for the near future that we can consider:
T1 - $ 319
T2 - $ 321
T3 - $ 323
T4 - $ 325
and
T5 - $ 329
Now let's move on to the stop loss in case of further market declines:
SL1 - $ 317
SL2 - $ 315
SL3 - $ 313
SL4 - $ 311
and
SL5 - $ 309
Looking at the CHOP indicator, we can see that there is a lot of energy in the 4H range and the MACD indicator confirms the local downward trend.
Daily review of ETH interval 4HHello everyone, let's take a look at the 4H ETH to USDT chart as you can see the price is moving below the local downtrend line.
Let's start by setting goals for the near future that we can consider:
T1 - $ 1,897
T2 - $ 1,913
T3 - $ 1,926
T4 - $ 1,939
and
T5 - $ 1,957
Now let's move on to the stop loss in case of further market declines:
SL1 - $ 1,880
SL2 - $ 1,864
SL3 - $ 1,847
SL4 - $ 1,823
and
SL5 - $ 1793
Looking at the CHOP indicator, we can see that in the 4H range we have a lot of energy and the MACD indicator shows a local downward trend.

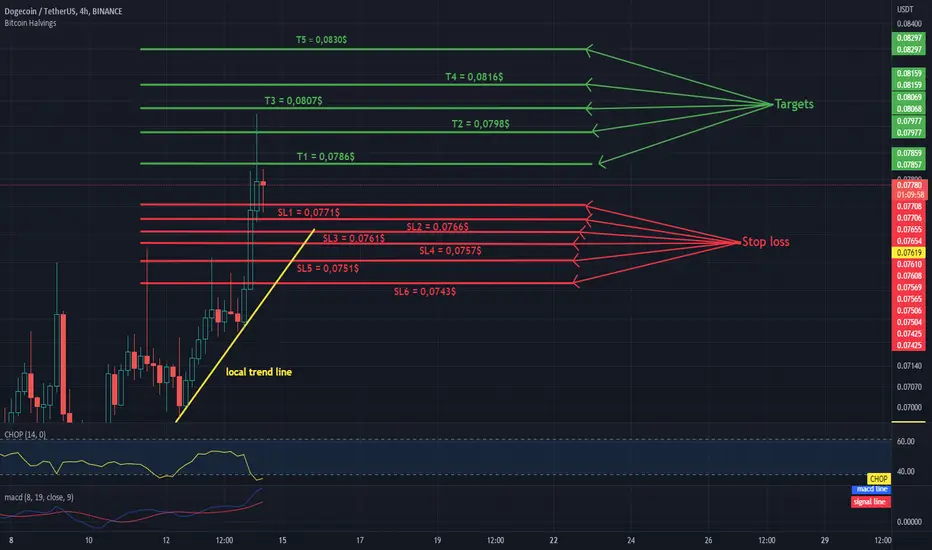
DOGEUSDT - review of the chart on the 4H intervalHello everyone, let's take a look at the 4H DOGE to USDT chart as you can see the price is moving above the local uptrend line.
Let's start by setting goals for the near future that we can consider:
T1 = $ 0.0786
T2 = $ 0.0798
T3 = $ 0.0807
T4 = $ 0.0816
and
T5 = $ 0.0830
Now let's move on to the stop loss in case of further market declines:
SL1 = $ 0.0771
SL2 = $ 0.0766
SL3 = $ 0.0761
SL4 = $ 0.0757
SL5 = $ 0.0751
and
SL6 = $ 0.0743
Looking at the CHOP indicator, we can see that in the 4H range the energy was used and the MACD indicator confirms the local upward trend.
CRO / USDT Short on 1H IntervalHello everyone, let's take a look at the 1H CRO to USDT chart as you can see the price is moving below the local uptrend channel.
Let's start by setting goals for the near future that we can consider:
T1 = $ 0.1548
T2 = $ 0.1555
T3 = $ 0.1560
T4 = $ 0.1566
and
T5 = $ 0.1573
Now let's move on to the stop loss in case of further market declines:
SL1 = $ 0.1541
SL2 = $ 0.1533
SL3 = $ 0.1525
SL4 = $ 0.1521
and
SL5 = $ 0.1516
Looking at the CHOP indicator, we can see that in the 1H range we have very little energy and the MACD indicator shows a local downward trend.

BNB / BTC on 1H Interval - Targets and StoplossHello everyone, let's take a look at the 1H BNB to BTC chart as you can see the price is moving below the local downtrend line.
Let's start by setting goals for the near future that we can consider:
T1 - 0.013315
T2 - 0.013371
T3 - 0.013422
T4 - 0.013469
T5 - 0.013538
and
T6 - 0.013627
Now let's move on to the stop loss in case of further market declines:
SL1 - 0.013237
SL2 - 0.013177
SL3 - 0.013135
SL4 - 0.013087
and
SL5 - 0.013021
Looking at the CHOP indicator, we can see that in the 1H range we have a lot of energy and the MACD indicator shows a local upward trend.

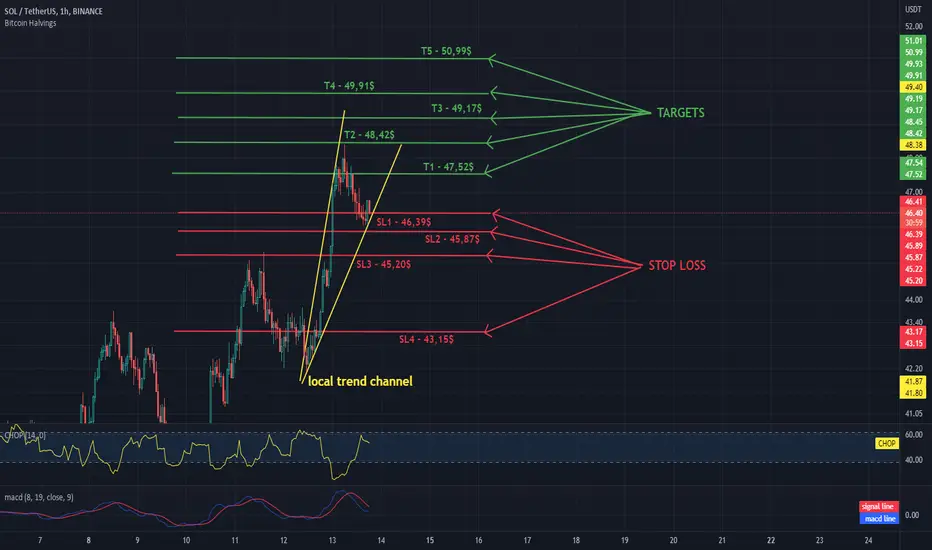
SOL - USDT 1HChart, targets and stoplossHello everyone, let's take a look at the 1H SOL to USDT chart as you can see the price is moving in the channel denoted by the yellow lines.
Let's start by setting goals for the near future that we can consider:
T1 - $ 47.52
T2 - $ 48.42
T3 - $ 49.17
T4 - $ 49.91
and
T5 - $ 50.99
Now let's move on to the stop loss in case of further market declines:
SL1 - $ 46.39
SL2 - $ 45.87
SL3 - $ 45.20
and
SL4 - $ 43.15
Looking at the CHOP indicator, we can see that in the 1H range we still have a lot of energy for further moves, and the MACD indicator shows a local downward trend.