EUR-USD Free Signal! Sell!
Hello,Traders!
EUR-USD broke the horizontal
Level of 1.1300 which is now
A resistance and went down
So the breakout is confirmed
And now the pair is retesting
The resistance so as we are
Bearish biased we will be
Able to to enter a short trade
On Monday with the Take
Profit of 1.1197 and the
Stop Loss of 1.1311
Sell!
Comment and subscribe to help us grow!
Check out other forecasts below too!
Disclosure: I am part of Trade Nation's Influencer program and receive a monthly fee for using their TradingView charts in my analysis.
Stoploss

BTC/USD 1D chart ReviewHello everyone, let's look at the 1D BTC chart for USD, in this situation we can see how the price came out of a strong downward trend, which gave a strong upward movement for the price. Going further, let's check the places of potential target for the price:
T1 = 96592 $
T2 = 101878 $
Т3 = 109442 $
Let's go to Stop-Loss now in case of further declines on the market:
SL1 = 92363 $
SL2 = 89028 $
SL3 = 83498 $
SL4 = 79350 $
Looking at the RSI indicator, we can see that despite a small price change, the indicator strongly reacted what potentially can give energy to further price increases in the coming weeks.

Still a Good Buy but with proper Stoploss.Still a Good Buy but with proper
Stoploss.
Immediate Resistance is around 134 - 135
Crossing it may take the price towards
140 - 144 initially. & then the Double Bottom
will play and may hit 160+

US30: Local Bearish Bias! Short!
My dear friends,
Today we will analyse US30 together☺️
The market is at an inflection zone and price has now reached an area around 41,170 where previous reversals or breakouts have occurred. And a price reaction that we are seeing on multiple timeframes here could signal the next move down so we can enter on confirmation, and target the next key level of 41,039..Stop-loss is recommended beyond the inflection zone.
❤️Sending you lots of Love and Hugs❤️

LTC/USDT 12H chart reviewHello everyone, let's look at the 12H LTC chart to USDT, in this situation we can see how the price came out of the downward trend and currently you can see the movement of the newly created upward trend line. Going further, let's check the places of potential target for the price:
T1 = $ 89
T2 = $ 97
Т3 = $ 109
Let's go to Stop-Loss now in case of further declines on the market:
SL1 = 85 $
SL2 = $ 77
SL3 = $ 67
SL4 = $ 63
Looking at the RSI indicator, we see
Return to the lower limit, which can potentially give energy to make the price re -perform upward movement.

BNB/USDT 1D chart Hello everyone, let's look at the 1D BNB chart to USDT, in this situation we can see how the price moves in a triangle where there is still space to keep the currently ongoing side trend. Going further, let's check the places of potential target for the price:
T1 = $ 599
T2 = $ 617
Т3 = $ 644
Let's go to Stop-Loss now in case of further declines on the market:
SL1 = $ 580
SL2 = $ 559
SL3 = $ 542
SL4 = 521 $
Looking at the MacD indicator, you can see an attempt to return to the upward trend, but here we do not have clear confirmation, which is why it is worth being careful.

MKR/USDT 4h chart ReviewHello everyone, let's look at the 4H MKR chart to USDT, in this situation we can see how the price moves on the created upward trend line. Going further, let's check the places of potential target for the price:
T1 = $ 1576
T2 = 1657 $
Т3 = 1714 $
Let's go to Stop-Loss now in case of further declines on the market:
SL1 = $ 1529
SL2 = $ 1499
SL3 = $ 1450
SL4 = 1372 $
Looking at the RSI indicator, we see
How slight relaxations give space for further increases by living in the upward trend of price.

EUR-JPY Free Signals! Sell!
Hello,Traders!
EUR-JPY keeps growing
But the pair will soon hit
A horizontal resistance
Of 164.930 from where
We can enter a short trade
With the Target Level of 163.778
And the Stop Loss of 165.018
Sell!
Comment and subscribe to help us grow!
Check out other forecasts below too!
Disclosure: I am part of Trade Nation's Influencer program and receive a monthly fee for using their TradingView charts in my analysis.

Mastering Stop Losses: How Not to Trigger Them at the Worst TimeThere are few things more humiliating in trading than setting a stop loss… only to have the market tag it by a hair’s breadth before rocketing in the direction you knew it was going to go.
Oftentimes (hopefully not too often), stop losses are the financial equivalent of slipping on a banana peel you placed yourself.
But stop losses aren't the enemy. Their placement, however, could be.
If you’ve ever rage-quit your chart after being wicked out by a fakeout, this one’s for you. Let’s talk about how to master stop losses — without feeling like the market is personally out to get you.
😬 The Necessary Evil: Why Stop Losses Exist
First, let's acknowledge the elephant in the room: stop losses sometimes sting. They're like smoke alarms. Annoying when they chirp over burnt toast, lifesaving when there’s an actual fire.
The purpose of a stop loss isn’t to predict exactly when you’re wrong — it’s to limit how wrong you can be. It's the difference between losing a quick battle and losing the whole war.
Trading without a stop loss is like walking a tightrope without a net — all fine until it’s not.
🤔 The Amateur Mistake: "Where Should I Put My Stop?"
A lot of traders approach stop-loss placement like they're picking lottery numbers: random, emotional, hopeful.
"I’ll just slap it 10 pips below my entry. Seems safe."
But the market doesn’t care about your preferred round numbers. It cares about liquidity, volatility, and structure, regardless if it's the forex market , the crypto space , or the biggest stock gainers out there.
Good stop-loss placement is about logic, not luck. It's about asking:
Where is my trade idea invalidated?
Where does the market prove me wrong?
If you're placing stops based on how much you're "willing to lose" rather than where your setup breaks down, you’re setting yourself up to be triggered — emotionally and financially.
💪 The Art of "Strategic Suffering"
Good stops hurt a little when they’re hit. That’s how you know they were placed properly.
Stops shouldn't be so tight they get hit on routine noise, but they also shouldn't be so far away that you need therapy if it fails. Think of it as strategic suffering: you’re accepting controlled pain now to avoid catastrophic pain later.
Legendary trader Paul Tudor Jones famously said: “The most important rule of trading is to play great defense, not great offense.”
🤓 Where Smart Traders Place Their Stops
Want to know where smart money hides their stops? It's not random. It’s calculated.
Below key swing lows for long trades (how much below depends on the risk-reward ratio they’ve chosen to pursue)
Above key swing highs for shorts (how much above is, again, tied to the risk-reward ratio)
Outside of obvious support/resistance zones (also, risk-reward plays a role)
In other words: start thinking like the market. Where would a big player have to exit because the structure is truly broken? That’s where you want your stop.
👀 Avoiding the Stop-Hunter’s Trap
Is stop-hunting real? Oh yes. And no, it’s not personal. You're just very readable if you park your stops in obvious, lazy places.
The market loves liquidity. Price often pokes below swing lows or above highs because that’s where the money is. Stops create liquidity pockets that big players exploit to enter their trades at better prices.
So how do you avoid becoming easy prey?
Give stops a little breathing room past obvious levels.
Use volatility measures like ATR to set dynamic buffers.
Respect structure, not just random dollar/pip amounts.
A good stop is hidden in plain sight but protected by logic, not hope.
⚖️ Sizing Smarter: Risk per Trade Matters More Than Stop Distance (What’s Risk-Reward Ratio?)
Here’s where many traders mess up: they think tighter stops are always better. Wrong. Your stop distance and your position size are a package deal. If your trade idea requires a wider stop to be valid, your position size should shrink accordingly.
Trying to cram your usual size into a wide stop setup is how small losses turn into account-threatening disasters.
Hedge fund pioneer George Soros once said: “It’s not whether you’re right or wrong that's important, but how much you make when you're right and how much you lose when you're wrong.”
Master your sizing relative to your stop, and you master your survival. In other words, the risk-reward ratio should be playing a key role in placing your stop losses.
🥤 Mental Stops vs Hard Stops: Pick Your Poison
Some traders swear by mental stops: “I'll get out when it hits this level.” Others use hard stops: set-and-forget protective orders baked into the system.
Both have pros and cons:
Mental stops allow flexibility but risk emotional sabotage.
Hard stops guarantee protection but can trigger on sudden, hollow wicks.
Pro tip? Use hard stops if you’re new or undisciplined. You don’t want to be the guy saying “I’ll close it soon...” while watching your unrealized loss grow a second head.
🤯 Stop-Loss Psychology: It’s You, Not the Market
If you find yourself constantly blaming “stop-hunting whales” or “market manipulation” every time you get tagged out... maybe it’s not them. Maybe it's your stop placement.
Discipline in trading isn’t just about clicking buttons at the right time. It’s about planning for the tough times—and sticking to your plan even when it feels bad.
❤️ Final Thought: Love Your Stops (Or at Least Respect Them)
Stop losses aren't your enemy. They're your overprotective friends. Sometimes they’ll throw you out of a trade you "knew" would come back. But more often, they’ll save you from very dangerous outcomes.
Mastering stop losses isn't about never getting stopped out. It’s about getting stopped out properly — with dignity, with minimal damage, and with your account intact.
In trading, pain is inevitable. Wipeouts are optional.
Your move: How do you manage your stops — and have you ever been wicked out so badly you considered quitting trading? Drop your best (or worst) stop-loss stories below.

LINK/USDT 4H Chart ReviewHello everyone, let's look at the 4H chart LINK to USDT, in this situation we can see how the price was moving in a downward channel, from which we saw an exit to the top and the formation of a new local uptrend line.
Let's start by defining the targets for the near future that the price has to face:
T1 = 15.08 USD
T2 = 16.87 USD
Т3 = 17.93 USD
Т4 = 19.07 USD
Now let's move on to the stop-loss in case the market continues to fall:
SL1 = 13.98 USD
SL2 = 13.12 USD
SL3 = 11.74 USD
SL4 = 10.76 USD
SL5 = 9.48 USD
If we look at the RSI indicator we can see how the price correction gave a strong rebound on the indicator, which could potentially give strength for new growth.

HH HLMonthly Closing is good.
Weekly closing above 29.50 would
be very positive sign.
32 is the Immediate Resistance &
if 36.10 is Crossed & Sustained with
Good Volumes, we may witness 40 - 45.

ATOM/USDT review chart 4HHello everyone, let's look at the 4H ATOM chart for USDT, in this situation we can see how the price has affected from the upper limit of the downward trend channel, however, staying in the upper part of the channel. Going further, let's check the places of potential target for the price:
T1 = $ 4.79
T2 = $ 5,26
Т3 = 5.63 $
Let's go to Stop-Loss now in case of further declines on the market:
SL1 = $ 4.29
SL2 = $ 4.02
SL3 = $ 3,57
Looking at the RSI indicator, you can see a healthy relaxation crossing the lower limit, which produces space for a potentially new growth movement. The MacD indicator that has returned to the center of the range, which also creates potential for upward movement.

ETC/USDT 4h chart Hello everyone, let's look at the 4h graph etc to USDT, in this situation we can see how the price came out of the top of the lasting downward trend. Going further, let's check the places of potential target for the price:
T1 = $ 17.44
T2 = $ 18.75
Т3 = 20.73 $
T4 = 22.48 $
Let's go to Stop-Loss now in case of further declines on the market:
SL1 = $ 16.25
SL2 = $ 15.05
SL3 = $ 13.74
SL4 = $ 12.66
Looking at the RSI indicator, we see
As we entered the upper part of the range again, which apparently affected the slow price of the price.

AUD-CAD Free Signal! Sell!
Hello,Traders!
AUD-CAD shot up sharply
But the pair failed to break
A horizontal resistance
Level of 0.8880 and we are
Already seeing a local pullback
Which is likely to turn into a
Local correction on Monday
So we can enter a short trade
With the Take Profit of 0.8779
And the Stop Loss of 0.8887
Sell!
Comment and subscribe to help us grow!
Check out other forecasts below too!
Disclosure: I am part of Trade Nation's Influencer program and receive a monthly fee for using their TradingView charts in my analysis.

LINK/USDT 8H - targets and stoplossHello everyone, let's look at the 8h chart LINK to USDT, in this situation we can see how the price has come out on top from the local downtrend line and how it is currently moving in a local sideways trend.
Let's start by defining the targets for the near future that the price has to face:
T1 = 12.65 USD
T2 = 13.13 USD
Т3 = 13.87 USD
Т4 = 14.40 USD
Now let's move on to the stop-loss in case the market continues to fall:
SL1 = 11.91 USD
SL2 = 11.05 USD
SL3 = 10.36 USD
SL4 = 9.66 USD
The MACD indicator shows an attempt to return to the uptrend, but here we can see a struggle that gives a sideways trend on the chart.

GBP-NZD Local Long! Buy!
Hello,Traders!
GBP-NZD fell down strongly
Through the first line of
Support but a strong support
Was hit around 2.2160 from
Where a local bullish rebound
Is likely to happen on Monday
So we will be able to enter
A long trade with the Take
Profit of 2.2300 and the
Stop Loss of 2.2123
Buy!
Comment and subscribe to help us grow!
Check out other forecasts below too!
Disclosure: I am part of Trade Nation's Influencer program and receive a monthly fee for using their TradingView charts in my analysis.

Trading Mindset
I Am a Software Developer and a Passionate Trader
Over the past five years, I have explored nearly every aspect of trading—technical analysis, intraday trading, MTF, pre-IPO investments, options selling, F&O, hedging, swing trading, long-term investing, and even commodities like gold and crude oil.
Through this journey, I realized that **technical analysis is only about 20% of the equation**. The real game is **psychology and mindset**.
I have distilled my learnings into concise points below—insights that have shaped my approach and will continue to guide me in my version 2.0 of trading. I hope they prove valuable to you as well.
---
### **Position Sizing**
One of the most important aspects of trading is choosing the right position size. Your trade should never be so large that it causes stress or worry. Keep it at a level where you can stay calm, no matter how the market moves.
### **Set Stop-Loss and Target Before Placing a Trade**
Decide in advance when you will exit a trade—both at a loss (**stop-loss**) and at a profit (**target**). This helps maintain emotional balance, preventing extreme excitement or frustration.
### **How to Calculate Position Size**
- Use **technical analysis** to identify your **stop-loss** and **target**.
- Example: If CMP is ₹100 and your stop-loss is at ₹94 (₹6 risk per share), determine your risk tolerance:
- ₹3,000 risk ➝ **500 shares** (₹3,000 ÷ ₹6)
- ₹1,200 risk ➝ **200 shares** (₹1,200 ÷ ₹6)
- Adjust quantity based on how much you're willing to risk.
### **Setting Target Price & Risk-Reward Ratio**
The most important factor in setting a target is the **risk-reward ratio**. If your stop-loss is ₹6, your target should be at least **₹6, ₹9, or ₹12**.
### **Why Is Risk-Reward Important?**
Let’s say you take **10 trades**—5 go in your favor, and 5 go against you. If your risk-reward ratio isn’t favorable, you could end up in a loss.
Example:
- You **lose ₹6** in two trades → ₹12 total loss
- You **gain ₹3** in three trades → ₹9 total profit
- **Net result: -₹3 loss**
To ensure profitability, your **reward should be equal to or greater than your risk**. A **1.5x or 2x risk-reward ratio** is ideal.
### **Flexibility in Targets**
Even when the price reaches **Target 1**, you can **book partial profits** and let the rest run with a **trailing stop-loss**.
---
### **Managing Multiple Trades**
This is **very important**. If you're a beginner, **limit yourself to 2 trades**, and even if you're a pro, **avoid more than 3-5 positions**.
**Example:** If you have **₹2 lakh**, make sure you have **only 2 trades open at a time**. Add a third stock **only when you close another position**.
---
### **How to Deploy Capital**
Patience is key. If you have **₹1 lakh**, **divide it into 4-5 parts** and buy **in small chunks over time**.
**Why?**
The **nature of stocks** is to move in waves—rising, facing profit booking, then breaking previous highs. Instead of investing everything at once, **buy in staggered amounts** to ensure your **average price stays close to CMP**.
---
### **Avoid Market Noise**
When trading, **stay in your zone**.
Social media posts can make you feel **slow compared to others**, but they don't show the full picture. Avoid distractions like:
- Direct stock tips from **news channels**
- P&L snapshots from traders
- Following too many **analysts on social media**
Instead, **listen to expert views**, but stay disciplined with **your own strategy**.
---
### **Stock Selection**
Stock selection has **two elements—technical and fundamental** (I'll write a separate post on this).
Always **buy a stock that you can hold even in your darkest times**.
**Example:**
- Choose **blue-chip stocks** with **high market caps & strong promoter holdings**
- Never **buy a stock just because it’s in momentum**
- If a stock **turns into a forced SIP**, it’s not a good buy
Pick stocks with **a long-term story**—even if you fail to exit at the right time, you should be comfortable holding them.
---
### **Accept That It’s the Market, Not You**
Many traders fail because they **don’t admit that the market is unpredictable**.
Losses happen because of volatility, not necessarily poor strategy. **Example:**
- You lose a trade and **try improving your method** but face another hit
- Some losses **are simply beyond your control**
Most of what happens in the market is **not in your hands**—including stop-loss triggers. **Accept this reality,** and focus on **risk management** instead of revenge trading.
---
### **Keep Separate Trading & Investment Accounts**
Trading and investing **are different**. If you keep them **in the same account**, you’ll:
- **Book small profits** on investments
- **Hold short-term trades in losses**
Having **separate accounts** keeps **your goals clear**.
---
### **Don’t Let the Market Dominate You**
Even full-time traders **shouldn’t obsess over the market**.
Limit your **screen time to 2-3 hours during market hours**.
**Why?**
- You can’t **act on global markets until 9:15 AM IST**
- Even if a **war or tariff issue** arises, **you can’t do anything until market open**
- Overthinking leads to **over-trading**, which drains money
Instead, **invest time in developing new skills**.
---
### **Do What Suits You, Not Others**
If you're good at **swings, stick to swings**. If you're good at **intraday, do intraday**.
Don't follow **what works for a friend—trade based on what suits you**.
---
### **Avoid FOMO**
Don't **stress** if a stock jumps **20% in a day**.
Stock **accumulation zones, demand/supply areas, profit booking**, and **retests** happen **regularly**—opportunities will always come.
Even traders who claim they made **20% in a day** **don’t share how often they got trapped chasing stocks**.
---
### **Stop-Loss Is Your Best Friend**
No, stop-loss is your **best friend for life**.
**Example:**
- Suppose you **enter 10 trades in a month**.
- **6 do well** and you book profits.
- **4 go against you**, but instead of exiting, **you hold** because you believe they’ll recover.
- Next month, you **repeat this cycle**—adding more positions.
Over time, **this builds a portfolio of lagging stocks**, and suddenly, **your losses dominate your portfolio**.
---
Even Experts Face Losses
Even professionals with **advanced research teams lose money**.
Retail traders often **believe they can avoid losses by analyzing a few ratios**, but **losses are part of trading**.
A stop-loss ensures **you stay in the game long-term**—instead of holding onto losing trades indefinitely.
---
Take a Break & Restart
Taking breaks is **crucial**. If everything is going wrong, **don’t hesitate to press the reset button**—step back, analyze, and refine your approach. A fresh mindset leads to better trading decisions. (I’ll write a detailed post on this soon.)

ABCD Pattern Intact
Monthly Closing above 388 would Trigger
more positivity towards 430 - 440.
465 is Important Resistance.
remember, Crossing & Sustaining 465 with
Huge Volumes may exposes New Highs towards
600+
However, it should not break 320 in
worst case.

BNB/USDT 1D chartHello everyone, let's look at the 1D BNB chart to USDT, in this situation we can see how the price came closer to the local lines of the downward trend. Going further, let's check the places of potential target for the price:
T1 = $ 607
T2 = $ 632
Т3 = 660 $
T4 = $ 744
Let's go to Stop-Loss now in case of further declines on the market:
SL1 = $ 553
SL2 = $ 521
SL3 = $ 500
SL4 = 474 $
Looking at the RSI indicator, we see
As we bounced from the inside of the range, remaining in the lower part, which gives room for potential increases.

Stoploss of 109500 intact!Immediate Support 114200 - 114300
If 109000 is broken, we may witness heavy selling
pressure dragging the Index towards 105000 - 106000.

LIMIT ORDER - $SERAPH/USDTLIMIT ORDER - $SERAPH/USDT
Direction: #Long 🟢
Entry Price: 0.19229
Stop Loss: 0.17019
Target 1: 0.20862
Target 2: 0.22494
Target 3: 0.24127
Target 4: 0.25759
Target 5: 0.27392

EUR-USD Free Signal! Buy!
Hello,Traders!
EUR-USD made a nice
Bearish correction from the
Resistance above and hit
A horizontal support level
Of 1.0934 from where
We can go long on Monday
With the Take Profit of 1.0996
And the Stop Loss of 1.0906
Buy!
Comment and subscribe to help us grow!
Check out other forecasts below too!
Disclosure: I am part of Trade Nation's Influencer program and receive a monthly fee for using their TradingView charts in my analysis.

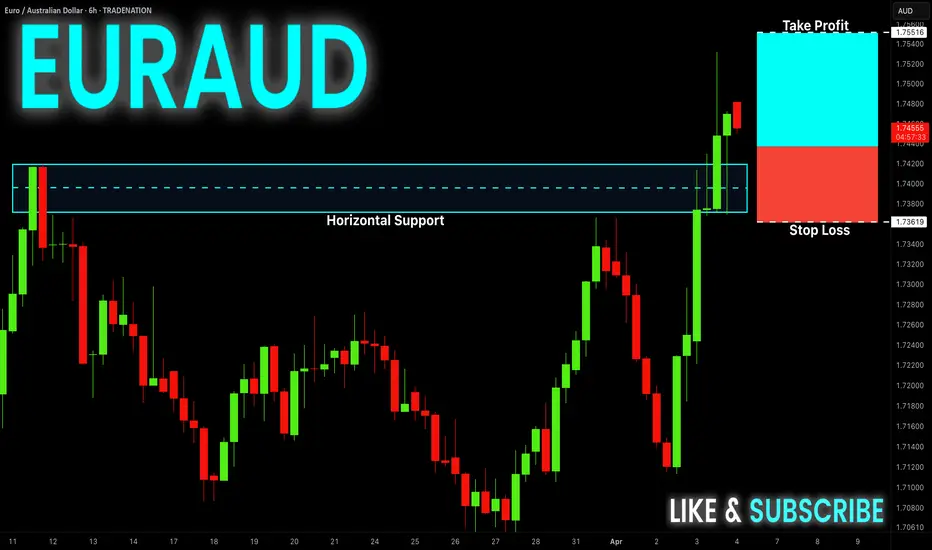
EUR-AUD Free Signal! Buy!
Hello,Traders!
EUR-AUD is trading in a
Strong uptrend and the
Pair made a bullish breakout
And a retest of the key
Horizontal level of 1.7420
And is going up now so
We can enter a long trade
On a local pullback with
The Take Profit of 1.7551
And the Stop Loss of 1.7362
Buy!
Comment and subscribe to help us grow!
Check out other forecasts below too!
Disclosure: I am part of Trade Nation's Influencer program and receive a monthly fee for using their TradingView charts in my analysis.