FTM / USDT 1H IntervalHello everyone, let's take a look at the 1H FTM to USDT chart as you can see the price has come up from the local downtrend channel.
Let's start by setting goals for the near future that we can consider:
T1 - $ 0.3997
T2 - $ 0.4092
T3 - $ 0.4169
T4 - $ 0.4248
and
T5 - $ 0.4361
Now let's move on to the stop loss in case of further market declines:
SL1 - $ 0.3947
SL2 - $ 0.3898
SL3 - $ 0.3860
SL4 - $ 0.3821
and
SL5 - $ 0.3766
Looking at the CHOP indicator, we can see that in the 1H interval, we have a lot of energy for the next move, and the MACD indicator indicates a shift to an upward trend.
Stoploss

SOL - USDT 1HChart, targets and stoplossHello everyone, let's take a look at the 1H SOL to USDT chart as you can see the price has come sideways from the uptrend channel.
Let's start by setting goals for the near future that we can consider:
T1 - $ 44.85
T2 - $ 45.73
T3 - $ 46.47
T4 - $ 47.2
and
T5 - $ 48.23
Now let's move on to the stop loss in case of further market declines:
SL1 - $ 43.56
SL2 - $ 43.02
SL3 - $ 42.48
SL4 - $ 41.68
and
SL5 - $ 40.72
Looking at the CHOP indicator, we can see that in the 1H range we have more and more energy and the MACD indicator shows a local downward trend.

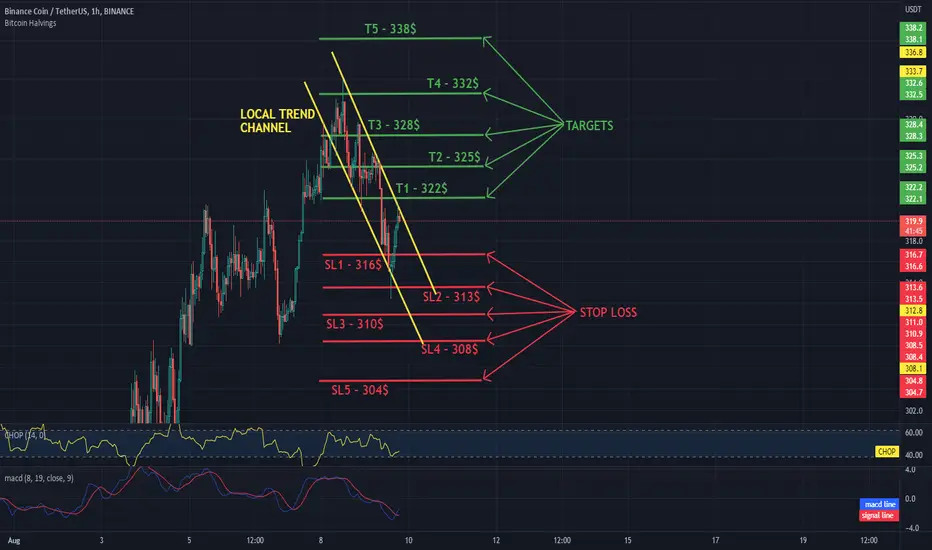
Daily BNB SHORT review 1HHello everyone, let's take a look at the 1H BNB to USDT chart as you can see the price is trying to come out of the local downtrend channel.
Let's start by setting goals for the near future that we can consider:
T1 - $ 322
T2 - $ 325
T3 - $ 328
T4 - $ 332
and
T5 - $ 338
Now let's move on to the stop loss in case of further market declines:
SL1 - $ 316
SL2 - $ 313
SL3 - $ 310
SL4 - $ 308
and
SL5 - $ 304
Looking at the CHOP indicator, we can see that in the 1H range the energy slowly starts to rise, while the MACD indicator shows a local upward trend.
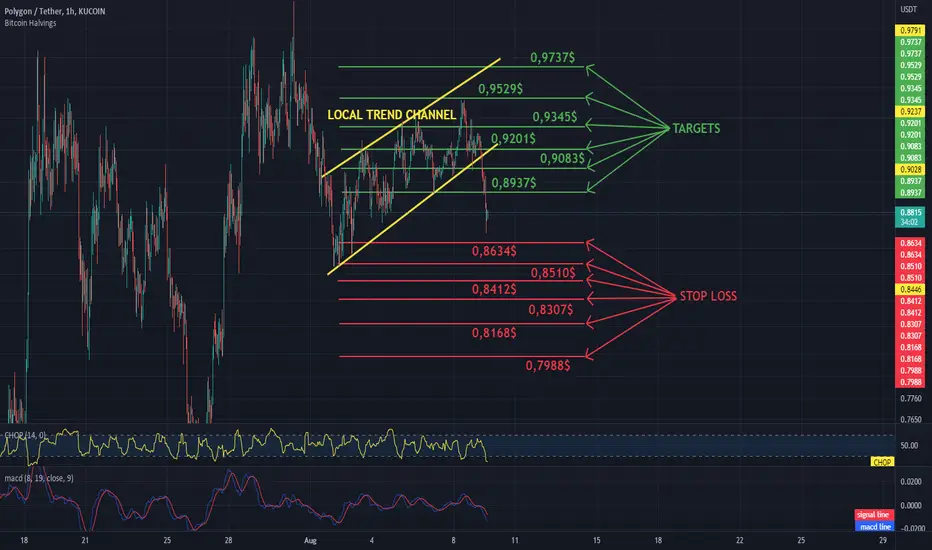
MATIC/USDT - Targets and StoplossHello everyone, let's take a look at the 1H MATIC to USDT chart as you can see the price has dropped below the local uptrend channel.
Let's start by setting goals for the near future that we can consider:
T1 = $ 0.8937
T2 = $ 0.9083
T3 = $ 0.9201
T4 = $ 0.9345
T5 = $ 0.9529
and
T6 = $ 0.9737
Now let's move on to the stop loss in case of further market declines:
SL1 = $ 0.8634
SL2 = $ 0.8510
SL3 = $ 0.8412
SL4 = $ 0.8307
SL5 = $ 0.8168
and
SL6 = $ 0.7988
Looking at the CHOP indicator, we can see that in the 1H band the energy has been used for the current price decline, and the MACD indicator confirms the local downward trend.
DOGE / USDT 1D IntervalHello everyone, let's take a look at the 1D DOGE to USDT chart as you can see the price is moving above the local uptrend line.
Let's start by setting goals for the near future that we can consider:
T1 = $ 0.06989
T2 = $ 0.07095
T3 = $ 0.07269
and
T4 = $ 0.07477
Now let's move on to the stop loss in case of further market declines:
SL1 = $ 0.06891
SL2 = $ 0.06819
SL3 = $ 0.06747
SL4 = $ 0.06633
SL5 = $ 0.06507
and
SL6 = $ 0.06117
Looking at the CHOP indicator, we can see that in the 1-day range we have a lot of energy and the MACD indicator shows a local upward trend.

ZRX Stop Loss huntingThere was a clean bounce off the Fibonacci support. Many buyers consider that a good point for a stop loss, although stop loss hunters are likely to push the price just below the 61.8% Fibs. After that, the uptrend should resume.

How to open positions (workflow)?In the picture you can see my pyramiding staggered stop strategy.
Low at comments for a link where you can read more about this!

SHORT ETH / USDT - 30M INTERVALHello everyone, let's take a look at the 30M ETH to USDT chart as you can see the price is moving below the local downtrend line.
Let's start by setting goals for the near future that we can consider:
T1 - $ 1,650
T2 - $ 1,676
T3 - $ 1,696
T4 - $ 1716
and
T5 - $ 1,747
Now let's move on to the stop loss in case of further market declines:
SL1 - $ 1608
SL2 - $ 1,599
SL3 - $ 1,582
and
SL4 - $ 1568
Looking at the CHOP indicator, we can see that in the 30-minute interval most of the energy has been used, and the MACD indicator shows that we are in the local downtrend.

ETH - USDT, 15M interval SHORTHello everyone, let's take a look at the 15M ETH to USDT chart as you can see the price is moving above the local uptrend line.
Let's start by setting goals for the near future that we can consider:
T1 - $ 1,757
T2 - $ 1,785
and
T3 - $ 1,865
Now let's move on to the stop loss in case of further market declines:
SL1 - $ 1731
SL2 - $ 1717
SL3 - $ 1704
SL4 - $ 1,693
and
SL5 - $ 1,676
Looking at the CHOP indicator, we can see that the energy has been used on the 15-minute interval, and the MACD indicator shows a local upward trend.

DOT SHORT 15M Hello everyone, let's take a look at the 15M DOT to USDT chart as you can see the price is moving below the local downtrend line.
Let's start by setting goals for the near future that we can consider:
T1 - $ 8.64
T2 = $ 8.67
T3 = $ 8.70
T4 = $ 8.73
and
T5 = $ 8.76
Now let's move on to the stop loss in case of further market declines:
SL1 = $ 8.57
and
SL2 = $ 8.51
Looking at the CHOP indicator, we can see that there is a lot of energy in the 15M range, while the MACD indicator shows a local downward trend.

BNB/USDT targets and stoploss - SHORTHello everyone, let's take a look at the 15M BNB to USDT chart as you can see the price is moving above the local uptrend line.
Let's start by setting goals for the near future that we can consider:
T1 - $ 266
T2 - $ 267
T3 - $ 268
T4 - $ 270
and
T5 - $ 271
Now let's move on to the stop loss in case of further market declines:
SL1 - $ 261
SL2 - $ 257
SL3 - $ 253
SL4 - $ 247
and
SL5 - $ 240
Looking at the CHOP indicator, we can see that in the 15-minute interval we are gaining more and more energy, and the MACD indicator indicates a change in the trend.

15M Interwal - SOL/USDT - Targets and StoplossHello everyone, let's take a look at the 15M SOL to USDT chart as you can see the price has broken the local downtrend line and is now back right on top of it.
Let's start by setting goals for the near future that we can consider:
T1 - $ 39.58
T2 - $ 41.05
T3 - $ 42.58
T4 - $ 44.65
and
T5 - $ 47.40
Now let's move on to the stop loss in case of further market declines:
SL1 - $ 39.01
SL2 - $ 38.16
SL3 - $ 37.52
SL4 - $ 36.79
and
SL5 - $ 35.91
Looking at the CHOP indicator, we can see that the energy has been used up on the 15-minute interval, and the MACD indicator shows a local upward trend.

ETH rebounds after the last correction!Hello everyone, let's take a look at the 4H ETH to USDT chart as you can see the price is moving in the uptrend channel.
Let's start by setting goals for the near future that we can consider:
T1 - $ 1,679
T2 - $ 1,898
and
T3 - $ 2,175
Now let's move on to the stop loss in case of further market declines:
SL1 - $ 1,478
SL2 - $ 1,366
SL3 - $ 1272
SL4 - $ 1178
and
SL5 - $ 1,049
Looking at the CHOP indicator, we can see that in the 4H range, the energy we recovered was used for growth, while the MACD indicator clearly confirmed the change in the local trend.

GST is falling after the last huge spike!Hello everyone, let's take a look at the 1H GST to USDT chart as you can see the price is moving below the local downtrend line.
Let's start by setting goals for the near future that we can consider:
T1 - $ 0.0783
T2 - $ 0.0895
T3 - $ 0.0989
T4 - $ 0.1078
and
T5 - $ 0.1205
Now let's move on to the stop loss in case of further market declines:
SL1 - $ 0.0552
SL2 - $ 0.0523
SL3 - $ 0.0450
SL4 - $ 0.0370
and
SL5 - $ 0.0330
Looking at the CHOP indicator, we can see that in the 1H range most of the energy has been used, while the MACD indicator shows that we are continuing the downward trend.

Will CAKE in pair BTC beat its goals?Hello everyone, let's take a look at the 1D CAKE to BTC chart as you can see the price is moving in the local uptrend channel.
Let's start by setting goals for the near future that we can consider:
T1 - 0.0001561
T2 - 0.0001664
T3 - 0.0001768
and
T4 - 0.0001915
Now let's move on to the stop loss in case of further market declines:
SL1 - 0.0001463
SL2 - 0.0001407
SL3 - 0.0001326
and
SL4 - 0.0001225
Looking at the CHOP indicator, we can see that we have a lot of energy in the 1-day interval, and in the MACD indicator we see that the blue line is approaching the red cross from below, which would confirm the upward trend.

ETH just ahead of the $ 1,679 target!Hello everyone, let's take a look at the 1D ETH to USDT chart as you can see the price is moving above the local downtrend line.
Let's start by setting goals for the near future that we can consider:
T1 - 1679$
T2 - 1898$
and
T3 - 2175$
Now let's move on to the stop loss in case of further market declines:
SL1 - $ 1,452
SL2 - $ 1,345
SL3 - $ 1,257
SL4 - $ 1167
and
SL5 - $ 1,038
Looking at the CHOP indicator, we can see that in the 1D range, energy has been used and the MACD indicator shows the local upward trend.

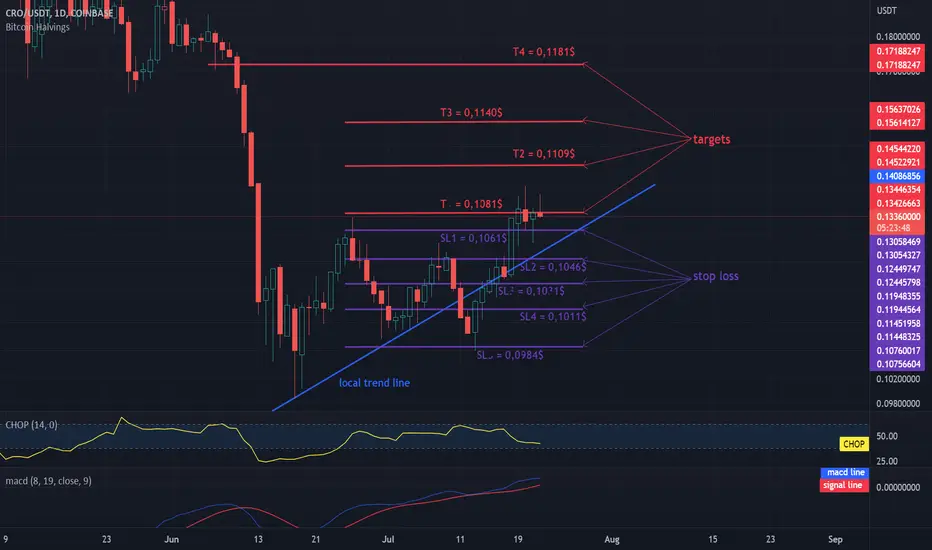
FTM continues the local uptrend.Hello everyone, let's take a look at the 1D CRO to USDT chart as you can see that the price has returned above the local uptrend despite its decline.
Let's start by setting goals for the near future that we can consider:
T1 = $ 0.1081
T2 = $ 0.1109
T3 = $ 0.1140
and
TT4 = $ 0.1181
Now let's move on to the stop loss in case of further market declines:
SL1 = $ 0.1061
SL2 = $ 0.1046
SL3 = $ 0.1031
SL4 = $ 0.1011
and
SL5 = $ 0.0984
Looking at the CHOP indicator, we can see that in the 1D range most of the energy has been used, while the MACD indicator shows a local upward trend.
The FTM fights the resistance on the 1 day interval.Hello everyone, let's take a look at the 1D FTM to USDT chart as you can see the price is moving above the local uptrend line.
Let's start by setting goals for the near future that we can consider:
T1 - $ 0.3208
T2 - $ 0.3589
T3 - $ 0.3985
and
T4 - $ 0.4529
Now let's move on to the stop loss in case of further market declines:
SL1 - $ 0.2952
SL2 - $ 0.2769
SL3 - $ 0.2573
and
SL4 - $ 0.2295
Looking at the CHOP indicator, we can see that in the 1D range the energy has been used, while the MACD indicator shows a local upward trend.

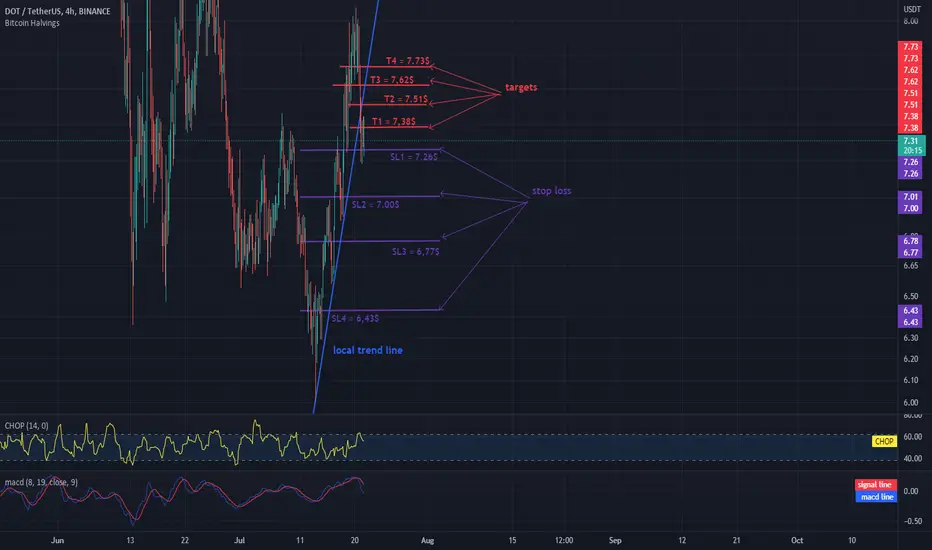
DOT SHORT 4H INTERVALHello everyone, let's take a look at the 4H DOT vs. USDT chart. As you can see, the price has dropped below the local uptrend line.
Let's start by setting goals for the near future that we can consider:
T1 = $ 7.38
T2 = $ 7.51
T3 = $ 7.62
and
T4 = $ 7.73
Now let's move on to the stop loss in case of further market declines:
SL1 = $ 7.26
SL2 = $ 7.00
SL3 = $ 6.77
and
SL4 = $ 6.43
Looking at the CHOP indicator, we can see that in the 4H range we still have a lot of energy, while the MACD indicator shows a local downward trend.
ETH / USDT 4HChart - Targets And StopLossHello everyone, let's take a look at the 4H ETH to USDT chart as you can see the price is moving above the local downtrend line.
Let's start by setting goals for the near future that we can consider:
T1 - $ 1,405
T2 - $ 1,527
and
T3 - $ 1704
Now let's move on to the stop loss in case of further market declines:
SL1 - $ 1,452
SL2 - $ 1,345
SL3 - $ 1,257
SL4 - $ 1167
and
SL5 - $ 1,038
Looking at the CHOP indicator, we can see that in the 4H range we have a lot of energy and the MACD indicator indicates entering a local downward trend.

ADA/USDT TARGETS AND STOPLOSS 4HHello everyone, let's take a look at the 4H ADA to USDT chart as you can see the price is moving above the local downtrend line.
Let's start by setting goals for the near future that we can consider:
T1 - $ 0.5362
T2 - $ 0.5672
T3 - $ 0.6126
and
T4 - $ 0.6695
Now let's move on to the stop loss in case of further market declines:
SL1 - $ 0.5151
SL2 - $ 0.4939
SL3 - $ 0.4763
SL4 - $ 0.4587
and
SL5 - $ 0.4333
Looking at the CHOP indicator, we can see that in the 4H range most of the energy has been used, and the MACD indicator shows a local upward trend.

DOT / USDT 4H CHART - fight the resistance!Hello everyone, let's take a look at the 4H DOT to USDT chart as you can see the price broke above the local downtrend channel and started a local uptrend.
Let's start by setting goals for the near future that we can consider:
T1 = $ 7.96
T2 = $ 8.49
T3 = $ 9.10
and
T4 = $ 9.94
Now let's move on to the stop loss in case of further market declines:
SL1 = $ 7.55
SL2 = $ 7.26
SL3 = $ 7.00
SL4 = $ 6.77
and
SL5 = $ 6.43
Looking at the CHOP indicator, we can see that in the 4H range we still have energy to continue the movement and the MACD indicator confirms the local upward trend.

BNB / USDT 1D INTERVAL, STOPLOSS AND TARGETSHello everyone, let's take a look at the 1D BNB to USDT chart as you can see the price is moving above the local uptrend line.
Let's start by setting goals for the near future that we can consider:
T1 - $ 278
T2 - $ 304
and
T3 - $ 337
Now let's move on to the stop loss in case of further market declines:
SL1 - $ 251
SL2 - $ 238
SL3 - $ 228
SL4 - $ 217
and
SL5 - $ 202
Looking at the CHOP indicator, we can see that in the 1D interval most of the energy has been used, while the MACD indicator shows that we are in an upward trend.
