SHIB/USDT SHORT 4HHello everyone, let's take a look at the 4H SHIB to USDT chart as you can see the price is moving below the local downtrend line.
Let's start by setting goals for the near future that we can consider:
T1 - $ 0.00001016
T2 - $ 0.00001055
T3 - $ 0.00001084
T4 - $ 0.00001116
and
T5 - $ 0.00001160
Now let's move on to the stop loss in case of further market declines:
SL1 - $ 0.00000987
SL2 - $ 0.00000964
SL3 - $ 0.00000925
SL4 - $ 0.00000904
and
SL5 - $ 0.00000820
Looking at the CHOP indicator, we can see that in the 4H range we have a lot of energy, and the MACD indicator shows a local upward trend, but the blue line is close to the red line, if it crosses it from the top, it can confirm the trend change.
Stoploss

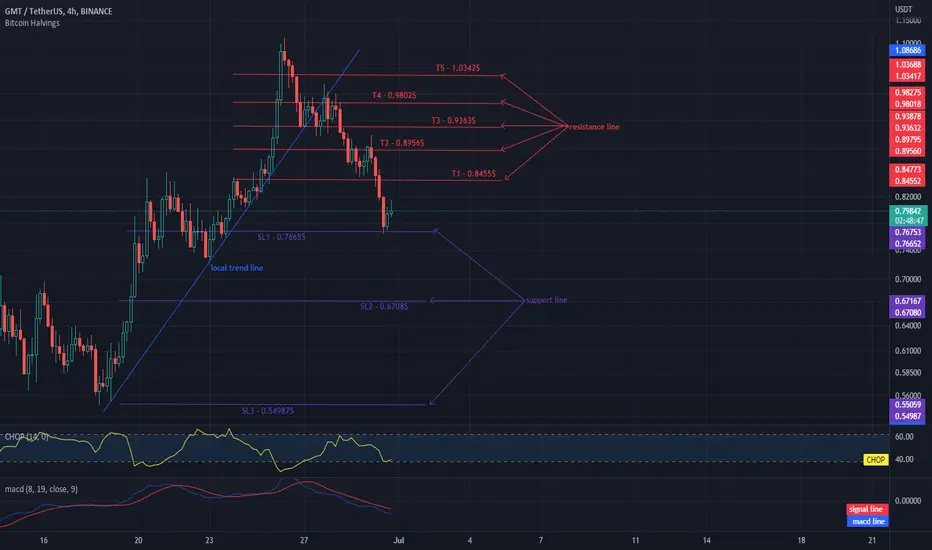
GMT - TARGETS AND STOPLOSS 4HHello everyone, let's take a look at the 4H GMT to USDT chart as you can see the price is moving below the local uptrend line.
Let's start by setting goals for the near future that we can consider:
T1 - $ 0.8455
T2 - $ 0.8956
T3 - $ 0.9363
T4 - $ 0.9802
and
T5 - $ 1.0342
Now let's move on to the stop loss in case of further market declines:
SL1 - $ 0.7665
SL2 - $ 0.6708
and
SL3 - $ 0.54987
Looking at the CHOP indicator, we can see that in the 4H range the energy is depleted and the MACD indicator shows a downward trend.
EURGBP SHORT TRADE 15m TFEntry about equal highs, tp under equal lows, gave the stop a bit space to breath, didnt place it exactly about the high

WILL BNB change its trend to an uptrend?Hello everyone, let's take a look at the 1H BNB to USDT chart as you can see the price is moving below the local uptrend line.
Let's start by setting goals for the near future that we can consider:
T1 - $ 221
T2 - $ 225
T3 - $ 228
and
T4 - $ 231
Now let's move on to the stop loss in case of further market declines:
SL1 - $ 218
and
SL2 - $ 211
Looking at the CHOP indicator, we can see that in the 1H range we have a lot of energy, and the MACD indicator shows that the trend is changing into an upward trend.

BNB - a local downward trend on the 1H intervalHello everyone, let's take a look at the 1H BNB to USDT chart as you can see the price is moving below the local uptrend line.
Let's start by setting goals for the near future that we can consider:
T1 - $ 236
T2 - $ 250
and
T3 - $ 268
Now let's move on to the stop loss in case of further market declines:
SL1 - $ 230
SL2 - $ 221
SL3 - $ 214
SL4 - $ 207
and
SL5 - $ 196
Looking at the CHOP indicator, we can see that the energy has been used in the 1H interval, and the MACD indicator shows a local downward trend.

FTM In a local downtrendHello everyone, let's take a look at the 1H FTM to USDT chart as you can see the price is on the border of the uptrend line.
Let's start by setting goals for the near future that we can consider:
T1 - $ 0.3734
T2 - $ 0.3460
and
T3 - $ 0.3872
Now let's move on to the stop loss in case of further market declines:
SL1 - $ 0.2884
SL2 - $ 0.2698
SL3 - $ 0.2549
SL4 - $ 0.2412
and
SL5 - $ 0.2198
Looking at the CHOP indicator, we can see that in the 1H range we have less and less energy and the MACD indicator shows a local downward trend.

DOT for 1 hour interval!Hello everyone, let's take a look at the 1H DOT to USDT chart as you can see the price is moving above the local downtrend line.
Let's start by setting goals for the near future that we can consider:
T1 = $ 8.29
T2 = $ 8.81
and
T3 = $ 9.47
Now let's move on to the stop loss in case of further market declines:
SL1 = $ 8.00
SL2 = $ 7.71
SL3 = $ 7.48
SL4 = $ 7.24
and
SL5 = $ 6.90
Looking at the CHOP indicator, we can see that in the 1 hour interval we have little energy and the MACD indicator shows a local downward trend.

TARGETS AND STOPLOSS FOR ADA/USDTHello everyone, let's take a look at the 4H ADA to USDT chart, As you can see, the price has moved sideways from the downtrend line and is now moving in the local uptrend channel marked by the yellow lines.
Let's start by setting goals for the near future that we can consider:
T1 - $ 0.5150
T2 - $ 0.5456
T3 - $ 0.5754
and
T4 - $ 0.6157
Now let's move on to the stop loss in case of further market declines:
SL1 - $ 0.4886
SL2 - $ 0.4755
SL3 - $ 0.4648
and
SL4 - $ 0.4548
Looking at the CHOP indicator, we can see that there is still some energy left in the 4H range, and the MACD indicator shows a local upward trend.

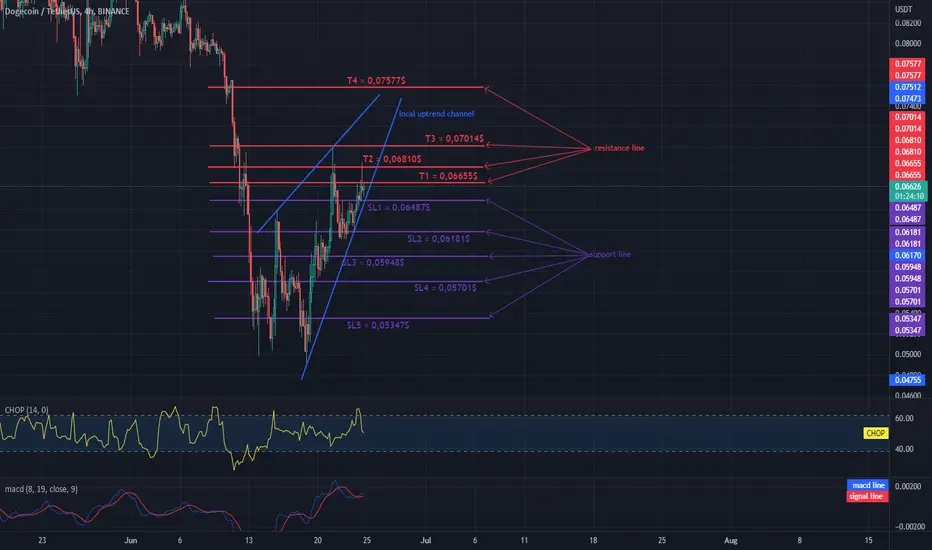
DOGE in the uptrend channelHello everyone, let's take a look at the 4H DOGE to USDT chart as you can see the price is moving in the uptrend channel.
Let's start by setting goals for the near future that we can consider:
T1 = $ 0.06655
T2 = $ 0.06810
T3 = $ 0.07014
and
T4 = $ 0.07577
Now let's move on to the stop loss in case of further market declines:
SL1 = $ 0.06487
SL2 = $ 0.06181
SL3 = $ 0.05948
SL4 = $ 0.05701
and
SL5 = $ 0.05347
Looking at the CHOP indicator, we can see that in the 4H range some energy was used, and the MACD indicator shows an upward trend.
ETH is back to around $ 1,200Hello everyone, let's take a look at the 4H ETH to USDT chart as you can see the price is moving above the local uptrend line.
Let's start by setting goals for the near future that we can consider:
T1 - $ 1,288
T2 - $ 1,437
T3 - $ 1,586
and
T4 - $ 1,684
Now let's move on to the stop loss in case of further market declines:
SL1 - $ 1145
SL2 - $ 1096
SL3 - $ 1,054
SL4 - $ 1010
and
SL5 - $ 951
Looking at the CHOP indicator, we can see that in the 4H range most of the energy was used, and the MACD indicator shows a local upward trend.

BNB is climbing the trend lineHello everyone, let's take a look at the 1H BNB to USDT chart as you can see the price is moving above the local downtrend line.
Let's start by setting goals for the near future that we can consider:
T1 - $ 227
T2 - $ 237
T3 - $ 254
and
T4 - $ 271
Now let's move on to the stop loss in case of further market declines:
SL1 - $ 220
SL2 - $ 212
SL3 - $ 207
SL4 - $ 201
and
SL5 - $ 193
Looking at the CHOP indicator, we can see that we have a lot of energy in the 1H interval, and the MACD indicates that we can enter a local upward trend.

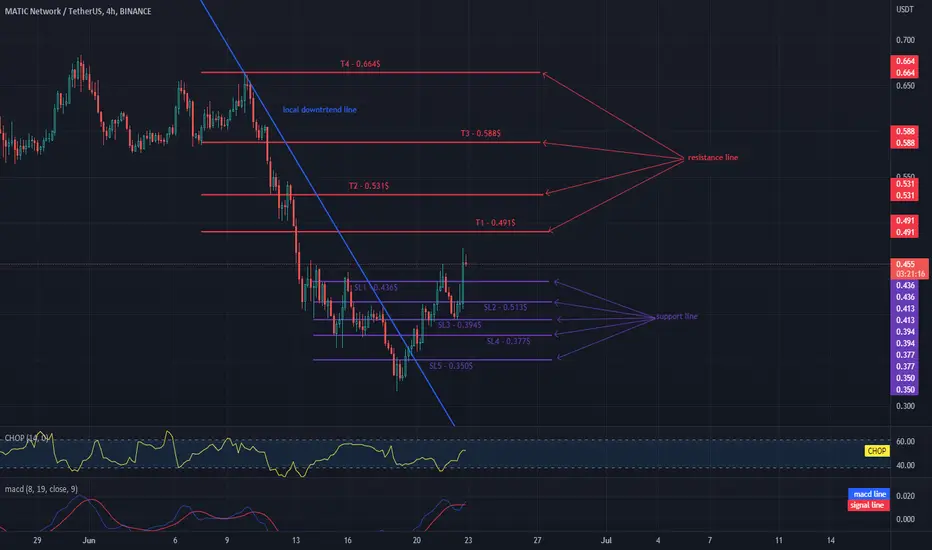
MATIC in the local uptrend!Hello everyone, let's take a look at the 4H MATIC to USDT chart as you can see the price has come above the downtrend line.
Let's start by setting goals for the near future that we can consider:
T1 - $ 0.491
T2 - $ 0.531
T3 - $ 0.588
and
T4 - $ 0.664
Now let's move on to the stop loss in case of further market declines:
SL1 - $ 0.436
SL2 - $ 0.513
SL3 - $ 0.394
SL4 - $ 0.377
and
SL5 - $ 0.350
Looking at the CHOP indicator, we can see that in the 4H range we collect more and more energy, and the MACD indicator shows that we are in a local upward trend
DOT / USDT loklanie changes the trend to a downward trendHello everyone, let's take a look at the 4H DOT to USDT chart as you can see the price has come above the downtrend line and back below that line.
Let's start by setting goals for the near future that we can consider:
T1 = $ 7.91
T2 = $ 8.29
and
T3 = $ 8.77
Now let's move on to the stop loss in case of further market declines:
SL1 = $ 7.60
SL2 = $ 7.38
SL3 = $ 7.16
SL4 = $ 6.86
and
SL5 = $ 6.47
Looking at the CHOP indicator, we can see that in the 4H range the energy slowly starts to rise, while the MACD indicator shows a change in the local trend to a downward trend.

WILL LUNC / BUSD BEAT THE TARGETSHello everyone, let's take a look at the 4H LUNC to BUSD chart as you can see the price is approaching exiting the channel marked with the blue lines.
Let's start by setting goals for the near future that we can consider:
T1 = $ 0.00005988
T2 = $ 0.00006536
T3 = $ 0.00006958
T4 = $ 0.00007394
and
T5 = $ 0.00008027
Now let's move on to the stop loss in case of further market declines:
SL1 = $ 0.00005115
and
SL2 = $ 0.00004089
Looking at the CHOP indicator, we can see that in the 4H range we still have some energy, while the MACD indicates that we are maintaining the local upward trend.

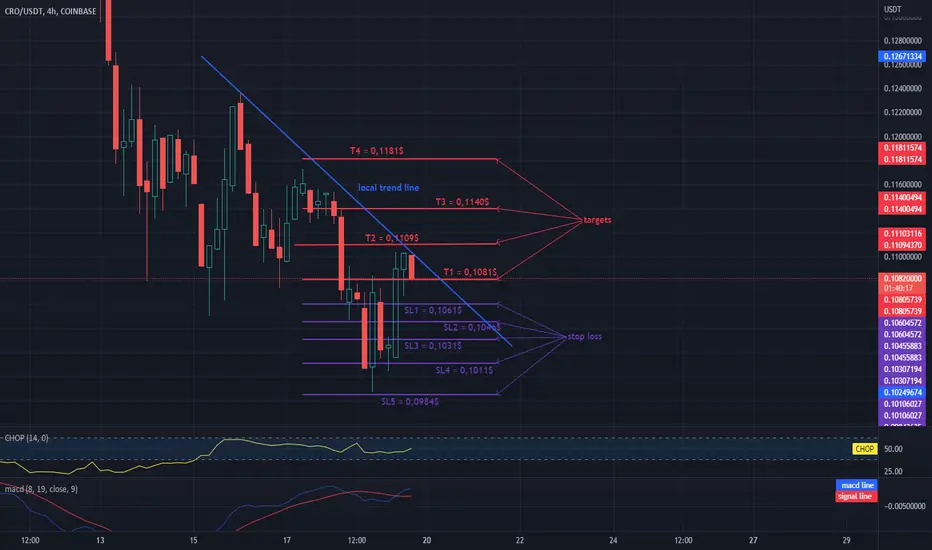
LOCAL REFUND OF THE PRICE CROHello everyone, let's take a look at the 4H CRO to USDT chart as you can see the price is moving below the local downtrend line.
Let's start with setting targets for the near future that we can take into account:
T1 = $ 0.1081
T2 = $ 0.1109
T3 = $ 0.1140
and
T4 = $ 0.1181
Now let's move on to the stop loss in case of further market declines:
SL1 = $ 0.1061
SL2 = $ 0.1046
SL3 = $ 0.1031
SL4 = $ 0.1011
and
SL5 = $ 0.0984
Looking at the CHOP indicator, we can see that at the 4H interval, the energy slowly begins to increase, while the MACD indicator indicates a local upward trend.
BTCUSDT : WHAT'S NEXT ??Hello !!
Welcome to the quick update of BTCUSDT.
After breaking the initial support of 28300, BTC took a deep dump. It tried to sustain at the 26k level but eventually fell off making a new low of 20100, which is down almost 70% from ATH. It took a pump from 20100 and is currently trading around 22K.
In order for us to be bullish again, it needs to break the 28k level, below it we are still bearish. The various scenarios are mentioned in the chart, if BTC breaks the 20k level, we can see it dump to 17k followed by 10k in the worse case.
Let's see how the market reacts and wait for the right moment to enter any trade.
The market is still very uncertain, and unstable and I would suggest everyone hold their patience and wait for a clearer picture and trade only after confirmations.
As of now, please take trades with caution and with STRICT STOPLOSS else you might end up blowing your trading account.
This is not financial advice, please do your own research before investing and we are not responsible for any of your losses or profits.
Please like and share and comment on this idea if you liked it.

STOP LOSS AND TARGETS FOR ADA / USDTHello everyone, let's take a look at the ADA vs USDT chart over the 4 hour timeframe. As you can see, the price is moving above the local trendline.
Let's start by designating the support line and as you can see the first stop is fate at:
SL1 - $ 0.5988
SL2 - $ 0.5688
SL3 - $ 0.5405
and
SL4 - $ 0.4986
Now let's move on to the targets that we can set for the nearest future:
T1 - $ 0.6527
T2 - $ 0.7121
and
T3 - $ 0.7979
Looking at the CHOP indicator, we can see that in the 4-hour interval we have a lot of energy, while the MACD indicator shows that we have entered a local downward trend.

GMT in the local uptrend, SHORTHello everyone, let's take a look at the GMT to USDT chart over the 4 hour timeframe.
As you can see, the price is moving above the local trendline.
Let's start by identifying the stop loss we have in the near future:
SL1 - $ 0.9975
SL2 - $ 0.9070
SL3 - $ 0.7979
Now let's move on to the goals we may consider:
T1 - $ 0.9994
T2 - $ 1.0598
T3 - $ 1.1099
T4 - $ 1,7579
Looking at the CHOP indicator, we can see that in the 4H interval most of the energy was used, while the MACD indicator indicates a local upward trend.

Long NZDJPY D1Long NZDJPY D1 Entry @ 81.667 - SL @ 79.40 - TP @ 85.55
Both the NZD and the JPY a being sold on the COT report dated May 10 2022. So the institutions aren't favoring either currency. The currency strength meter has the NZD slightly stronger than the JPY. So I'm going long with two other confirmations seasonality (bullish cycle between 5/19/ 2022 - 6/9/2022) and a bullish order block.

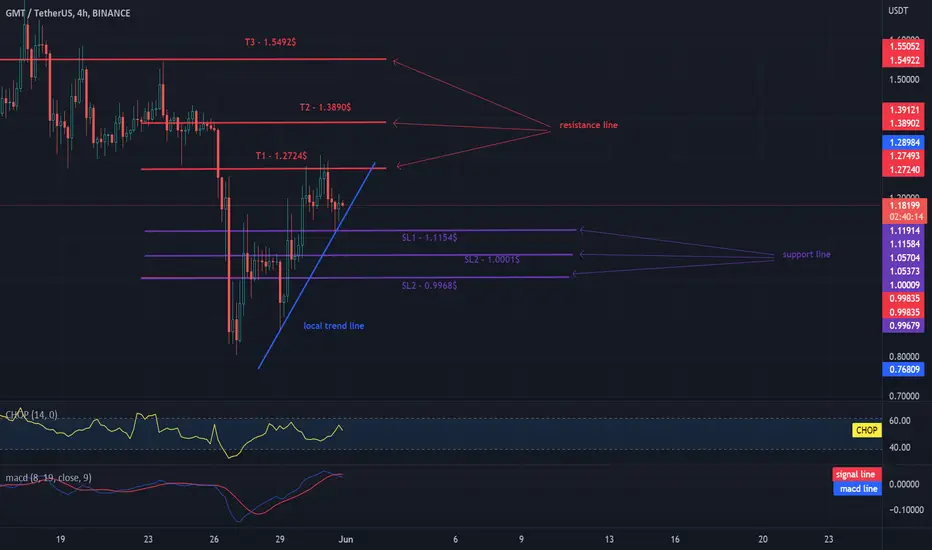
GMT has rebounded from resistance and is gaining energy. 4HCHARTHello everyone, let's take a look at the GMT to USDT chart over the 4 hour timeframe.
As you can see, the price is moving above the local trendline.
Let's start by identifying the stop loss we have in the near future:
SL1 - $ 1.1154
SL2 - $ 1,0001
SL2 - $ 0.9968
Now let's move on to the goals we may consider:
T1 - $ 1.2724
T2 - $ 1.3890
T3 - $ 1.5492
Looking at the CHOP indicator, we can see that in the 4H interval we have a lot of energy for the next move, while in the MACD indicator we see that the blue line crosses the red one from above, which could potentially lead to a further decline in the price.
Be careful and use stoploss in the short-term game.
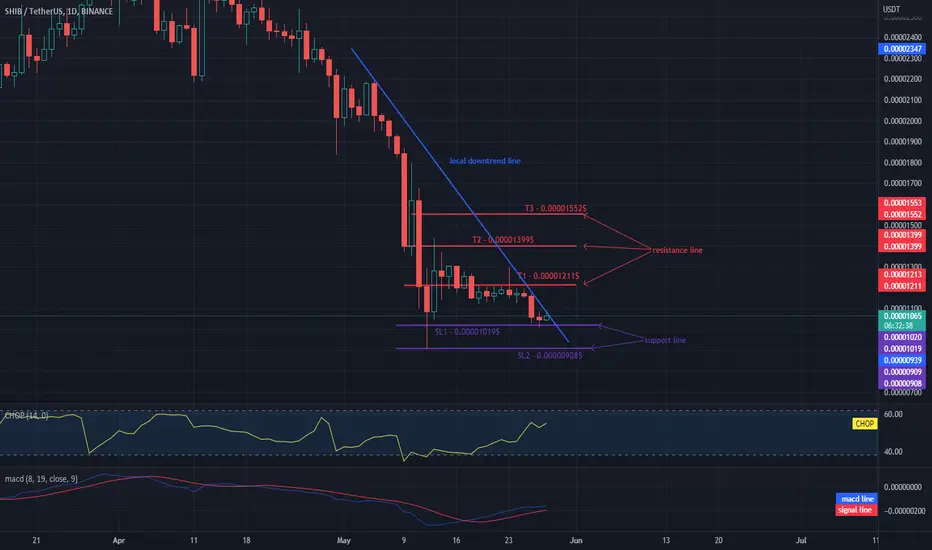
Will SHIB recover from declines?Hello everyone, let's take a look at the SHIB to USDT chart on a 1 day time frame. As you can see, the price is moving below the local downtrend line and is approaching its side exit.
It is worth starting with setting a stop loss, which we should take into account in the coming hours. As you can see, we chose 4 stop losses:
SL1 - $ 0.00001170,
SL2 - $ 0.00001109,
Now let's move on to defining the goals of price and as you can see, the first is at the T1 level - $ 0.00001211, which the price is currently struggling with, the next is at the T2 - $ 0.00001399 level, the next is T3 - $ 0.00001552.
Looking at the CHOP indicator, we can see that we collect more and more energy in the 1-day interval, and the MACD indicator does not indicate a downward trend.
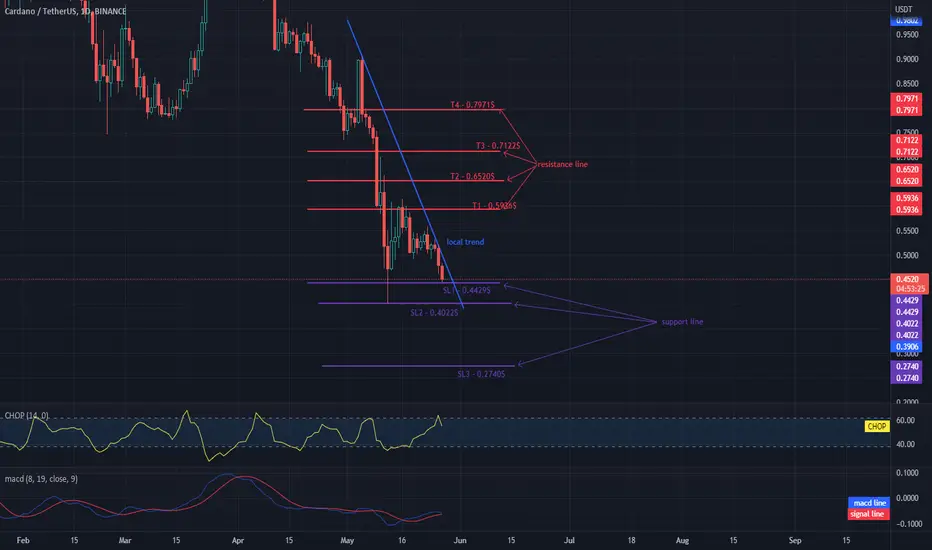
The ADA is based on the first stop lossHello everyone, let's take a look at the ADA to USDT chart on a 1 day time frame. As you can see, the price is moving below the local downtrend line.
Let's start with the designation of the support line and as you can see the first support in the near future is SL1 - $ 0.4429 which is currently in price, if the support breaks, the next one is SL2 - $ 0.4022 and SL3 - $ 0.2740.
Now let's move from the resistance line, as you can see, the first resistance is T1 - $ 0.5936, if you manage to break it, the next ones will be T2 - $ 0.6520 and T3 - $ 0.7122 and T4 - $ 0.7971.
Looking at the CHOP indicator, we can see that in the 1-day interval some energy has been used to reduce the price, but we still have a lot of energy that can be used in the coming days.
CADCHF SELL CADCHF Has Grabbed the BUY SIDE LIQUIDITY and Hence has Less Chances to Move Up Again. And will Continue Its Bearish Trend
