How did Open Interest tell me: Stay long as BTC Dumped!?!BYBIT:BTCUSD
I was in 3 long trades as Bitcoin dumped on the 26th of May 2022.
I had 2 choices. Close my longs because I saw price dumping below my entry
or
look at what Open interest was telling me to determine if this was a fakeout.
I saw price dropping as OI was dropping. This meant that longs were closing out their positions, which means that when this ended, price could reverse quickly.
Longs were closing out their positions and re-entering as shorts. As soon as this selling dried up, Longs started entering and then suddenly shorts were being liquidated, pushing the price up again.
This is known as a stop run. Hit long stops and then hit short stops. Be aware of this kind of fakeout as it happens again and again!
Learn to trade the retest and why it is important not to short at support and inversely why it is NB not to long at resistance, UNLESS you get a retest of that level!
Not financial advice, DYOR. Papertrade before using real money.
If this educational snipped helped you, please consider giving it a thumbs up and follow for more like this!
Trade Safely and Learn something every day!
Shawn
Stoploss

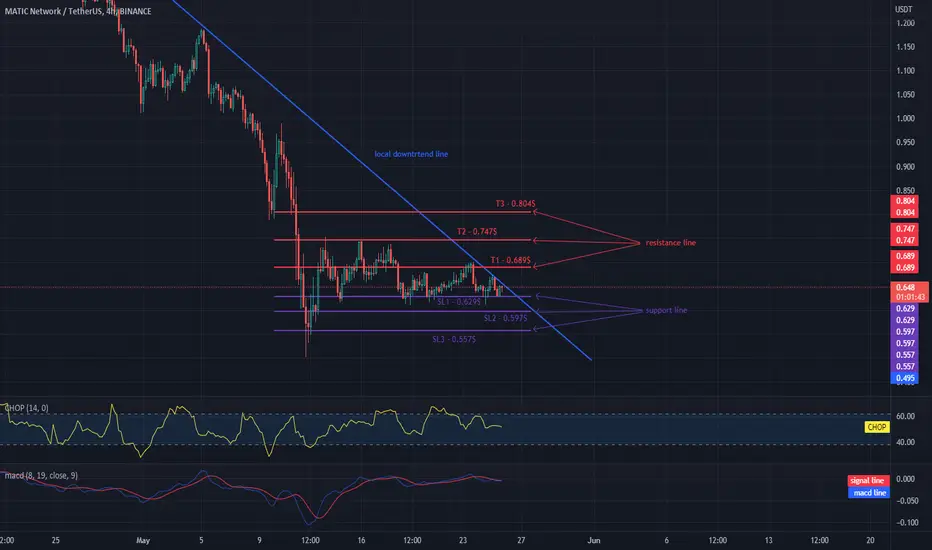
MATIC on 4H interval, target and stop lossHello everyone, let's take a look at the MATIC to USDT chart over the 4 hour timeframe. As you can see, the price is moving below the local downtrend line.
Let's start with determining the stop loss that we should take into account in the short term and, as you can see, we can set the following stop loss:
SL1 - $ 0.629
SL2 - $ 0.597
SL3 - $ 0.557
Now it is worth going to the targets that we should take into account when playing short-term, we see individual targets:
T1 - $ 0.689
T2 - $ 0.747
T3 - $ 0.804
Looking at the CHOP indicator we can see that in the 4-hour interval some energy has been used up, but we have a little bit to continue the movement.
However, please remember that the market can be dynamic and you should always be careful with the market and analysis.
If BTC is stable, GMT may start to go upHello everyone, let's take a look at the BTC to USDT chart over the 4 hour timeframe. As you can see, price is moving above the local uptrend line.
Let's start with the designation of the support line and as you can see the first support in the near future is SL1 - $ 1.29, if the support breaks, the next one is SL2 - $ 1.17 and SL3 - $ 1.02.
Now let's move from the resistance line, as you can see, the first resistance is T1 - $ 1.62, if you can break it, the next resistance will be T2 - $ 2.10 and T3 - $ 2.50, T4 - $ 2.90.
Looking at the CHOP indicator, we can see that on the 1-day interval we are starting to recover energy, and the MACD indicator indicates an upward trend

Bitcoin Idea May (2022) Custom Heat_Mapping and Wolfe Wave - Heatmap reacts with chart- and shows- color of heatmap- within candles- I think theres a mtf and supertrend as well-- Looking for a long to go through over the next 5 days--alien spaceship--bullish trend - dump today was a huge bart pattern- -1500 dollars - rebound to where we started at the beginning of the day- hopefully we bounce back up to 32500 then 40 000 usd within the next few days- stay posted - track the chart- hit the like button and follow me if you like- always looking for new friends that trade.

GBPJPY: Imbalance to ImbalancePrice trapped the head and shoulders sellers and I assume the majority of them are now all liquidated.
Maybe we can expect a sell to the fair value gap before we begin buying again.
What are your thoughts? 🔥

BTC stop-loss hunt is highly expected soonFriends,
reviewing the 1D BTC chart, I noticed that we had at least 2 SL hunts with massive pullback and global uptrend channel continuation.
Now we're in a very similar situation and I expect the 3rd SL hunt to the are around 36000.
What do you think, may this happen?
Share your thoughts in the comments!

TRX | has a good support areaHello . 🖐️
Here are some facts we all know :
1.We have a good support area near us. Tested several times
2.Large volume traded the previous days
3.Our oscillator will go head down and possibly reach the oversold area
What I think might happen soon :
1.The price falls once again because of the emotions that dominate the market
2.Apart from market sentiment, there is good liquidity below the support area + round number 0.06 can also be the stopping point of many traders (stop hunting)
3.Our oscillator turns blue, which indicates the fall of the market, but basically, when all the columns turn blue, it is the turning point of the market. So if we have heat or red lines later, we can reach higher prices 🔥 (I did not specify a target) 😅
-----------------------------------------------------------------------------
Like if you use volume for analysis 🙂
Leave a comment if you think using volume for analysis is useless
Follow me if you would like me to use another indicator for the next analysis

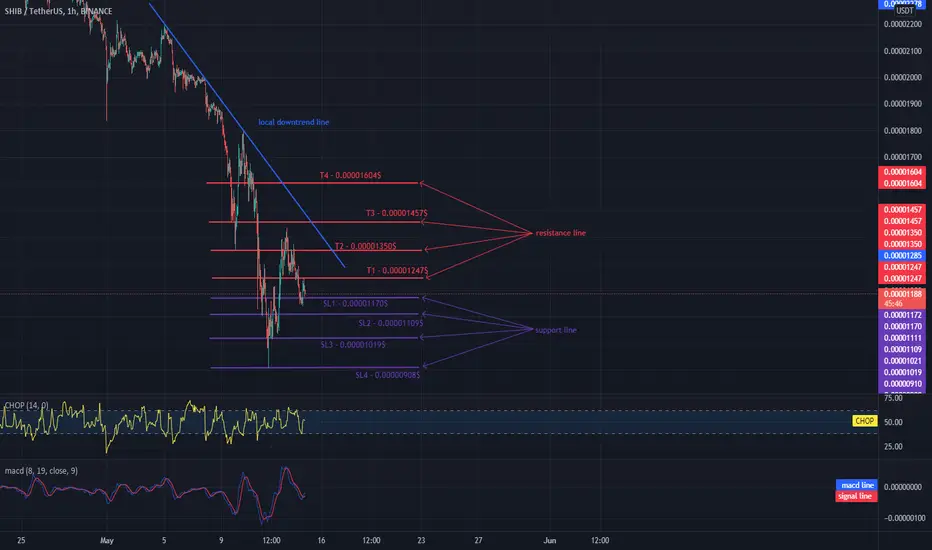
SHIB right on the support!Hello everyone, let's take a look at the SHIB to USDT chart in 1 hour. As you can see, the price broke above the local downtrend line.
It is worth starting with setting a stop loss that we should take into account in the coming hours. As you can see, we chose 4 stop losses:
SL1 - $ 0.00001170,
SL2 - $ 0.00001109,
SL3 - $ 0.00001019,
SL4 - $ 0.00000908.
Now let's move on to determining the goals that price has in front of him and as you can see, the first is at the T1 level - $ 0.00001247, which the price is currently struggling with, the next is at the T2 - $ 0.00001350 level, the next is T3 - $ 0.00001457 and T4 - $ 0.00001604 .
Looking at the CHOP indicator, we can see that some energy has been used within 1 hour, but we have a little to continue the movement. On the other hand, the MACD indicator shows an upward trend.
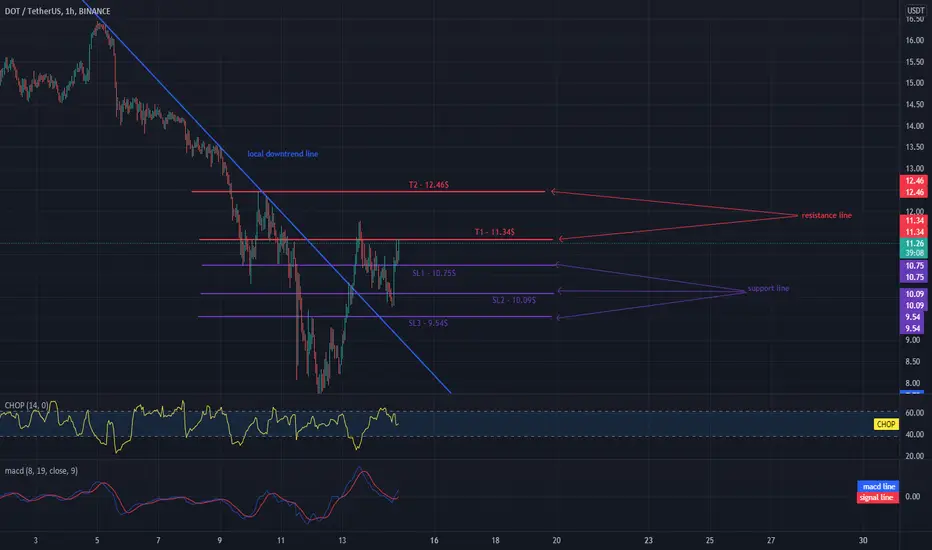
Will DOT handle the first target?Hello everyone, let's take a look at the DOT to USDT chart over the 1 hour timeframe. As you can see, the price broke above the local downtrend line.
It is worth starting with determining the stop loss that we should take into account in the coming hours. As you can see, we chose 3 stop loss: SL1 - $ 10.75, SL2 - $ 10.09, SL3 - $ 9.54.
Now let's move on to determining the targets that the price has in front of it and as you can see, the first one is at T1 - $ 11.34 with which the price is currently fighting, the next one is at T2 - $ 12.46.
Looking at the CHOP indicator we can see that in the 1 hour interval some energy has been used up, but we have a little bit to continue the movement. On the other hand, the MACD indicator shows an upward trend.
BTC on the border of the support zoneHello everyone, let's take a look at the BTC to USDT chart over the 4 hour timeframe. As you can see, the price is moving in a downtrend.
Let's start with the designation of the support line and as you can see the price has dropped below the support zone and the first support in the near future is SL1 - $ 28,373, if the support breaks down, the next is SL2 - $ 27,596 and SL3 - $ 26,716.
Now let's move on to setting targets for the coming hours and you can see that T1 - $ 29,250, if you can break it, the next T2 - $ 29,594 and T3 - $ 29,867 and T3 - $ 30,139.
Looking at the CHOP indicator, we can see that there is still a lot of energy in the 4-hour interval, while the MACD indicator is just before the red line crosses from above, which would confirm the downward trend.

Stay sharp in these volatile times!These are crazy times.
In 2020 I started to seriously dedicate myself to becoming a profitable trader. the past few months have been very volatile. and for me as a beginner it is also very difficult to earn even a little constant results. and maybe you recognize yourself in my situation, But I have learned a lot from all this chaos ;) , and therefore I have written down a few of my own experiences that hopefully will help you to get a little more consistent results. as I say, I am no expert and this is therefore certainly not financial advice. but especially in these times I think it is nice to help each other a little and learn from each other's mistakes.
1. It's okay to not have open positions from time to time. Occasionally it can be frustrating, if you take a loss, but that's okay, hopefully you learned something from it. I now consider the current (short-term) trend to be neutral/Bearish. and I am now reading Technical Analysis of the financial markets and in that book there was a sentence that I did find reassuring: "It is during these periods of sideways market movement that technical traders experience their greatest frustration, and systems traders their greatest equity losses". Take these times to prepare yourself for a more predictable market phase.
2. Trying to predict a bottom can be dangerous. Try to wait for confirmation, or a known pattern. Take LUNA/USD as an example, luckily I didn’t had any money in this coin. But you don't want to get stuck in a long position, don't forget to set a stop loss either, and the last point actually ties into point 2
3. A well-known rule is that you should not add to a losing position. I thought I had remembered this but I did catch myself doing it at the beginning, especially in times like this it can be disastrous, usually it doesn't end well.
I wish everyone the best coming times, hopefully most will achieve their goals. Keep thinking rationally and try to keep your emotions under control. I wish you all the best.
Let me hear from you in the comments, I am very curious about your experience in this market.
Perhaps you have a suggestion for me, I would be very happy with that.
AMEX:SPY

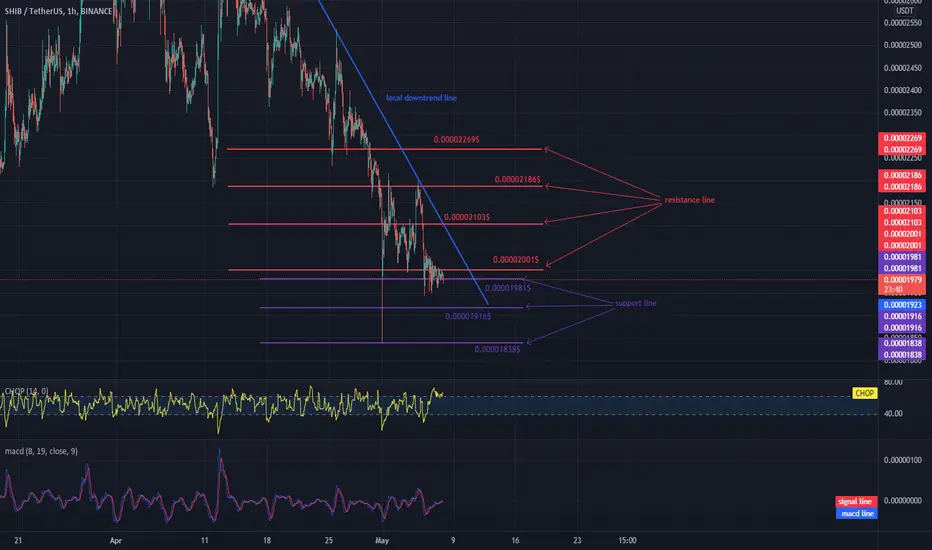
SHIB in the support areaHello everyone, let's take a look at the SHIB to USDT chart in 1 hour. As you can see, the price is below the local downtrend line.
Let's start by marking the support line and as you can see the first Stop Loss that the price is currently based on is $ 0.00001981 in the case of a support break, the next Stop Loss to consider is $ 0.00001916 and the next one is $ 0.00001838.
Now let's move on to the goals we can set for the next few hours as you can see in the chart, the first goal is $ 0.00002001 and the next ones are $ 0.00002103, $ 0.00002186, $ 0.00002269.
Looking at the CHOP indicator, we can see that we have a lot of energy in the hourly interval, so it is worth being careful and securing your stop loss positions.
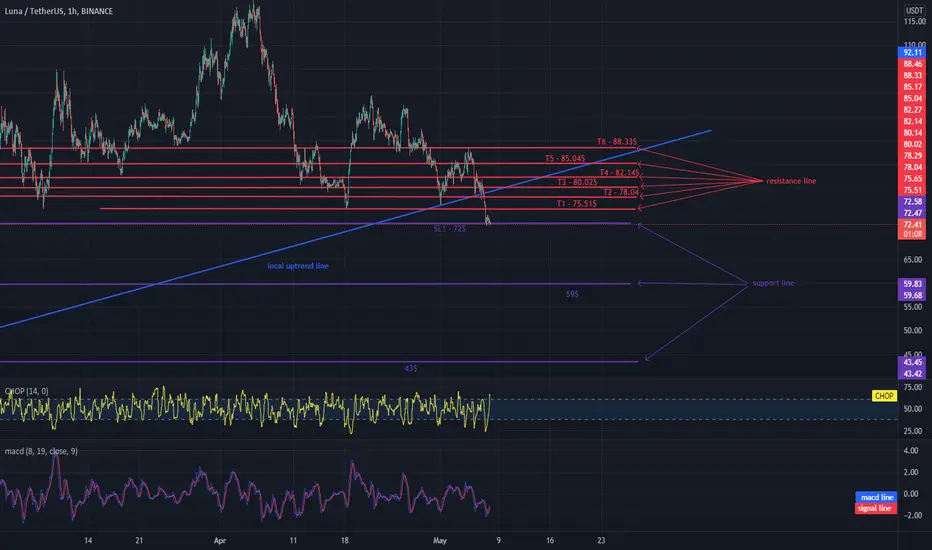
LUNA based on supportHello everyone, let's take a look at the LUNA to USDT chart over the 1 hour timeframe. As you can see, the price has dropped below the uptrend line.
Let's start by marking the support line and as you can see the first stop loss the price is currently basing on is SL1 - $ 72 if the support breaks, the next stop loss to consider is $ 59, and another is $ 43.
Now let's move on to the targets that we can set for the next few hours, as you can see on the chart, the first target is T1 - $ 75.51 and the next ones: T2 - $ 78.04, T3 - $ 80.02, T4 - $ 82.14, T5 - $ 85.04 and T6 - $ 88.33
Looking at the CHOP indicator, we can see that we have a lot of energy in the hourly interval, so it is worth being careful and hedging your stop loss positions.
BTC on a 1 hour interval SHORT!Hello everyone, let's take a look at the BTC to USDT chart in 1 hour timeframe. As you can see, the price is moving in the local downtrend channel.
Let's start with marking the support line and as you can see the first stop loss should be set at SL1 - $ 35,868, if the support breaks, the next stop loss that should be taken into account in the next few hours is: SL2 - $ 35698, SL3 - $ 35507, SL4 - 35260 $ and SL5 - $ 34508.
Now let's move on from the resistance line, as you can see, the first resistance is target 1 - $ 36,378, if you can break it, the next resistance will be target 2 - $ 37,058, the next one is target 3 - $ 37,631 and target 4 - $ 38,226.
Looking at the CHOP indicator, we can see that we have a lot of energy in the 1 hour interval, so it is worth being careful and securing your stop loss positions.

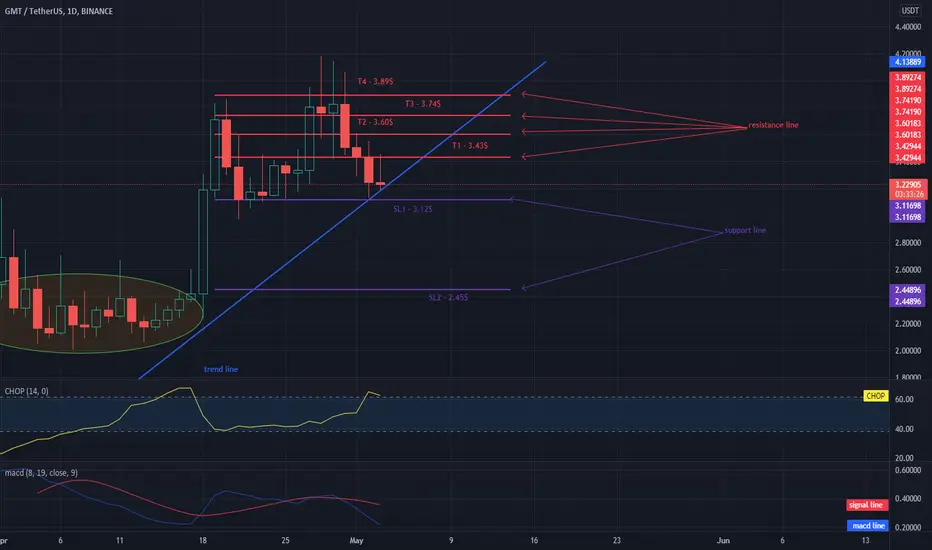
GMT has a price adjustment but has collected a lot of 1D energyHello everyone, let's take a look at the 1D GMT to USDT chart. As you can see, price is moving above the local uptrend line.
Let's start with the designation of the support line and as you can see the first support in the near future is SL1 - $ 3.12, if the support breaks, the next one is SL2 - $ 2.45. It is worth choosing at least one stop loss.
Now let's move from the resistance line, as you can see, the first resistance is T1 - $ 3.43, if you can break it, the next resistance will be T2 - $ 3.60 and T3 - $ 3.74 and T4 - $ 3.89.
Looking at the CHOP indicator, we can see that on the 1D m interval, we have a lot of energy for the next move, while the MACD indicator shows a downward trend because the blue line is below the red one.
BTC PRICE GO UP or DOWN ?beware and careful of your trades. Market is very volatile and might grab you and liquidate you and yo ass. Kidding aside, always use stop loss.
careful and be confident. always use stop loss no matter what and how confident are you.
Price of Interest at support trend, around 38 to 37k. Careful trading at that level of supp might break up or down. Market is very sketchy right now but still good.
but for me, im chillin and waiting to btc calm down and just observing and week/A day TF for me sellers are owning grabbing all liquidities.
btc might touch the imbalace D TF at 30 to 29k thats where the final support and itll bounce and make a new ATH.
remember big fish are not small fish. smile :P
quotes my as$
-MercilessDolphin
not financial advisor but a financialy need money

Dogecoin LongDogecoin
4 hour chart
Pattern: Descending Triangle
Enter Trade: Now
Price Target: $0.1950 - $0.2150
Stop Loss: $0.1195 - $0.1060
Take Profit Targets:
- $0.1540
- $0.1650
- $0.1830

How I'm setting stop losses on USDJPY using IchimokuIn my recent post I indicated that I am long USDJPY due to the higher timeframe bullish trend:
A question that traders often ask is "how do I set a stop-loss when the market is moving up?". This applies if you are looking to enter your first trade in the trend, or if you want to trail a stop-loss on an existing order. The answer is simple when you use Ichimoku.
Briefly, Ichimoku lines indicate the "market equilibrium" over various timeframes. There are three equilibrium lines (or "Han-ne" lines in Japanese). These are:
1. Tenkan-Sen - 9 periods / Short-term equilibrium (yellow on my chart)
2. Kijun-Sen - 26 periods / Medium-term equilibrium (red on my chart)
3. Senko Span B - 52 periods / Long-term equilibrium (red kumo cloud line on my chart)
A Han-ne line is created by finding the midpoint of the highest high and lowest low within the set number of periods. If price is above a Han-ne line, it is said to be bullish in that timeframe, and the opposite for bearish. There is a lot more to learn about Han-ne lines and the meaning of the equilibrium, but for our purposes here, understand that these lines tell you the point where buyers and sellers meet.
One of the reasons we know that USDJPY is bullish is because the Han-ne lines are angled up on the higher timeframes (4H and 1D). This means that the point at which buyers and sellers meet is increasing. In other words: we are trending up!
Now: the secret for setting your stop-loss. If the Han-ne line tells us where the equilibrium is over the short/medium/long term, periods where the line remains flat are significant. If a Han-ne line, especially Kijun-Sen or Senko Span B, remains flat for multiple periods, it means that midprice has been established by many buyers and sellers.
We can use these flat Han-ne lines as:
1. Support/resistance
2. Zones to place stop-loss orders
As I look at a pair like USDJPY trending up, I am zooming into the lower timeframes (think: 15m or 30m) and looking for flat Han-ne lines. If I see several "zones" forming I can place my stop-loss just near the other side of that zone. This means I can receive adequate protection, but also know that if the price does clear that zone and hit my order, a reversal or pullback is likely happening and it will be a good time to exit anyway.
We've already seen a flat Kijun-Sen line act as support on the 15m chart:
You can use this concept for any pair, currency, stock, crypto, etc. The secret is to look for flat lines and use these as your support/resistance levels and stop-loss zones.
Happy trading!

AUDNZD TREND Analysis AND SIGNAL Be sure to stick to Stop Lost and TAkE Profit. This is an idea and not a bargain offer

USDCAD BUY , 1H USDCAD is Looking Bullish .Because The Overall Trend is Bullish from some days And now The Market Has Grab All The Liquidity From The Downside , where All the Retail Traders Has Placed Their SL . So After Taking Out Those Traders The Market Has The Most Probability To Move Upside

EURUSD ,2H LONGHere EURUSD is LOOKING To REVERSE To The Upside Because of Few Reasons
1) The Market is making Lower Low and RSI is making Equal Lows which means Market is making Divergence
2) the market has braked the structure to the upside on lower time frames
3) there is also the liquidity pool on the upside where the market movers could grab all the SL of the traders ..
SO Overall it is Looking a Bullish Setup .

BTC-DAILY-KIJUN-SEN BREAKOUT ...DAILY (D1)
Yesterday's price action triggered a long black candle ( BEARISH ENGULFING ) with, and IT IS VERY IMPORTANT, ITS DAILY CLOSING LEVEL (@ 42'290) , for the first time, since a while, BELOW THE KIJUN-SEN !!!
This move must not be underestimated and must be taken very seriously.
Indeed, the KIJUN-SEN was the last significant support to look at and the breakout of it is confirming further downside in the cards towards the next support level, which will be this time the weekly TENKAN-SEN @ 41'279 ahead of the DAILY VERY THIN CLOUDS SUPPORT AREA (39'854-39'400) slightly below the psychological 40'000 level.
Secondary support trend line currently @ 38'739 and primary uptrend support line currently @ 36'225
Watch and monitor ongoing today's price action (pullback) in the direction of the Kijun-Sen recent breakout (actually @ 43'188).
In the current environment and in order to neutralise this ongoing downside risk, the BTC should quickly recover and close on a daily closing basis above the KIJUN-SEN , which if it is the case, would at least trigger a PIERCING LINE , (slightly bullish pattern, not as powerful as a Bullish engulfing pattern, but at least a stabilization signal)
A failure to do it would be seen as a natural pullback providing selling opportunity (ie selling on rally with a stop loss above 44'000 targeting tactically 40'000 in applying a RR ratio of at least, ideally 1:3). Strategic idea would target 36'225 allowing to increase the level of the stop loss above the ongoing downtrend line resistance in keeping a respective and coherent RR ratio !
As usual watch H4, H1 and shorter intraday time frames to get early signal (s) which will help you to act accordingly in validating or invalidating the DAILY implications previously mentioned.
And do not forget, if you like my analysis to like it and for those who do not follow me yet on TRADING VIEW (one of the best charting application available at the moment),https://www.tradingview.com/gopro/?share_your_love=Ironman_8848,please do not forget either to add IRONMAN8848 in your following list.
Many thanks in advance for your support.
Have a great weekend.
IRONMAN8848 - Jean-Pierre Burki

Where To Set Your Stop Loss Trading CryptocurrencyA new trader asked me the important question, "where do I set my stop loss when trading cryptocurrency?" I decided to make a video detailing my strategy using live trade examples over the last two weeks in Solana COINBASE:SOLUSD and Ethereum COINBASE:ETHUSD . Solana was coming off a double bottom and a price spike gave the sign for where to put the stop loss. Ethereum was hitting a key Resistance level and also gave a signal for where to put the stop.
