$XELA Exela double bottom at the 886Exela is forming some kind of double bottom at the current .886
One could try a long here. Stop HAS to be the All time low at 0,344.
Take your profits on the way up to 1$
Stoploss

NZDUSD | Live position reviewWe have moved stop-loss to 25pips from entry as we continue to monitor price action. Thank you
Risk Disclaimer:
Margin trading in the foreign exchange market (including commodity trading, CFDs, stocks etc.) has a high risk and is not suitable for all investors. The content of this speculation (including all data) is organized and published by me for the sole purpose of education and assistance in making independent investment decisions. All information herein is for your reference only and I take no responsibility.
You are hereby advised to carefully consider your investment experience, financial situation, investment objective, risk tolerance level, and consult your independent financial adviser as to the suitability of your situation prior to making any investment.
I do not guarantee its accuracy and is not liable for any loss or damage which may result directly or indirectly from such content or the receipt of any instruction or notification therewith.
Past performance is not necessarily indicative of future results.

Things you should consider in trading to make it as a career
Hello everyone:
6 points I like to share on what you should consider in trading to make it as a career.
1. Trading is not a get rich quick scheme
Contrary to what social media, scammers, fakers and fake trading gurus want you to believe, trading is NOT a get rich quick scheme.
Those who believe such usually end up over trading, over leverage, blow accounts and give up.
(Trading is actually a reasonable method to yield money return. It is how consistent traders make a return on their original investment/deposit with proper risk management, strategies and methods. )
2. Technical/Fundamental Analysis dont work all the time.
Trading ANY sort of strategy, method or style will always have a percentage of failure and losses.
Its probability, not right or wrong. The main goal in trading is to make sure you have proper risk management, good Risk:Reward ratio, and look for consistency, sustainability in the long run.
(Sometimes traders blame their strategies, method, style, mentor and other things due to their trades not working out.
Not trading strategies can yield 100% strike rate, if there is, there will not need any risk management, and anyone trader should get rich)
3.Limit your risk per trade
Proper risk management is super crucial to a trader’s success. Many traders often risk way more than their accounts can handle, after all what's 10%-20% of a $100 to many people ?
But would you risk 10-20% on a $100,000 account ? and lose $10,000-$20,000 in one trade ?
(Too many new traders deposit a small amount of money hoping it can double and double and double. But they often over risk, over leverage the account.
The result is it only take a few trades to totally blow the account up.)
4.Must use stop loss
It may have worked out for you a few times where you remove your SL, and the price reverses and you close with profits. But what if the price goes against you more and more?
Can you stay mentally sharp enough and continue to hold the trade when the losses pile up more and more ?
You more likely can not, which will end up resulting in a margin call and/or blow the account.
(In the past I had a trader who approached me and showed me his losses on OIL where he removed his SL and price continued to go against him.
IT has come to a point where he reaches margin call, and the broker actually open opposite positions to “hedge” his losses)
5. Don’t over analysis and combine multiple trading strategies, methods and style
Over analysis and complicating your charts may lead to confusion and is not necessarily efficient.
Most trading strategies do work on their own, but when combined with so many other strategies, it creates conflicts, contradiction and confusion for traders.
(Often traders combine too many random indicators, S/R, trendlines…etc all on one chart. It makes it hard to analyze, and have a bias of the direction of the market)
6.Always use a top-down analysis approach.
Multi-time frame analysis is key. Always start from the higher time frame to the lower time frame.
The higher the time frame the stronger and noticeable the price action it is. Understanding a higher time frame can give you a possible direction and bias.
While the lower time frame will be your confirmation and entry.
(Have seen many new traders jump onto the 1 min chart to trade. While there are successful scalpers with proper years of experiences,
good trading psychology and emotion, most newcomers will not be able to handle the stress and pressure from it. )
Don’t give up

Failed Quasimodo with possible PMG entryI've recently watched a video about the PMG entry from @SaraStratSniper and I figured this is a perfect moment on XAUUSDT to enter such a trade. Let's break previous highs and accelerate to the upside. We also have confluence with the longer term trend line and a failed quasimodo pattern. The quasimodo pattern gives me insight in the possibility of a large amount of traders sitting in Short positions. Once we move past these previous candle highs they will start to panic or stop loss will get hit. This will create a big move up for gold. I would call this a high probability trade setup.

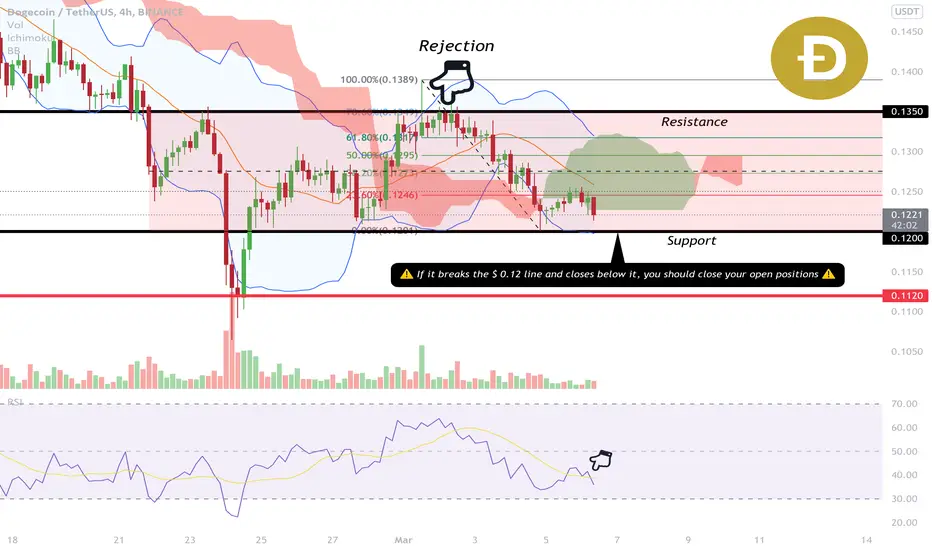
DOGECOIN - ⚠️ Read If You Have An Open Position!❌ As you can see, DOGECOIN was rejected from its resistance, and it is now trading and holding the support level. If it breaks the $ 0.12 line and closes below it, you should close your open positions. Be sure to use a tight stop-loss if you are opening positions.
Internet Computer breakout flag pattern ! Comeback ? 🚀🚀🚀Hello everyone,
The Internet Computer is on the deepest pit in the history of cryptocurrencies. 99.5% from ATH
Fundamental analysis
This is an achievement, thanks to which there is a chance for a large profit, in my opinion it is worth investing in cryptocurrencies that have not reached their previous ATH..
Cryptocurrency in recent days has been doing amazing results in terms of the number of SMART-CONTACT.
Within a month, the number of them doubled from 20k to 40k, which means high activity of developers.
Technical analysis
The best entry will be after a confirmed breakout test.
The best place to place a StopLoss in this situation will be under the last hole, taking into account the profit / loss ratio.
#1 Takeprofit $ 30, #2 Takeprofit $ 50
The RSI indicator is in a similar situation, breaking the moving average and the upcoming breakout retest.
More factors speak of further increases than decreases.
Comment and like,
Greetings

The last chance for a bullish run….fingers crossed BTCBTC has failed many times now to breach above $45K…>last chance to make a major move is NOW. Next 2-3 Days will be huge deciding moment. Here are my bullish projections:
Consolidate lower to $41K - $40K area
BLASTOFF to $47K —> $46K new resistance
If Retest Confirms…..Bullish to $52K —> $60K —> $70K —> $100K
If Retest Fails….Bearish to $28K - $20K
I will be planning on entering LONG position around $40K although we do seem to be approaching support at $41K showing pushback. Perhaps further liquidation to gain buying momentum. Optimistically, we should see a pump and then 50% retracement. I’ve noticed when BTC goes up by X amount, it almost always goes back down 50% on BULLISH runs.
Best of luck traders, the world is adopting bitcoin faster than we know. It’s only a matter of time before mainstream wave pushes Bitcoin into PARABOLIC mode.

Selloff Coming? Waiting for the Cliff Drop to 32KAlthough we have strong support at $36K….the news around the world is not looking nice. Bitcoin Fear and Greed index is at 20 (almost all time low) for confidence in the market. The euro and ruble are down bad, and we are still facing the unknown as far as investors lifeboating BTC and potential sell off. Momentum will be hard to pick back up considering the EMA cloud until mid March. Here is my current trade:
Entry Price $38,000
Target Take Profit Price $32,500
Stop Loss $38,500
Bearish Position
Trade Smartly, Always use stop loss. Stay up to date on the latest events. BUY DIPS AND EAT CHIPS

$1 FOR XRP NOW !? TRIANGEL PATENT ELIOOTTA! 🚀🚀🤠🚀🚀Hello everyone,
Today I pasted a picture of what it always looked like for Eltioott.
As we know well, a breakout up and a confirmed retest are indicative of gains.
The price can reach $ 1 and then go back to $ 0.85 for a while, which is what this patent tells us, and start BULLRUN.
Anything can happen in the stock market, and just like a tothemoon, we can have a totheground.
We must have a prepared stoploss if we play LONG on the presented idea.
Also in our mind is the retest from the bottom and the DOUBLE BOTTOM exit for $ 0.5.
The recent days for Ripple in the SEC case have been very positive, and the case itself may end sooner than in April.
Additional great information is that a transfer of 40 million XRP pieces to COINBASE has been made.
Probably the stock market will soon make a cryptocurrency relist, which will bring many new investors and positive thoughts.
XRP in January overtook SOLANE, and this month CARDANO, which makes it number 4 without looking at STABLECOIN in terms of MARKET CAPITALIZATION!
What should we observe in the near future so that the price may drop?
- A hot armed conflict in Ukraine.
- Raising interest rates in the US in the first half of the year.
Comment and like
Greetings.
This year will be magical for XRP!

If you buy stocks, use STOP orders!If you buy stocks, use STOP orders.
Don't ride the submarine to the depths of the ocean. If it's a submarine, you want out! Not because the submarine may come back to the surface for oxygen, but because a submarine can stay under for a LOOOONG time, or it can sink (which you don't want). So instead, the goal is to avoid the submarines and to try to ride dolphins...and then hop onto a hot air balloon, that then brings you to an trans-orbital ship that brings you to the international space station. From there, you want to hop into a space shuttle ship that will take you as far as Mars. From there, you want to hop out and hitch a ride w/ passing by aliens, and ride w/ them to another galaxy.
Each of those levels, use stops! Careful that the dolphin isn't on LSD and swims you down to the submarine or to antarctica. Don't let the air balloon drop you back into the ocean where you may hurt the dolphin. The trans-orbital rocket can easily explode. And don't let the international space station explode w/ you in it...you will be stranded in outer space and freefall back onto the top of the hot air balloon. Be weary of the space shuttle ship flying on the wrong course into the sun (that is oblivion). And make sure the extraterrestrials are headed in the direction away from earth.
Do I have any stocks that are in orbit or in outer space or on their way out of the ocean. No. So take what I say with a tub boat overflowing of salt. But, conceptually, what I said ought to be the real goal. Long term investing but playing it w/ smart, protective tools to ensure that we stay away from submarines. The main goal really is to avoid submarines. Anything else is bonus.

$OMG / USDT LONG Trade SetupOMG Coin looks very good here. Many other S-Coins do too.
Good luck on your trading!

BTC/USDT (4H) Could this be the DIp to buy ? - short term long Hi Traders,
You probably think what the hell is going on with entire market and BTC especially as it dictate trend for entire Crypto market.
In my opinion we need to finish One short subwave of wave (V) of C. C is Major Corrective wave of entire growth from 3 to 69K.
So if my Elliot wave count is correct, than we will see Bottom of the Dip around 30-32K USD.
BUT. Many traders alredy expect this zone and want to buy. So I expect some F@ckUp. So
1) Either we will dip only to area aroun 33K (and most BUY orders will not be filled)
2) We will fall below 30K where more Stop-losses will be triggered what could extend last wave to something like 29-27K Area.
Be ready for both scenarios and Ladder your entry.
Also consider your strategy and RRR ;)

My entry for SHORT on BTC! Double BOTTOM? ⬇️💲💲💲Hello everyone,
I present my today's entry SHORT with leverage on BTC.
Leaving the flag with the bottom is a signal for me to take a short position.
I put a stoploss on the last short term hill.
I divided the profits on the lines I found, which may be resistance.
On the way to the second TP, I will shift STOP LOSS in place of the $ 37777 entry.
I predict a rebound from the trend line. It shows the way for the bears from the last ATH.
The moment when the chart hits it, may push the price to the last low or even lower.
You want more ?
Comment and like,
Greetings

BTCUSDBTC
Bitcoin dump - again. What now? Whole market is under pressure because of many reasons. SaP failed, Down Jones failed, FED news, huge inflation, miners banned, russia speaking about regulation of crypto, europe speaking about crypto regulation, china, ...
Really hard times now.
What´s plan? We need to see bounce at first. We are on the strong fibonacci level of last bull market (03/2020) and from the last bulls momentum. So huge support now which have to be safed.
But strong resistance above current price. 40-43K; 45.5K-46.6K; 51-53.5K.
Next stops are 37.3K; 35K; 33K; 30K.
The year 2022 could not start worse.
But if you are using SL a also you take some profit on the way up. You can not be killed ;-)
Stay normal - use SL - always ;-)

BITCOIN head and shoulders 🤚😎✋ Re-test from the trend line!Bitcoin has traced the head and shoulders. In addition it bounced off a downward trend which looks really good.
Idea to enter with a stop loss in place of the last liquidations! Bitcoin may fall further.
Takeprofit at the resistance line!
Comment and like,
Greetings

1INCH Bull's Flag! TO THE MOON? 🔜🌖Hello everyone,
On the chart, I present you a flag pattern. Which from the book's definition, speaks of the continuation of the trend.
I go in, after breaking the top line of the formation.
If the price goes down I have a stoploss ready. It cancels the order with a smaller loss than the expected profit.
It is a quick entry signal.
Comment and like,
Greetings

STOP LOSS > TAKE PROFITHello everybody!
Today I want to discuss with you a question concerning risk management – Is it possible to set a stop loss more than a take profit?
History says…
Historically, traders have a rule according to which a stop loss should not be more than a take profit. There is a logic in this, if you receive more losses than profits, sooner or later your account will disappear.
But time goes by and the market is changing and already today it correctly seems not so ideal.
Every trader should understand that after a large number of trades, the expectation should be positive.
The expectation formula is as follows:
(Average profit value * ratio of profitable positions) – (average loss value * ratio of unprofitable positions) - transaction costs.
In order not to bother with calculations, traders have created a table that simply and clearly shows what a positive expectation is.
According to the table, if only 20% of the total number of your trades are profitable, then the RISK ratio is/The PROFIT should be 5:1 and higher.
If there are 50% profitable trades, then the ratio may be 2:1, and if there are 60% profitable trades, then the stop loss may be even greater than the take profit.
Therefore, the main rule that a trader should follow is that the smaller the take profit, the higher the win rate should be.
The difference in the markets
It is worth remembering that 80% of the books where these tips on the ratio of risk to profit come from are written about the stock market, which is more inclined to rise than to fall.
On the other hand, currency pairs tend to average.
This is the main difference: in the forex market, if the stop is large, you can sit out the fluctuations, if the take is large– you can not wait for it to work out.
You need to understand when and where to use large take profit and stop loss based on the strategy and the market.
And not because you multiplied the stop loss by 10.
Conclusions
The conclusion may be unexpected for you, but the profit/risk ratio is not an unbreakable rule.
Always adhere to the rule of positive expectation.
Set a stop loss and take profit based on the strategy and the market in which you are trading.

Stop Loss Considerations for Fantom FTM with 30% GainsNo way I would let these 30% gains turn into a loss. I would choose my tolerance for the loss of those gains and set my stop losses according to my tolerance for loss vs my desire to hold the coin. I'm bullish long term but there are too many issues with BTC that could pull it down off these levels.

DREAMS QUEST Wedge Breakout 1043% potential (Desktop Version)Hello traders,
DISSECTING A FALLING WEDGE TRADE
THE STRUCTURE
Todays technical analysis is on DREAMS QUEST. This coin seems to be consolidating in a falling wedge pattern which I have seen many times play out very well for the Kucoin bangers that get listed. What you want to look for on a falling wedge pattern is 3 touches on both the bottom support trend and 3 touches on the top resistance trend. This will be the formation of the bullish consolidation falling wedge pattern as saw in the chart.
The key indicators of a bullish falling wedge pattern are a wide mouth at the beginning of the pattern and bullish price heading up to the top of the pattern. Then an ABC corrective wave during a bearish down trend that consolidates tightly at the end of the pattern. A lot of times you will be able to use a fib tool from the bottom of the recent to the top of the beginning of the wedge and see that the bottom of the wedge generally bounces off of the 50% Fibonacci level indicating the price action may have exhausted the bearish market participants.
THE STOP LOSS
There is nothing more important in trading than risk management and protecting your capital. No matter how good of a pattern you see or how promising a trade set up is, the market could always have some bearish news that completely destroys your position. Thus, if you’re going to trade, USE A STOP LOSS!! Ok, for this particular pattern, placing your stop loss is pretty simple, I have a general rule of thumb to place my stop loss 3% below the last swing low of the falling wedge prior to the breakout. Which this will be placed after your entry which we will go over next but, I have listed it in this tutorial first as it is more important than your entry! Your initial stop loss is at .06295¢
THE ENTRY
Your entry will be upon the breakout of the top of the wedge located in area #1 or upon retest of the breakout areas in box #2 shown on the chart. Upon breakout of the top of the falling wedge pattern, in the box labeled #1 this being your initial breakout area, you’re going to want to see a CLEAR bullish candle on the daily come above the trend line and be in the #1 buy box before entry to confirm that breakout.
KEY NOTE and always a rule of thumb here is patience, your entry will come. Make sure you have a clear closed candle outside of the pattern before you think about opening a trade as there are very often false breakouts and it’s better to have a slightly less favorable entry than to have an entry that will end up getting you stopped out before the trade even starts.
Last but not least, another KEY NOTE to look for when placing your entry is to make sure you watch for a spike or increase in volume upon breakout. This is a solid indication that the selling pressure has been exhausted and the market participants are turning bullish, adding more quality to your trade. ALWAYS LOOK FOR THIS INDICATOR FOR OPTIMAL TRADE RESULTS. The entry for this trade should be between .08718¢ and .09880¢
THE ALLOCATION
I generally enter with 25%-50% of my allocation I have set aside for this trade at this point. When you’re actively trading it is important to keep your allocation low as when you have a large amount of your capital in a specific trade the hardest parts about trading start affecting you and coming into play. That is the psychology of the trade. The more money you have in any given trade will draw bigger fear and bigger ego if you have a loss or a win. Both are equally bad in trading and will cause you to lose money. So when I say I allocate 25%-50% of the funds I have for this specific trade you have to keep in mind that you should not be using more than 3% of your total account in any particular trade this, my 25%-50% is actually .75%-1.5% of my total account. This makes it easier to just let the trade ride and to follow my plan regardless if I am correct or wrong about my trade, it’s is a calculated loss with a small amount of capital allowing me to have a higher chance of having a smaller drawdown on my overall capital if the market gets bearish on me while I’m in a few longs. So, getting to the other half of my allocation. Generally a consolidation like this will have a very bullish breakout that will pop a hot few candles out of the pattern and generally head to the .618-.5 fib measured from the top to the bottom of the full falling wedge pattern. At this point I take a small amount of profit. About 50% of my current position. This will leave me with .375%- .75% of my capital still in the trade and a small amount of profit that I made from the initial breakout on the side. Now here comes the most important attribute you need to be a good trader, PATIENCE !!! After my small win, I am looking to enter back into this trade at the official retest of the breakout of the pattern. This generally comes shortly after the first target is hit. Again, patience is imperative to your success as a trader. Wait it out until you have a clear candle back at the entry point before you add your second half of your position.
PATIENCE IS KEY BUT, ALARMS HELP!
Have I mentioned that patience is an important attribute you must have to be a successful trader? Not enough? Ok, we’ll it is! I do know that all of our time is very precious and dear so, I have a small remedy to help with allocations your time so you’re not just starting at your charts… USE ALARMS!! TradingView had everything that you need to be successful, it is your responsibility to learn it so you can earn it! I generally first set an alarm at the entry point of my trade set up that I have identified as well as where I’d expect the stop loss to be. #1, so I can be reminded that the trade has either entered my first entry zone, or to let me know that the trade I have identified may not be what I thought it was and to re assess the situation or find a new trade. Again, patience! So, after my entry alarm goes off and I start my initial position, I then set my stop loss and assure my alarm is set a few pips above my stop loss so I can be alerted before it hits as well as well as an alarm at my first target and one more at my entry point. This way I can be alerted that my first take profit was hit and if the price action comes back down to retest I have an alarm there as well to place my second position along with my profit from the first target TP allocated to the whole trade. At this time I double check that my stop loss is a market stop for my total position and that I have an alarm set up for it that sends a text to my phone just in case!
After this I gage my take profit targets and place alarms on all of them as well.
SETTING YOUR TAKE PROFIT TARGETS
This is what we are here for, the profit right? So it’s important that you have take profit targets (TP TARGETS) on your chart as you need to plan the points you’d like to exit your trade. The first target I find is the total and final take profit of the pattern, which can be determined by measuring the distance between point A and point B which can be found at the beginning of the mouth of the falling wedge as shown in the diagram above on the top of the chart. Once you have the distance measured between points A and B you can then ad this measurement on top of the first area of the breakout candle on the bottom of the falling wedge pattern as soon as the price action shows you where it is breaking out. KEY NOTE is to always make sure you’re being conservative and by this I mean, when placing the distance from A to B on C to D, it is important that you don’t try and get it perfectly to the full measure meant on C To D. What I do is shave off a few % from the total measurement so I can allow for margin of error with my target. Minimum of 3%. Now that I have my final target set up at .99704¢ I then take a Fibonacci tool and run it from the top of the pattern to the bottom of the pattern and place TP targets at both the .5 Fib and the .618 Fib lines. I find that this is the easiest way to get quick targets on a falling wedge pattern that the price action generally will react to while heading to the final target. The .5 Fib is at .34509¢ TP target #2 and the .618 Fib TP target #1 is at .23311¢.
Congrats, you’re almost done with your trading plan! Now to the best part!
GETTING PAID!!
Everyone’s favorite part about trading! Ok, now that you have entered the quality trade, have your risk management set up and are ready to get into some profits here we can set a plan for taking some of those beautiful profits. Now being that we have 3 target areas here I generally have 3 separate take profit %’s that I set up along the way by lieu of limit sell orders for the first two TP targets. My take profit target allocation strategy is generally the 33.3% take profit strategy at every target. So for the first two targets, I will set limit sell orders for 33.3% and a 33.4% of my allocation adding up to 66.7% after the first two targets are hit. This way I am already in profit just in case something goes wrong along the way. KEY NOTE it is always smart to take profit, as if you don’t you’re just an investor without a plan and you’re never profitable until you take profit, so congrats, at this point you’re a profitable trader! Yaaayy!! Ok, so for the final take profit I set a market order as a lot of times when the final take profit comes about the price action can quickly get up to this area and we don’t want to be stuck looking for someone to take the coins off of our hands, we want to get them sold and go celebrate our win by looking for our next trade so we can compound these gains amirite??
So awesome, we have a W on the board so we’re done right? No, there’s another tip you should know in trading to assure profits and apply better risk management strategies. What is this you ask?
KEEPING AS MUCH PROFIT AS YOU CAN
How do we do this? Simple, after your first two take profits hit, which you will be reminded on your cell phone via text message because you, ya sly devil, you set up alarms on your TP targets and now are going to head over to your exchange and move your stop loss up aren’t ya? Of course you are! Where are you moving it to? Why not make that right at your entry point so not only are we assuring we don’t lose any money on this trade at all, but, we are in fact in profit from 3 separate TP targets that we cashed in on!! NOOOOYCE!! So now that we are deciding on what color Lambo we want, we can assure we still have some bank roll by tossing that stop loss up from .06295¢ to the entry of the trade between .08718¢ and .09880¢
Ok, you have it all set up, I wish you the best and make sure you’re doing your own research as I am not a financial advisor nor is this financial advice. Before we end, here is some key note reviews and the signal targets for the original trade below.
KEY NOTE AND TAKEAWAYS
#1: Patience is key to any successful trader success.
#2: Allocation should always be a fraction of your total account
#3: Be sure to identify the structure based on the rules above.
#4: Wait for a CLEAR breakout by looking for a daily candle close above the resistance trend line on the top of the falling wedge
#5:The retest happens after the breakout
#6: Not the 6th most important but, ALWAYS USE A STOP LOSS!!
#7: ALARMS make life easy!
#8: You have to take profit to be profitable! SO TAKE SOME OFTEN!
Entry: .08718¢ and .09880¢
Stop loss: .06295¢
TP1: .23311¢
TP2: .34509¢
Final TP3: .99704¢
P.S. it’s always important to know the fundamentals on a coin, so with that said, below are some stats, coin info and a link to the coins website so you can further research it during your DD.
FUNDAMENTALS
Dreams Quest Coin Price & Market Data
Dreams Quest price today is $0.090157396598 with a 24-hour trading volume of $8,589,048. DREAMS price is up 31.4% in the last 24 hours. It has a circulating supply of 0 DREAMS coins and a total supply of 186 Million. If you are looking to buy or sell Dreams Quest, KuCoin is currently the most active exchange.
Dreams Quest is building the first-ever metaverse-based economy, a self-sustaining Dreams Verse where people will be able to participate in the decentralized play-to-earn RPG game using dynamic NFTs. Unknown factors will affect character attributes in-game, and post-game outcomes will dynamically change the NFT card attributes and write them on the blockchain (the ethereal scribes) to show game history for each card.
Website: dreams.quest

TKO / Bitcoin Daily#TKO
BUY AROUND 2500-2700
SEL--2950-3212-3623
jump from here can be expected
Stop Loss %7-

FILECOIN We touch the bottom! My signal to play FUTURES CAREFULLHello Everyone,
My LONG performance at FILECOIN today. Bitcoin with altas is reaching the bottom.
It has to stop the surge, so it can't go much lower.
I take a position with my BTC analysis.
Of course, with great care and moving the STOPLOSS higher and higher.
As we know, we are in a place where investors behave in a panic and make the biggest mistakes.
With this knowledge, we should be prepared for anything. I mean high price volatility.
Comment and like,
Greetings

AUDJPY(1D) - KILLZONE AHEADIt's a killzone. It doesn't mean you're going to make tons of money.
In fact you have a better chance of losing money.
Unfortunately - I tend to talk more about losses, cuz it's the most important thing in trading to control. Sorry!
Assess your ATR, on this time frame. Know your acceptable loss. Control the loss if shorting in the killzone.
Prepare to lose! All traders need to do that!
Disclaimer: This is not advice or encouragement to trade securities or any asset class. This is not investment advice. Chart positions shown are not suggestions intended to assure you of an advantage. No predictions and no guarantees are supplied or implied. The author trades mostly trend following set ups which have a low win rate of approximately 40%. Heavy losses can be expected if trading live accounts or investing in any asset class. Any previous advantageous performance shown in other scenarios, is not indicative of future performance. If you make decisions based on opinion expressed here or on my profile and you lose your money, kindly sue yourself.

Indian market: Kill zoneThere is a killzone in this.
What this means is that it's an optimal zone to take a controlled loss. Errrh.. that's called a 'stop loss'.
That means there are losses involved.
Shorting markets is well known to be more dangerous than going long in markets.
This is not advice to short.
Disclaimer: This is not advice or encouragement to trade securities or any asset class. This is not investment advice. Chart positions shown are not suggestions intended to assure you of an advantage. No predictions and no guarantees are supplied or implied. The author trades mostly trend following set ups which have a low win rate of approximately 40%. Heavy losses can be expected if trading live accounts or investing in any asset class. Any previous advantageous performance shown in other scenarios, is not indicative of future performance. If you make decisions based on opinion expressed here or on my profile and you lose your money, kindly sue yourself.
